Assessing the U.S. Climate in 2023
[ad_1]
Key Points:
- There were 28 separate billion-dollar weather and climate disaster events identified during 2023—the highest annual disaster count in the 44-year record.
- The average annual temperature of the contiguous U.S. was 54.4°F, which is 2.4°F above average and ranking fifth warmest on record.
- Annual precipitation for the contiguous U.S. was 29.46 inches, 0.48 inch below average, ranking in the driest third of the historical record.
- The Atlantic basin saw 20 named tropical cyclones during 2023—ranking fourth for the most named tropical systems in a year since 1950.
- The preliminary tornado count for 2023 was above average with 1,197 tornadoes reported and an additional 97 preliminary tornadoes still under verification for the October 1 to December 31 period.
- A wildfire broke out on the island of Maui on August 8, becoming the deadliest wildfire in the U.S. in over a century.
- Drought coverage across the contiguous U.S. ranged from a maximum extent of 46 percent occurring on January 3 and a minimum coverage of 19 percent on May 30—the lowest contiguous U.S. footprint since the drought of mid-2020.
- Flash drought impacted much of the Lower Mississippi Valley during the latter half of 2023, resulting in the greatest coverage of exceptional drought in Louisiana—74.2 percent of the state—on November 14.
Other Highlights:
Billion-Dollar Weather and Climate Disasters
In 2023, the U.S. experienced 28 weather and climate disasters each incurring losses that exceeded $1 billion. 2023 surpassed 2020, with 22 events, for the highest number of billion-dollar disasters in a calendar year. These disasters included: 17 severe storms, four flooding events, two tropical cyclones, two tornado outbreaks, one winter storm, one wildfire and one drought and heat wave event.
The U.S. disaster costs for 2023 was $92.9 billion. This total annual cost may rise by several billion as additional costs from identified events are reported. There were at least 492 fatalities associated with these events. The costliest events in 2023 were:
- The Southern/Midwestern drought and heat wave that occurred during Spring to Fall of 2023. The total cost of this disaster was $14.5 billion.
- The Southern and Eastern severe weather event that occurred in early March had a cost of $6.0 billion.
Over the last seven years (2017–2023), 137 separate billion-dollar disasters have killed at least 5,500 people and cost greater than $1 trillion in damage.
This is also a record 13th consecutive year where the U.S. experienced 10 or more billion-dollar disasters and the fourth consecutive year (2020–2023) where 18 or more billion-dollar disasters impacted the U.S.
Since records began in 1980, the U.S. has sustained 376 separate weather and climate disasters where overall damages/costs reached or exceeded $1 billion (based on the CPI adjustment to 2023) per event. The total cost of these 376 events exceeds $2.660 trillion.
Temperature
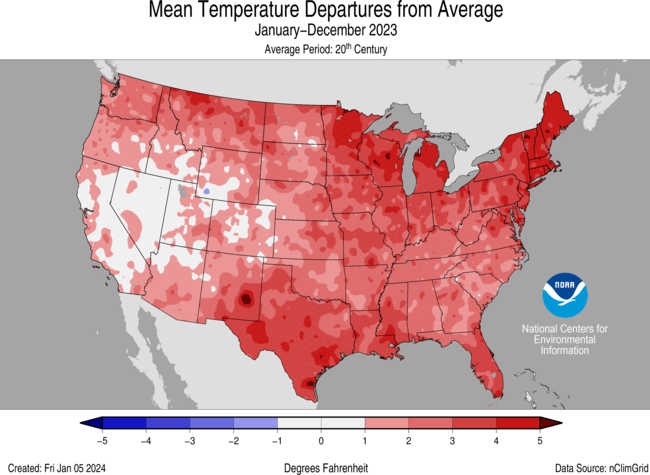
For the year, temperatures were above average across most of the contiguous U.S., with near- to below-average temperatures from parts of the central Rockies to California. Texas, Louisiana, Mississippi, New Hampshire and Massachusetts each ranked warmest while Maine, Vermont, Connecticut, Maryland, Virginia and Florida each ranked second warmest in the 129-year record. An additional 24 states experienced a top-10 warmest January–December on record.
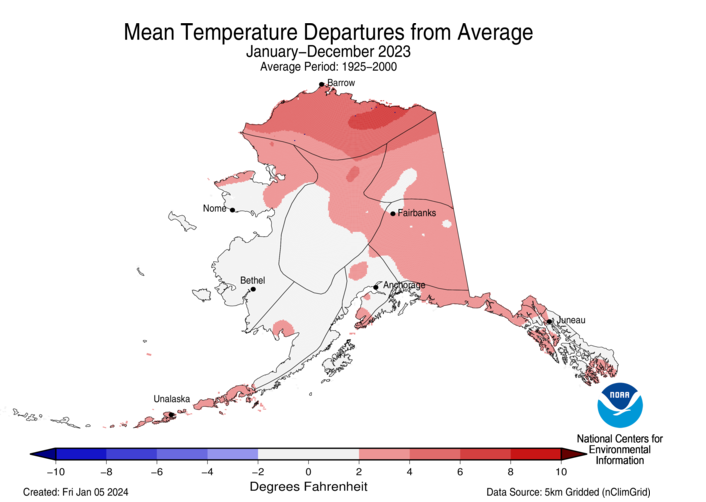
The Alaska January–December temperature was 28.4°F, 2.4°F above the long-term average, ranking 17th warmest in the 99-year record for the state. Much of the state was above normal for the 12-month period while temperatures were near average across parts of southern, western and interior parts of the state.
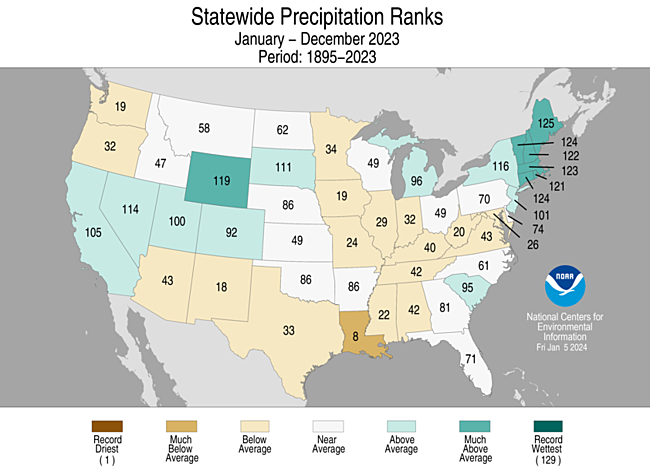
Precipitation
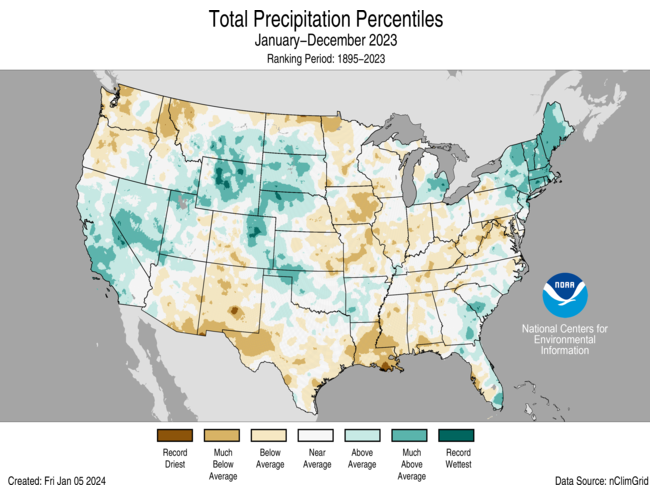
Precipitation was above average across much of the Northeast, from parts of the western Plains to California, as well as in parts of the Great Lakes, southern Plains, Mississippi Valley and Southeast. Precipitation was below average from parts of the Southwest to the Gulf of Mexico, parts of the Northwest, the Ohio Valley to Mid-Atlantic and much of the Mississippi Valley. Louisiana had the eighth-driest January–December on record. Conversely, Maine ranked fifth wettest, while Vermont and Connecticut each ranked sixth wettest on record for this 12-month period. Three additional states ranked among their top-10 wettest for this year-to-date period.
January–December 2023 ranked fifth wettest on record for Alaska, with above-average precipitation observed across most of the state. Near-normal precipitation was observed in parts of the Southwest, while parts of the Aleutians experienced below-average precipitation during this period.
Tropical Cyclones
Record-warm sea surface temperatures in the Atlantic basin brought 20 named tropical systems during 2023, ranking fourth for the most named storms in a year since 1950. Seven of these storms were hurricanes, including three that intensified to major hurricanes, while three of these storms made landfall in the U.S.—Hurricane Idalia and tropical storms Harold and Ophelia.
Several notable storms brought destruction and flooding to portions of the U.S. and its territories during the months of August and September:
- On August 8, winds from Hurricane Dora exacerbated a wildfire on the island of Maui, Hawaii, making it the deadliest wildfire in the U.S. in over a century.
- On August 18, the first-ever tropical storm watch was issued for southern California as remnants of Hurricane Hilary brought record-breaking rainfall and flooding to parts of the Southwest.
- On August 22, Tropical Storm Harold brought strong winds and heavy rains to parts of the southern Plains.
- On August 30, Hurricane Idalia made landfall in the Big Bend region of Florida as a Category 3 hurricane. This is the strongest hurricane to hit the region in more than 125 years.
- Hurricane Lee brought catastrophic flash flooding and damage to portions of New England before it made landfall just across the border in Canada.
- On September 23, Tropical Storm Ophelia made landfall in eastern North Carolina and moved north along the East Coast. Ophelia brought heavy rain and flooding from North Carolina to Massachusetts, resulting in significant damage and power outages.
Tornadoes
The 2023 tornado count was above the annual 1991–2020 annual average across the contiguous U.S. with 1,197 confirmed tornadoes reported, with an additional 97 preliminary tornadoes still under verification during the October 1 to December 31 period.
- On January 2–4, a tornado outbreak occurred across portions of the southern Plains, Southeast and Illinois. A total of 61 tornadoes was confirmed by the National Weather Service. The tornadoes and severe thunderstorms with hail caused significant damage to the region. Nine of these confirmed tornadoes occurred in Illinois on January 3—the highest number of tornadoes in January for the state since 1989.
- On January 16, two tornadoes were confirmed by the National Weather Service in Iowa—the state’s first January tornadoes since 1967.
- On February 26–27, a tornado outbreak occurred across portions of the South and Midwest. A total of 27 tornadoes, including three EF-2 tornadoes, was confirmed by the National Weather Service. The tornadoes caused damage to portions of Texas, Oklahoma, Kansas, Missouri, Illinois, Indiana and Ohio. A total of 11 of these confirmed tornadoes occurred in Oklahoma on February 26—the highest number of tornadoes in February for the state since records began in 1950.
- An EF-1 tornado touched down on March 22 in the Los Angeles area, becoming the strongest tornado to hit the area since 1983.
- On March 24–26, a tornado outbreak occurred across portions of the Southeast and caused catastrophic damage in Tennessee, Mississippi, Alabama and Georgia. A total of 41 tornadoes, including an EF-4 and three EF-3s, was confirmed by the National Weather Service.
- On March 31, nearly 28 million people were under tornado watches as a widespread and deadly tornado outbreak occurred across portions of the Midwest and southern U.S. More than 110 tornadoes, including an EF-4 and eight EF-3s, were confirmed by the National Weather Service—the largest outbreak in a 24-hour period for the month of March.
- On April 1, a 700-yard-wide EF-3 tornado touched down in Delaware, becoming the widest tornado in the state’s history and tying as its strongest.
- On April 30, a state of emergency was declared after a rare EF-3 tornado touched down in Virginia Beach, destroying more than 100 structures.
Fires
The number of wildfires in 2023 was close to the 10-year average (2013–2022) with more than 55,500 wildfires reported over the year, while the total acres burned from these wildfires—2.6 million acres—were well below this 10-year average of 7.1 million acres. In Alaska, nearly 300,000 acres burned during the 2023 fire season—less than half of the state’s seasonal average.
Smoke from Canadian wildfires caused significant air quality issues for millions in portions of the Northeast and Great Lakes this year. On June 7, around 100 million people across 16 states were under air quality alerts while New York City reported the worst air quality of major cities worldwide. On June 27, Chicago reported the worst air quality of any major city in the world as wildfire smoke affected a large portion of the Midwest.
Drought
The year began with the peak coverage of 46.3 percent of the contiguous U.S in drought. Drought coverage shrank as late winter and spring atmospheric rivers and the summer monsoon brought above-normal precipitation to much of the western U.S, recharging some of the major reservoirs that dropped to their lowest levels in 2022. Drought reached a minimum extent of 19 percent on May 30—the smallest contiguous U.S. drought footprint since mid-2020.
Extreme short-term dryness across the Mississippi Valley, combined with persistent dryness across parts of the Plains, reduced streamflow in the Mississippi River to record low water levels for the second year in a row, closing off a vital channel to barge traffic at a crucial time of the year for the transport of crops from the nation’s heartland.
Heat
Several other notable heat events brought record-breaking warmth to portions of the U.S. this year:
- A heat wave caused temperatures to soar well above 100°F across parts of the southern Plains.
- In Texas, the cities of Del Rio and Rio Grande reached 113°F and San Angelo reported 114°F on June 20, setting the all-time heat record at each location. On June 24, the temperature at Rio Grande Village, Texas topped out at 119°F, only 1°F below the all-time temperature record for the state.
- Phoenix, Arizona had an average temperature of 102.8°F for the month of July—the hottest month on record for any major city. Contributing to the record, Phoenix had 31 consecutive days of temperatures above 110°F from June 30 to July 30—breaking the previous record of 18 days set in 1974.
- On July 16, Death Valley soared to 128°F, setting a daily-temperature record, and reported its hottest midnight temperature on record at 120°F on July 17.
- On August 24, temperatures in Chicago soared to 100°F, with a 120°F heat index—this was the first 100°F temperature since July 6, 2012 and the highest ever recorded at Chicago’s official climate observation site.
- Phoenix, Arizona had their all-time warmest summer on record this year, with an average summer temperature of 97.0°F—breaking the previous record of 96.7°F set in 2020.
Record-high temperatures have persisted across much of Puerto Rico and the U.S. Virgin Islands during the month of September. San Juan reported a monthly average temperature of 85.8°F, making it the hottest month on record. Also, on St. Croix, Rohlsen Airport had their warmest September on record.
Snowfall
A series of nine atmospheric river events from late December 2022 into mid-January 2023 dumped a record amount of rain and mountain snow across parts of the western U.S, hitting California particularly hard causing more than 700 landslides, over 1,400 rescues plus loss of life. By January 26, snow covered nearly 60 percent of the contiguous U.S., while snow cover was below normal from the Plains to the Northeast during January. In February, a rare winter storm dumped heavy snow and record rainfall on portions of Southern California, prompting the National Weather Service to issue the first blizzard warning for the region since 1989.
A winter storm brought heavy snowfall to the Northeast during mid-March. By December 2023, snow cover was below average for most of the contiguous U.S., while portions of the Rockies and central Plains received above-normal snowfall after a blizzard hit the region during the final week of the year. Parts of Alaska observed above-normal snowfall during 2023. More than 39 inches of snow accumulated in Anchorage, Alaska by the end of November, resulting in the snowiest November since record keeping began in 1953—the previous record of 38.8 inches of snow was set in 1994. More than 78 inches had accumulated by the end of the year—with October–December becoming the snowiest water year (October–September) to date in Anchorage.
Climate Extremes Index
The U.S. Climate Extremes Index (USCEI) for 2023 was 65 percent above average and ranked 11th highest in the 114-year record. Elevated warm extremes in both maximum and minimum temperature were observed across portions of the Northeast, Ohio Valley, Upper Midwest, Southeast, South and Northwest. Elevated extremes in the number of days with precipitation, one-day precipitation and wet Palmer Drought Severity Index values were also seen in the Northeast, while the South also experienced elevated extremes in one-day precipitation and dry PDSI values. The West experienced elevated extremes in wet PDSI values. The USCEI is an index that tracks extremes (falling in the upper or lower 10 percent of the record) in temperature, precipitation, drought and landfalling tropical cyclones across the contiguous U.S.
This annual summary from NOAA National Centers for Environmental Information is part of the suite of climate services NOAA provides to government, business, academia and the public to support informed decision-making. For more detailed climate information, check out our comprehensive Annual 2023 U.S. Climate Report scheduled for release on January 12, 2024. For additional information on the statistics provided here, visit the Climate at a Glance and National Maps webpages.
[ad_2]