Attitudes and Opinions of Teachers on Student Descriptive Assessment: A Case Study on the Teachers of Geology-Geography at Secondary School (Greece)
[ad_1]
1. Introduction
Natural sciences are part of every curriculum around the globe and an essential element of students’ education. In Greece, the subject of Geology-Geography is taught during the first two grades of junior high school. Teachers are under the obligation to provide their assessment regarding the student’s progress on a numeric scale (1–20) in two semesters. They can also use descriptive assessment as a complementary technique but in an unofficial way.
The main focus of this research is (1) to conclude whether descriptive assessment is accepted as a valid form of student evaluation by high school teachers in Greece, (2) to what extent they might be using it already, and (3) whether they are willing or not to apply it to their teaching procedure. It was conducted as a preliminary research phase for the development of a software application concerning descriptive assessment. Before conducting the actual research, the survey questions were pilot-tested on a small sample. Misunderstandings and failed segments in the questions were identified and corrected.
The results provided by this paper will contribute to the understanding of Greek high school teachers’ attitudes and views towards descriptive assessment. This constitutes a novelty regarding the Greek educational system since such research has never been conducted before. It might also initiate a discussion for changes in the way students are being evaluated in Greece and in a variety of countries in Europe since descriptive assessment is not widely used.
Hopefully, this research will be the first of many to follow regarding descriptive assessment in high school so that alternative student evaluation will contribute to a more holistic evolution of students into educated personalities and future active citizens.
2. Descriptive Assessment
Traditional numeric assessment is used in most countries, but some have introduced descriptive assessment, mostly in primary education [1,2].
Teachers, students, and parents are accustomed to providing and receiving numerical grades, and this fact has created the unjustifiable perception that descriptive assessment is a secondary process and, in some cases, only complementary. As mentioned by Bazargan [3], numerical assessment focuses more on final scores and the associated degree of success, thus separating the learning process from the evaluation. On the other hand, descriptive assessment is regarded to reduce anxiety and rivalry among students, focusing on deep learning and enhancing students’ intrinsic motivation to learn [4]. Descriptive assessment aims to describe each student’s personal journey through knowledge without competitive comparison between the students. It is always aligned with the initial objectives and reports on students’ achievements and setbacks and the way they overcome them, as well as with the areas that might need special attention from the students or assistance from the teacher.
There is a continuity of the assessment process with the provision of more information and details on the student’s progress. For the descriptive assessment to fulfill its potential regarding the advancement of the students, it needs to focus “not only on the cognitive sphere such as knowledge and abilities, but it should take into account psychomotor and socio-emotional level” [2].
Research has revealed that descriptive assessment reduces students’ stress and improves their learning [1]. But why are some educators reluctant to adopt it? Teachers themselves have stated that it is much more time-consuming to prepare descriptive assessment reports for each student separately, and they also lack the training to do so [2]. As mentioned by Talebi and IranNejad [5], “the descriptive assessment requires a certain level of professional growth”. Only by reconceptualizing the role of assessment in teaching and by linking it to overall goals can teachers develop further as professionals [6].
Finally, as mentioned in the PISA 2018 report, “countries and economies tended to have better equity in education when they use student assessments to inform parents about their child’s progress or use written specifications for student performance…” [7].
Although this has been the case in primary education, the situation is quite different in secondary education. According to the latest reports in Eurydice (2023) [8], the countries that use descriptive assessment as their official way of informing parents of their children’s progress are Bosnia–Herzegovina, Czech Republic, Denmark, Finland, France, Germany, Hungary, Ireland, Italy, Liechtenstein, Lithuania, Luxemburg, Poland, Portugal, Malta, Norway, and Romania. Teachers in these countries are asked to provide some detailed feedback, in some cases, along with the grades. In Bulgaria, descriptive assessment is only used for students with disabilities or special education needs.
As it is clearly mentioned in the EACEA report [9] regarding Science Teaching in Europe, the in-class performance and project-based assessment along with students’ portfolios are among the recommended assessment methods according to official guidelines (ISCED International Standard Classification of Education 1 and 2). It is obvious that these assessment methods can be effectively communicated in a descriptive way and not just with a numerical one.
3. Purpose and Objectives
The scope of this study is to record the perceptions, attitudes, and intentions of teachers who teach Geology-Geography regarding students’ assessment with emphasis on descriptive assessment. The research questions are the following:
-
How necessary is the student assessment regarded by the teachers?
-
To what extent are teachers familiar with descriptive assessment procedures?
-
Are there differences in teachers’ attitudes and perceptions regarding student assessment in relation to their major, educational experience, or other characteristics?
-
What factors are considered to facilitate or inhibit teachers’ willingness to use alternative assessment methods such as descriptive assessment?
-
To what extent are teachers of Geology-Geography willing to be engaged in issues of lesson planning and assessment with methods different from those they are accustomed to using, especially regarding the descriptive assessment?
This study is an initial attempt to record tendencies regarding descriptive assessment amongst teachers of secondary education in Greece, which will hopefully shed some light on the best practices to record and present students’ progress and educational evolution.
4. Materials and Methods
The research, as it is presented, was conducted throughout the Greek territory. Simple or random sampling was applied for the selection of the participants who were required to teach the subject of Geology-Geography in the first and second grades of junior high school. The size of the sample (number of schools where the questionnaire was sent electronically) is about 300 schools with an initial response target of N1 = 190 to ensure a rate close to 10% of the total of 1900 school units of daily and evening junior high schools. Finally, 97 questionnaires were answered, a percentage close to 5% of the country’s schools. Teachers, in general, are not accustomed to participating in any kind of research since the vast majority of them are older than 55 years old and are not interested in learning the new trends and developments in education. The total of 97 responses, albeit low, represents an adequate number to record the tendencies amongst teachers regarding students’ assessment. The sample profile contains many schools from urban centers as well as rural areas (Figure 1).
In Greece, the law entitles teachers of different majors to teach Geology-Geography along with their specific subjects. This policy is followed by the Ministry of Education as the best way to handle its human resources. In particular, Natural Sciences are taught separately in high school, so it is very difficult to appoint teachers of 4 different majors (Physics, Chemistry, Biology, and Geology) in each school that work full-time. In addition, due to the geomorphology of Greece, there are a lot of schools in remote areas with a small number of students. The most controversial issue regarding Geology has been the appointment of teachers of Mathematics and Home Economics to teach the subject of Geology-Geography since they are obviously not affiliated with this discipline. As it was recorded and published by the Ministry of Education, currently, the percentages per discipline that teach this course are 34% geologists, 16% physicists, 16% mathematicians, 16% home economists, 9% chemists, and 9% biologists, numbers that are close to our research subjects, thus enabling us to rather safely present the resulting trends.
According to Cohen et al. [10], the added value of educational research is that through it, “educators are given the opportunity to develop a cognitive background that characterizes other professions and disciplines”. Knowledge in relation to structures and processes is useful for the choice of central education policy and possibly for the development of educational tools [11]. A key issue is the large gap between educational research and educational practice [12]. The educational research that was carried out in the present study, intending to record and present the assessment techniques, tools, and materials used by -Geography teachers in Greece, took place in the following stages:
Stage 1: Questionnaire design. At this stage, a questionnaire was designed based on the research questions to record opinions, attitudes, and practices.
Stage 2: Research application. The questionnaires were sent, and the answers were collected.
Step 3: Data entry. The response data were imported into the IBM SPSS 23 free statistical software for statistical processing.
Stage 4: Processing, data analysis, production of results. This step involves extracting tables from the statistical software, plotting data diagrams, and commenting on them in detail to express the results in relation to the research questions. The chi-square test was also applied, which is a test used in statistical analysis to examine the association or independence between categorical variables so as to assess whether there are significant differences between the responses.
This research is quantitative and qualitative and is based on a sample survey with a standard questionnaire because it offers the researcher the opportunity to reach a sufficient part of the population to answer the research questions and then generalize, under certain conditions, the results to the entire population. Of the two types of quantitative research, experimental and descriptive, the latter was chosen, as it represents a method that provides the researcher with a clear overall picture of the sample under examination.
Questionnaires and other research tools are used in descriptive quantitative research. The type of self-completing questionnaire was chosen as a research tool, and the target group was teachers of all specialties who teach the Geology-Geography course. The questionnaire was on an online platform (Google Forms). The questionnaire included 22 questions (Table 1) grouped into four axes, which relate to the following:
-
Personal details regarding years of service and major field
-
Teachers’ perceptions about student evaluation.
-
Attitudes and behaviors of teachers for the use of descriptive assessment in Geology-Geography.
-
Teachers’ intention to use the descriptive assessment and training—the support they need.
The selection of the first axis (personal data) was considered necessary to collect basic data concerning teachers’ educational levels and years of service for the respective statistical analysis.
Regarding the type of questions, descriptive choice questions and questions structured on a five-point Likert scale are included: 1: “strongly agree”–5: “strongly disagree”. The Microsoft Excel program was used for the electronic coding of the questionnaires.
Ethics issues: The anonymity of the teachers who chose to take part in the research was ensured from the beginning. None of the questionnaires includes personal data questions (name, age, home address, or email). Teachers’ involvement in completing the questionnaire took place voluntarily in their free time. The whole process was optional and based on the principles of conscious consent [13].
5. Results and Discussion
Data analysis and categorical variables were performed using IBM S.P.S.S. 23 and pivot tables of Microsoft Excel. Tables were formed with the total results for each population group of the sample, and descriptive statistical techniques were applied with tables and diagrams of relative frequencies for the categorical variables, where the relative frequency is presented in the form of a percentage.
To test the research questions of the study, hypothesis tests (Pearson’s x2) were used to compare categorical variables with each other as well as Multiple Correlation Factor Analysis [14] that allows to display an overall picture of teachers’ approaches and to highlight various correlations or classifications based on field of major, educational experience, or other factors. For all the above controls, a level of statistical significance α = 5% or 95% was set from the beginning.
The results on teachers’ perceptions, attitudes, and behaviors as they emerge from the analysis are presented per question with brief comments. Extensive comments are described at the end of each section and in the conclusions.
5.1. Descriptive Statistical Analysis
The research sample consists of 97 teachers with different majors. Most of them are geologists (33%), however, mathematicians (9.3%), physicists (16.5%), chemists (14.4%), biologists (8.3%) and home economists (18.5%) have also participated. Teachers with 11 to 20 years of service prevail with a percentage of 58.76% (57). Most (91.8%) of the teachers serve in public junior high schools. A large percentage of teachers, 40.6% (39), hold a master’s degree or are currently involved in a postgraduate course.
Random sampling methods are used for this research, but considering Greece is a country with strong geographical variability, the responses received seem to have good representativeness all over the Greek territory in order to obtain reliable results.
The participants in the survey were from Athens (23) and Thessaloniki (10), which are cities with more than 1,000,000 people; Larissa (1) and Heraklion (3), which are cities of 1,000,000–100,000 population; Alexandroupoli (1), Veria (1), Ioannina (1), Karditsa (2), Lamia (7), Xanthi (1), Chalkida (1), and Kalamata (2) with a population of 100,000–50,000; some rural areas (26); and the islands (18) with less than 50,000 inhabitants.
5.1.1. Recording Perceptions for Student Assessment
Assessing a student’s school performance is a process that has always been at the center of discussions about its necessity and pedagogical value. Is evaluating students’ performance a necessary process after all? The answer to this question (Q5) is not unequivocal; there are championing educators–researchers who emphasize the pedagogical dimension of evaluation and adversaries who claim that it creates more problems than it solves. In the present research, 65% of the educators who teach the Geology-Geography course consider that the final assessment is a necessary process. No statistically significant differences were found in relation to the field of major or years of service of the participants.
A large percentage (51.6%) of teachers consider the final assessment using numerical evaluation a necessary process (Figure 2). This finding is in alignment with what is found in the literature regarding the necessity of evaluation in general. For example, Alexatos and Efstathiou [15] report that teachers consider students’ evaluation necessary despite the problems they find in the methods and the way it is applied. They also consider the exams and the students’ grades necessary. Additionally, no statistically significant differences were found in relation to the field of major or years of service of the participants.
Prompt and timely feedback regarding students’ performance is an additional pedagogical value of the evaluation [16]. The final assessment of students using numerical imaging depicting school performance is considered the most important dimension of contribution to the educational process by teachers with a rate of 68.8%, followed by the rest with similar reference rates, while there are no statistically significant differences regarding the field of major or years of service of the participants.
In student assessment methodologies, the two most important parameters are the validity and reliability of the method (Q6). A large percentage (44.3%) of teachers consider the final (cumulative) assessment using numerical imprinting a valid and reliable process (Figure 3). This perspective agrees with research findings that regard numerical evaluation as an objective to measure and present students’ success [17]. At the same time, descriptive assessment is considered equally valid and reliable (Q7). It also fits all teaching subjects (48.5%) and contributes to the systematic monitoring of the development of the students’ skills (Q8).
A large percentage of teachers (50.5%), which is very close to the percentage of those who have been trained in student assessment (60%), consider that they are adequately familiar with the procedures related to descriptive assessment, while a very small percentage of 3.1% states that they do not know anything at all (Figure 4). Apparently, those who have been trained seem to be more confident than others.
A much larger percentage of teachers (61.9%) state that descriptive assessment can complement compulsory grading in secondary education. If this is the case, what might be the factors that lead teachers not to use descriptive expressions of their evaluation results? With a percentage of 58.7%, the participants positively responded when asked whether they used descriptive assessment complementary to their evaluation process (Q10). As is presented in the following paragraph, further analysis showed that those who were familiar with descriptive assessment processes are those who are interested in its integration into teaching. In general, we could say that teacher training is a very important factor in the integration of descriptive assessment in educational practice.
A little more than half of teachers (51.6%) consider the final evaluation using descriptive presentation a necessary process, while there were no statistically significant differences depending on their field of major or years of service, which means that the process is considered necessary regardless of the rating. As the most important dimension of the final assessment’s contribution to the educational process is using numerical imaging, the fact that it provides clear information to those directly concerned is mentioned at a percentage of 68.7%, followed by the systematic monitoring of the students’ skills development by 48.9% of the total answers (Figure 5).
In conclusion, we can safely state that teachers consider the final assessment of the students to be a necessary process (66%). When they were asked about how necessary the numerical imaging of the assessment was, the percentage fell to 50.2%, and this percentage fell even more when they were asked the same question about the descriptive impression of the evaluation (46%). At this point, it should be clarified that this number represents an increased percentage of the undecisive (neither agree nor disagree) and does not exhibit more negative responses regarding the necessity of the descriptive evaluation.
Additionally, a large percentage of the sample (44%) considers the numerical imaging of the evaluation result a valid and reliable process. Nevertheless, more than half of the teachers (59%) state that “the integration of descriptive evaluation in their teaching would interest them”.
Regarding the most important points that the use of descriptive assessment contributes, “the systematic monitoring of students’ skills development” is at the top with 76%, while concerning the use of the numerical impression of the assessment result, “the clear information of those directly interested in school performance” comes next with a percentage close to 69% (Q11).
A little less than half of the teachers (47.9%) stated that the descriptive recording of the evaluation result fits all the teaching subjects (Q12).
5.1.2. Recording Attitudes and Behaviors in Relation to Student Assessment
More than half of the teachers (57.7%) use informal descriptive assessments for personal use, while a small percentage (9.3%) use additional descriptive assessments as a supplement to the grading (Figure 6).
It is interesting to note that a very small but not insignificant percentage uses the descriptive assessment (Figure 6).
As can be seen from the data analysis, the teachers who teach the Geology-Geography course use traditional methods to evaluate oral performance (Figure 7). The examination in the form of discussion gathers the largest percentage (70.5%), while the examination with questions and answers (67.4%) follows and at a very close distance. A less conventional tool, the activities on maps, is found at 64.2%.
It is interesting that the largest percentage of teachers (68.8%) design the assessment tools they use by themselves.
For the evaluation of written performance, almost everyone uses classic short-minute and hourly evaluation criteria (90.7%) (Q15), while for the evaluation of homework, a large percentage uses individual homework (71.1%) and, to a lesser extent, the oral examination (60.8%) (Q16).
For the presentation of the assessment results of the oral performance, the majority of teachers use grades (49.5%). It is interesting that many mention the description of performance (27.8%) and scales of graded criteria (19.6%), which are actually forms of descriptive evaluation.
A great number of teachers who participated in the research (77.1%) believe that the study of maps and answering questions fit better the profile of descriptive assessment in the course Geology-Geography. However, a very small percentage (8.3%) still choose memorization of facts (Q17).
5.1.3. Recording Teachers’ Dispositions towards the Application of Descriptive Assessment of Students and the Factors That Prevent Them from Doing So
In a sample of 97 teachers, a relatively large percentage (40.6%) admitted to not having been trained in student assessment (Figure 8). Among those who have not been trained, almost everyone expressed their willingness to do so. The positive attitude of teachers towards their future training, especially in matters of student evaluation, is clearly recorded.
One-hour courses (i.e., those taught for 1 h per week) have been a point of conflict between the Ministry of Education and various scientific associations for quite a long time, while there are many researchers who consider the teaching time of 45 min per week insufficient.
Christopoulos [18], former Head of the Secondary Education Department of the National and Kapodistrian University of Athens, claims that “if the students are lucky and do not have a sick teacher or other emergencies, such as strikes etc., they could be taught a maximum of 25 weeks”, which means twenty-five forty-five-minute-long lessons for a teacher who teaches a one-hour lesson, in a school year.
An important factor that prevents teachers from choosing descriptive evaluation in practice is the large number of students per teacher, with a percentage of 74.2%, followed by the large number of students per class, with a percentage of 60.8% (Figure 9).
Practically, a teacher who teaches a one-hour-per-week Geology-Geography course should work in a couple of different schools to complete their full-time schedule. This fact, combined with the large number of students per classroom (25–27), means that they could have about 200 students in the first grade of high school to assess and present results.
When asked to state factors that would help to apply the descriptive assessment in practice, having fewer students per class was repeated by participants at a very large percentage (80.4%) (Figure 10).
It should, therefore, be mentioned that the teachers who teach the course largely recognize the need to reduce students per class for properly functioning pedagogical processes, including evaluation (Figure 10).
A vast majority of the teachers state that they would use an official descriptive assessment evaluation system if it was provided by the Ministry of Education (Figure 11), a fact that shows the need there is amongst educators to use alternative methods of students’ evaluation and their willingness to do so if they are given some support.
When analyzing the data in relation to the teachers’ majors, there is no statistically significant difference (p > 0.05), but it is worth noting that at a rate of 87.5% amongst them, geologists would use it (50% unreservedly; 37.5% cautiously).
Of course, the majority (60%) of geologists state that they have been trained in student assessment issues in general. It also seems that their intention to use descriptive assessment is independent of whether or not they have been trained on it, as 79% of those who have not been trained would also use it (47% unreservedly; 32% cautiously).
5.2. Statistical Analysis of Cross-Tabulation Data
During the statistical analysis of cross-tabulation data, Microsoft Excel was used, and pivot tables were formed regarding correlations that were of interest in relation to the teachers’ disposition towards the descriptive assessment.
When there is a need to check if two factors are dependent or independent, it is assumed that they are independent and apply the x2 test (Chi-Square Test). Thus, these factors were checked for statistical correlation, and p was calculated for all the intersection tables that were of some interest for this paper.
Generally, when p > 0.05, this hypothesis cannot be rejected (for independence of variables), while when p < 0.05, the hypothesis is rejected, and the opposite is accepted, i.e., that the variables examined are dependent. T-tests were also applied using Excel in various questions (per major, years of service, etc.).
In Table 2, the two variables that are checked are teachers’ majors and their interest in using descriptive assessment. It was calculated as p = 0.0079
In Table 3, the two variables that are checked are the teachers’ notion of the necessity of the final assessment and the use of a comprehensive descriptive assessment system provided by the ministry. It was calculated as p = 0.0039 Table 3). What has been found to be interesting is the fact that of the teachers who consider the final assessment necessary, 81% would be reluctant to use a comprehensive descriptive assessment system provided by the ministry, which can be explained by the general reluctance of teachers to a period of crisis in relation to the legislation of the ministry.
6. Conclusions
The findings of this research are a first attempt to record notions and practices of Greek teachers regarding students’ assessment in the subject of Geology-Geography taught during the first and second grades of junior high school.
Regarding the necessity of the evaluation, the conclusions of the research are in accordance with the existing papers. Specifically, the teachers who teach the subject of Geology-Geography agree that the final assessment is a necessary process, even though they do not all agree that it should be presented only in a numerical way.
In general, they consider the numerical presentation of the evaluation results as valid and reliable, and it is also recorded that it provides more accurate information regarding the students. This is true since students and their parents are accustomed to receiving grades to record progress, a procedure used in senior high school and university admission exams. Descriptive assessment is considered equally valid and reliable as it provides systematic monitoring of students’ skills development. It was also stated by teachers that it fits all teaching subjects, regardless of their field of major.
Quite a large percentage was found to be unfamiliar with the procedures surrounding the descriptive presentation of the evaluation results. Nevertheless, they show positive attitudes regarding its integration into the educational process, stating that they would be interested. There seems to be a positive correlation between the teachers’ majors and their willingness to use descriptive assessment since geologists and home economists would easily incorporate it into their teaching procedures.
It is encouraging that more than half of the teachers surveyed employ informal descriptive assessment for personal use in an unofficial way, while a very small percentage applies descriptive assessment as a supplement to grading.
The participants reported the insufficient available time per week for the lesson and the large number of students per teacher as inhibiting factors for using descriptive assessment. A key finding of the research is that teachers who consider and are well acquainted with the procedures related to descriptive assessment exhibit a keen interest in its integration into the educational process.
It is highlighted in several points of the research that teacher training is a very important factor for the integration of descriptive assessment in educational practice.
Although teachers exhibit a positive predisposition to receiving training on descriptive evaluation in general, a very high percentage would be reluctant to use an assessment system provided by the Ministry of Education associated with a general mistrust.
This research was designed as a means to record the Greek reality regarding students’ assessment so that a new software application for descriptive assessment could be developed. Nevertheless, it is a fine starting point to open up the subject of more effective and less impersonal ways not only to assess but also to promote students’ educational evolution and development.
Hopefully, education policy makers will take into consideration the need to upgrade the existing evaluation methods and develop an alternative framework for student assessment. This might mean reforming the curriculum or producing new educational material, but it would also lead to better-educated people.
Finally, it is proposed that follow-up research should be carried out to record the impact of the use of descriptive assessment on students’ performance and mental state.
Author Contributions
Conceptualization, K.L., M.P. and A.A.; methodology, K.L., M.P. and A.A.; software, K.L., M.P. and A.A.; validation, K.L., M.P. and A.A.; formal analysis, K.L., M.P. and A.A.; investigation, K.L., M.P., M.V.T. and A.A.; resources, K.L., M.P. and A.A.; data curation, K.L., M.P. and A.A.; writing—original draft preparation, K.L., M.P. and A.A.; writing—review and editing, K.L., M.P., M.V.T. and A.A.; visualization, K.L., M.P. and A.A.; supervision, A.A.; project administration, K.L., M.P. and A.A.; funding acquisition, A.A. and M.V.T. All authors have read and agreed to the published version of the manuscript.
Funding
This research received no external funding.
Data Availability Statement
The data used in this work are available on request to the corresponding author.
Acknowledgments
Τhe APC of this article has been funded by the National and Kapodistrian University of Athens (KE 19432); Internationalization of Higher Education actions MIS 5164455.
Conflicts of Interest
The authors declare no conflicts of interest.
References
- Pouladi, E.; Moghadam, Z.A. The study of effectiveness of descriptive evaluation in 1st and 2nd grade of primary schools in region 3 of Tehran. Procedia Soc. Behav. Sci. 2011, 29, 452–459. [Google Scholar] [CrossRef]
- Talevski, J.D. Descriptive Assessment, Continuous Following and Monitoring of Student’s Achievements and his Development. J. Teach. Educ. 2012, 1, 447–456. [Google Scholar]
- Bazargan, A. Some New Methods in Measuring Learned and Applying Them in Educational Evaluation; Tazkiyeh Press: Tehran, Iran, 2003. [Google Scholar]
- Hassani, M.A. Descriptive Evaluation: The New Pattern in Educational Evaluation; Madreseh Press: Tehran, Iran, 2005. [Google Scholar]
- Talebi, S.; IranNejad, P. Comparing the Descriptive Assessment in terms of Critical and Creative Thinking among the Sixth Grade Students in the Public and Private Schools. UCT J. Soc. Sci. Humanit. Res. 2020, 8, 29–37. [Google Scholar]
- Ayala, C.C.; Shavelson, R.J.; Araceli Ruiz-Primo, M.; Brandon, P.R.; Yin, Y.; Furtak, E.M.; Young, D.B.; Tomita, M.K. From Formal Embedded Assessments to Reflective Lessons: The Development of Formative Assessment Studies. Appl. Meas. Educ. 2008, 21, 315–334. [Google Scholar] [CrossRef]
- OECD. PISA 2018 Results (Volume V): Effective Policies, Successful Schools, PISA; OECD Publishing: Paris, France, 2020. [Google Scholar] [CrossRef]
- European Union. Euridice, an Overview of National Educational Systems—Assessment in Secondary Education; European Commission: Brussels, Belgium, 2023; Available online: https://eurydice.eacea.ec.europa.eu/national-education-systems (accessed on 23 December 2023).
- EACEA Eurydice. Science Education in Europe: National Policies, Practices and Research, Brussels. 2011. Available online: https://eurydice.eacea.ec.europa.eu/national-education-systems (accessed on 23 December 2023).
- Cohen, L.M.; Manion, L.L.; Morrison, K. Research Methods in Education; Neohellenic Research Centre: Athens, Greece, 2008. [Google Scholar]
- Broekkamp, H.; Van Hout-Wolters, B. The gap between educational research and practice: A literature review, symposium, and questionnaire. Educ. Res. Eval. 2007, 13, 203–220. [Google Scholar] [CrossRef]
- Biesta, G. Bridging the gap between educational research and educational practice: The need for critical distance. Educ. Res. Eval. 2007, 13, 295–301. [Google Scholar] [CrossRef]
- Creswell, J.W. Educational Research: Planning, Conducting, and Evaluating Quantitative and Qualitative Research; Pearson Education International: Upper Saddle River, NJ, USA, 2011. [Google Scholar]
- Benzecri, J.P. Correspondence Analysis Handbook; Marcel Dekker: New York, NY, USA, 1992. [Google Scholar]
- Alexatos, C.; Efstathiou, E. Assessment of Students in Secondary Education. How and Why. Master’s Thesis, ATEI Piraeus, School of Management and Economics, Piraeus, Greece, 2018. [Google Scholar]
- Naylor, R.; Baik, C.; Asmar, C.; Watty, K. Good Feedback Practices: Prompts and Guidelines for Reviewing and Enhancing Feedback for Students; University of Melbourne: Parkville, VIC, Australia, 2014. [Google Scholar] [CrossRef]
- Nikolic, N.; Antonijevic, R. Class teacher’s perception of descriptive evaluation. Res. Pedagog. 2013, 3, 31–47. [Google Scholar]
- Christopoulos, P. The Curricula, the book and the Tutorial. In Proceedings of the Panhellenic Conference of the Mathematical Society, Trikala, Greece, 19–21 November 2004. [Google Scholar]
Figure 1.
Geographical sample distribution according to population.
Figure 1.
Geographical sample distribution according to population.
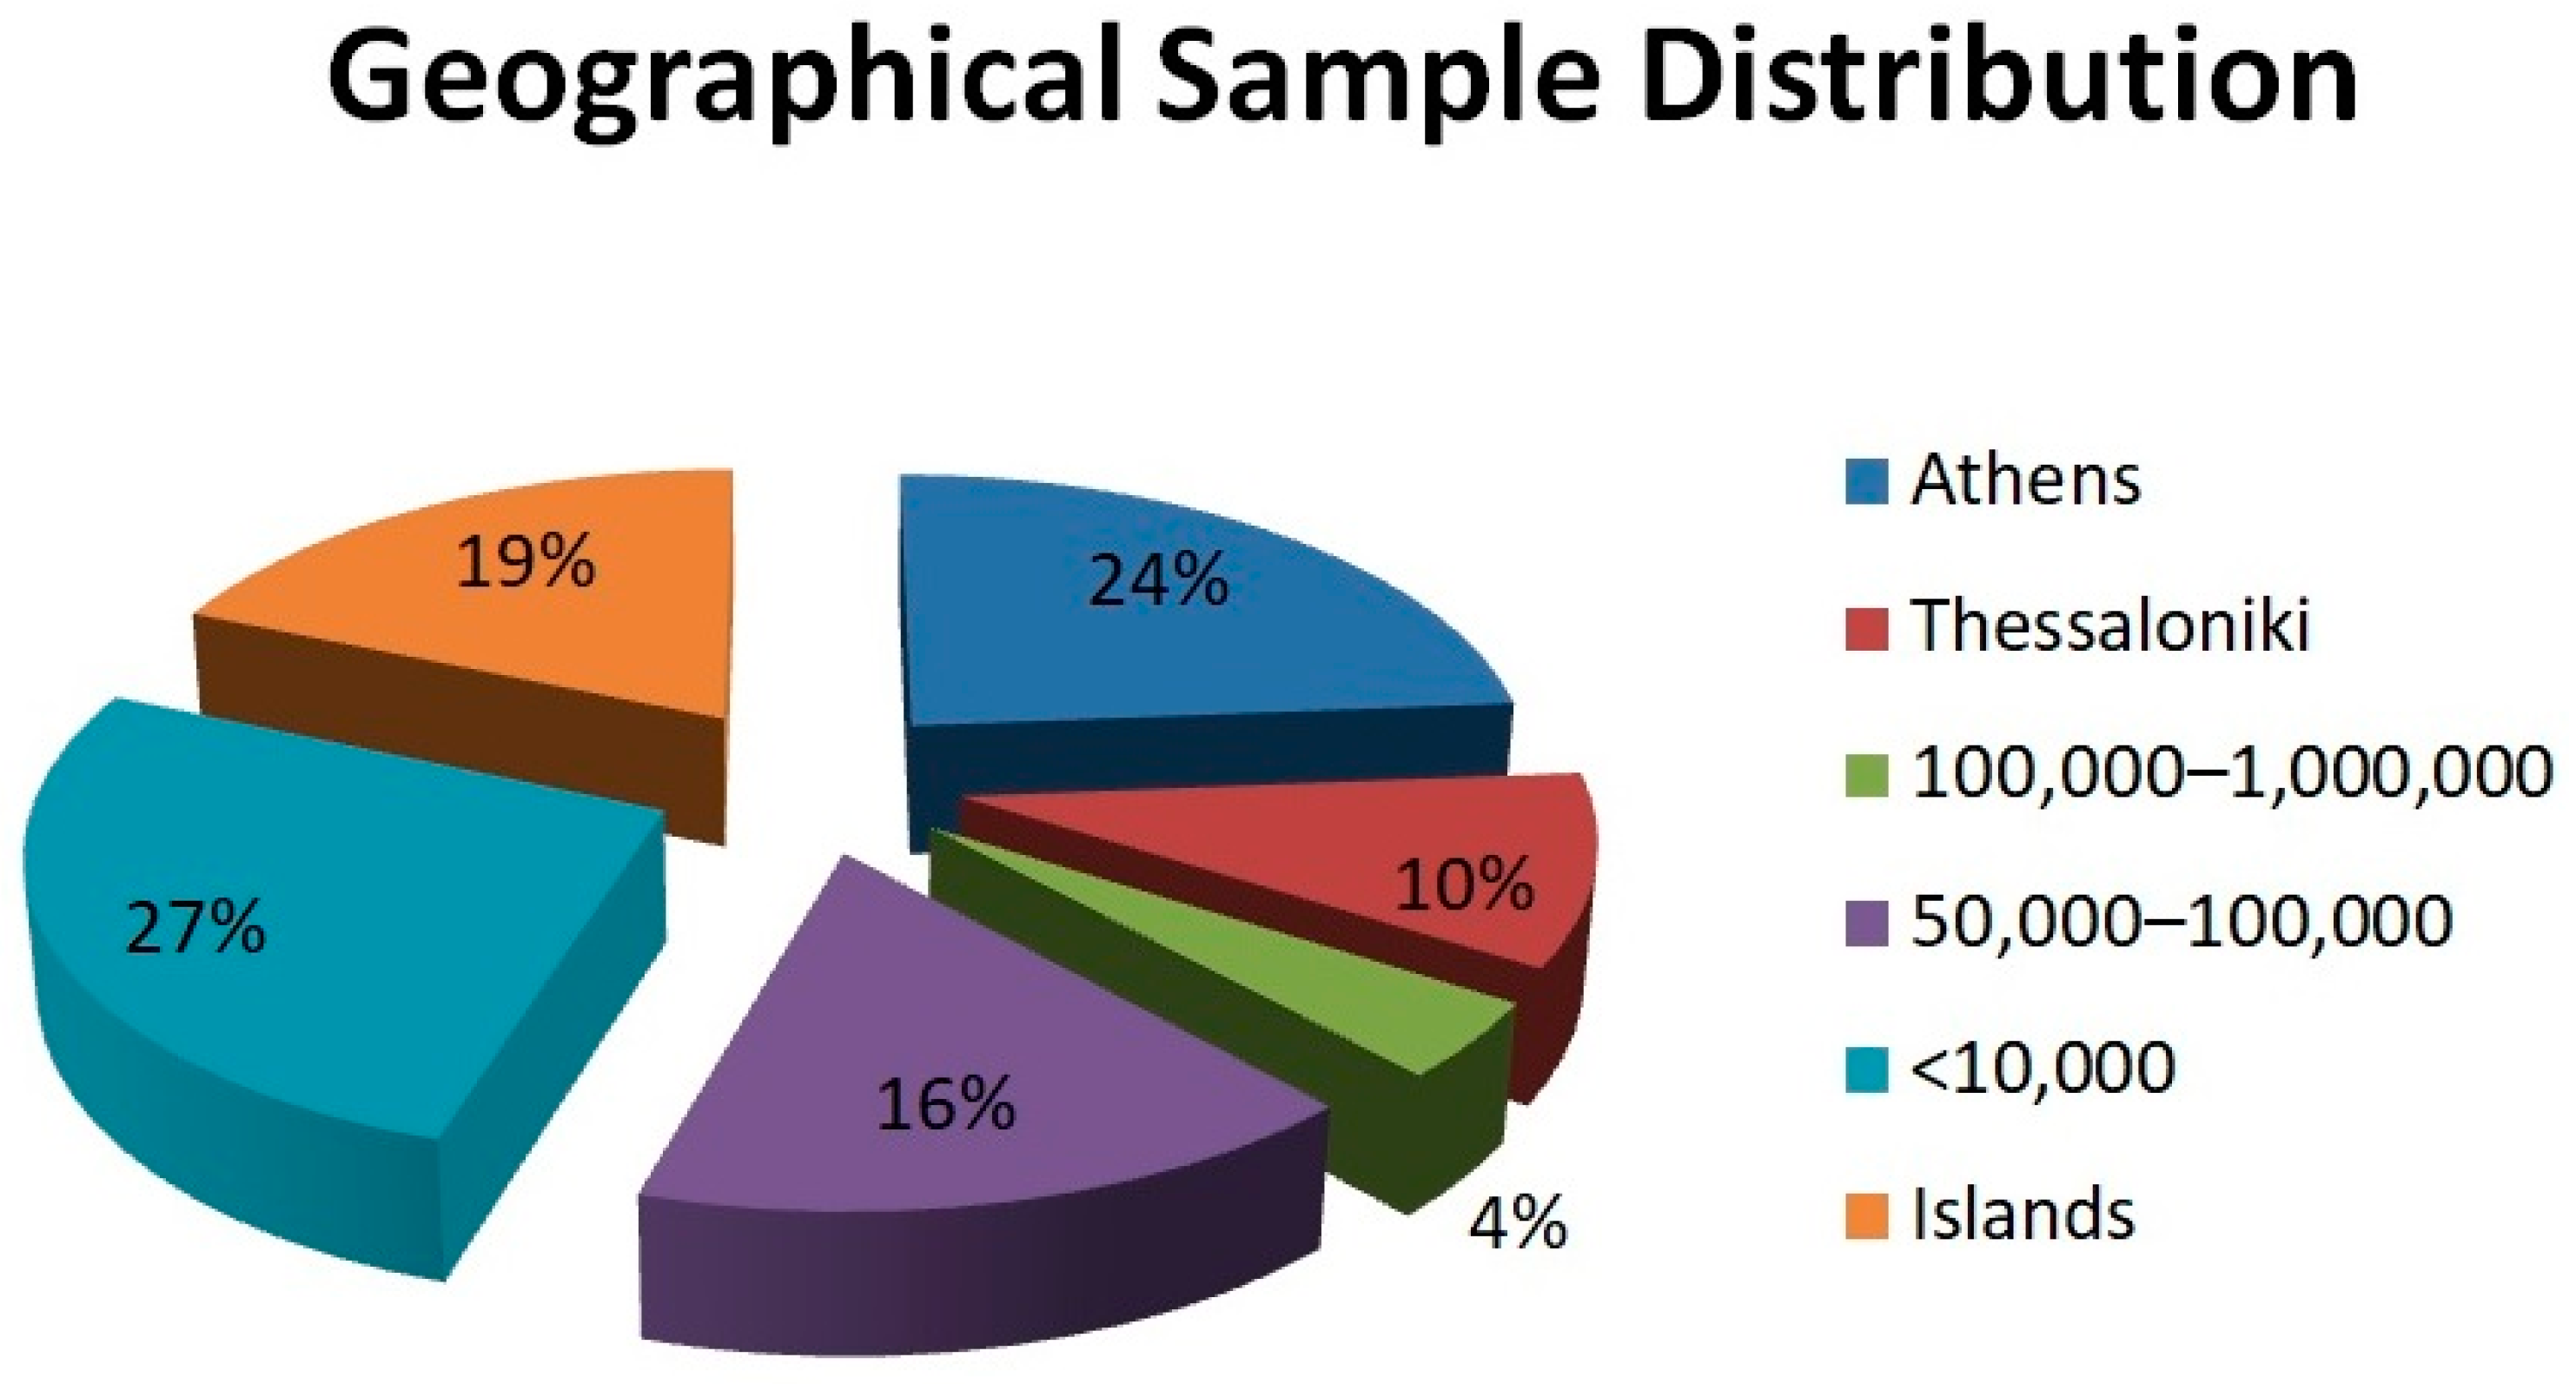
Figure 2.
Q5: State your opinion on whether the final assessment is a necessary process for high school students.
Figure 2.
Q5: State your opinion on whether the final assessment is a necessary process for high school students.
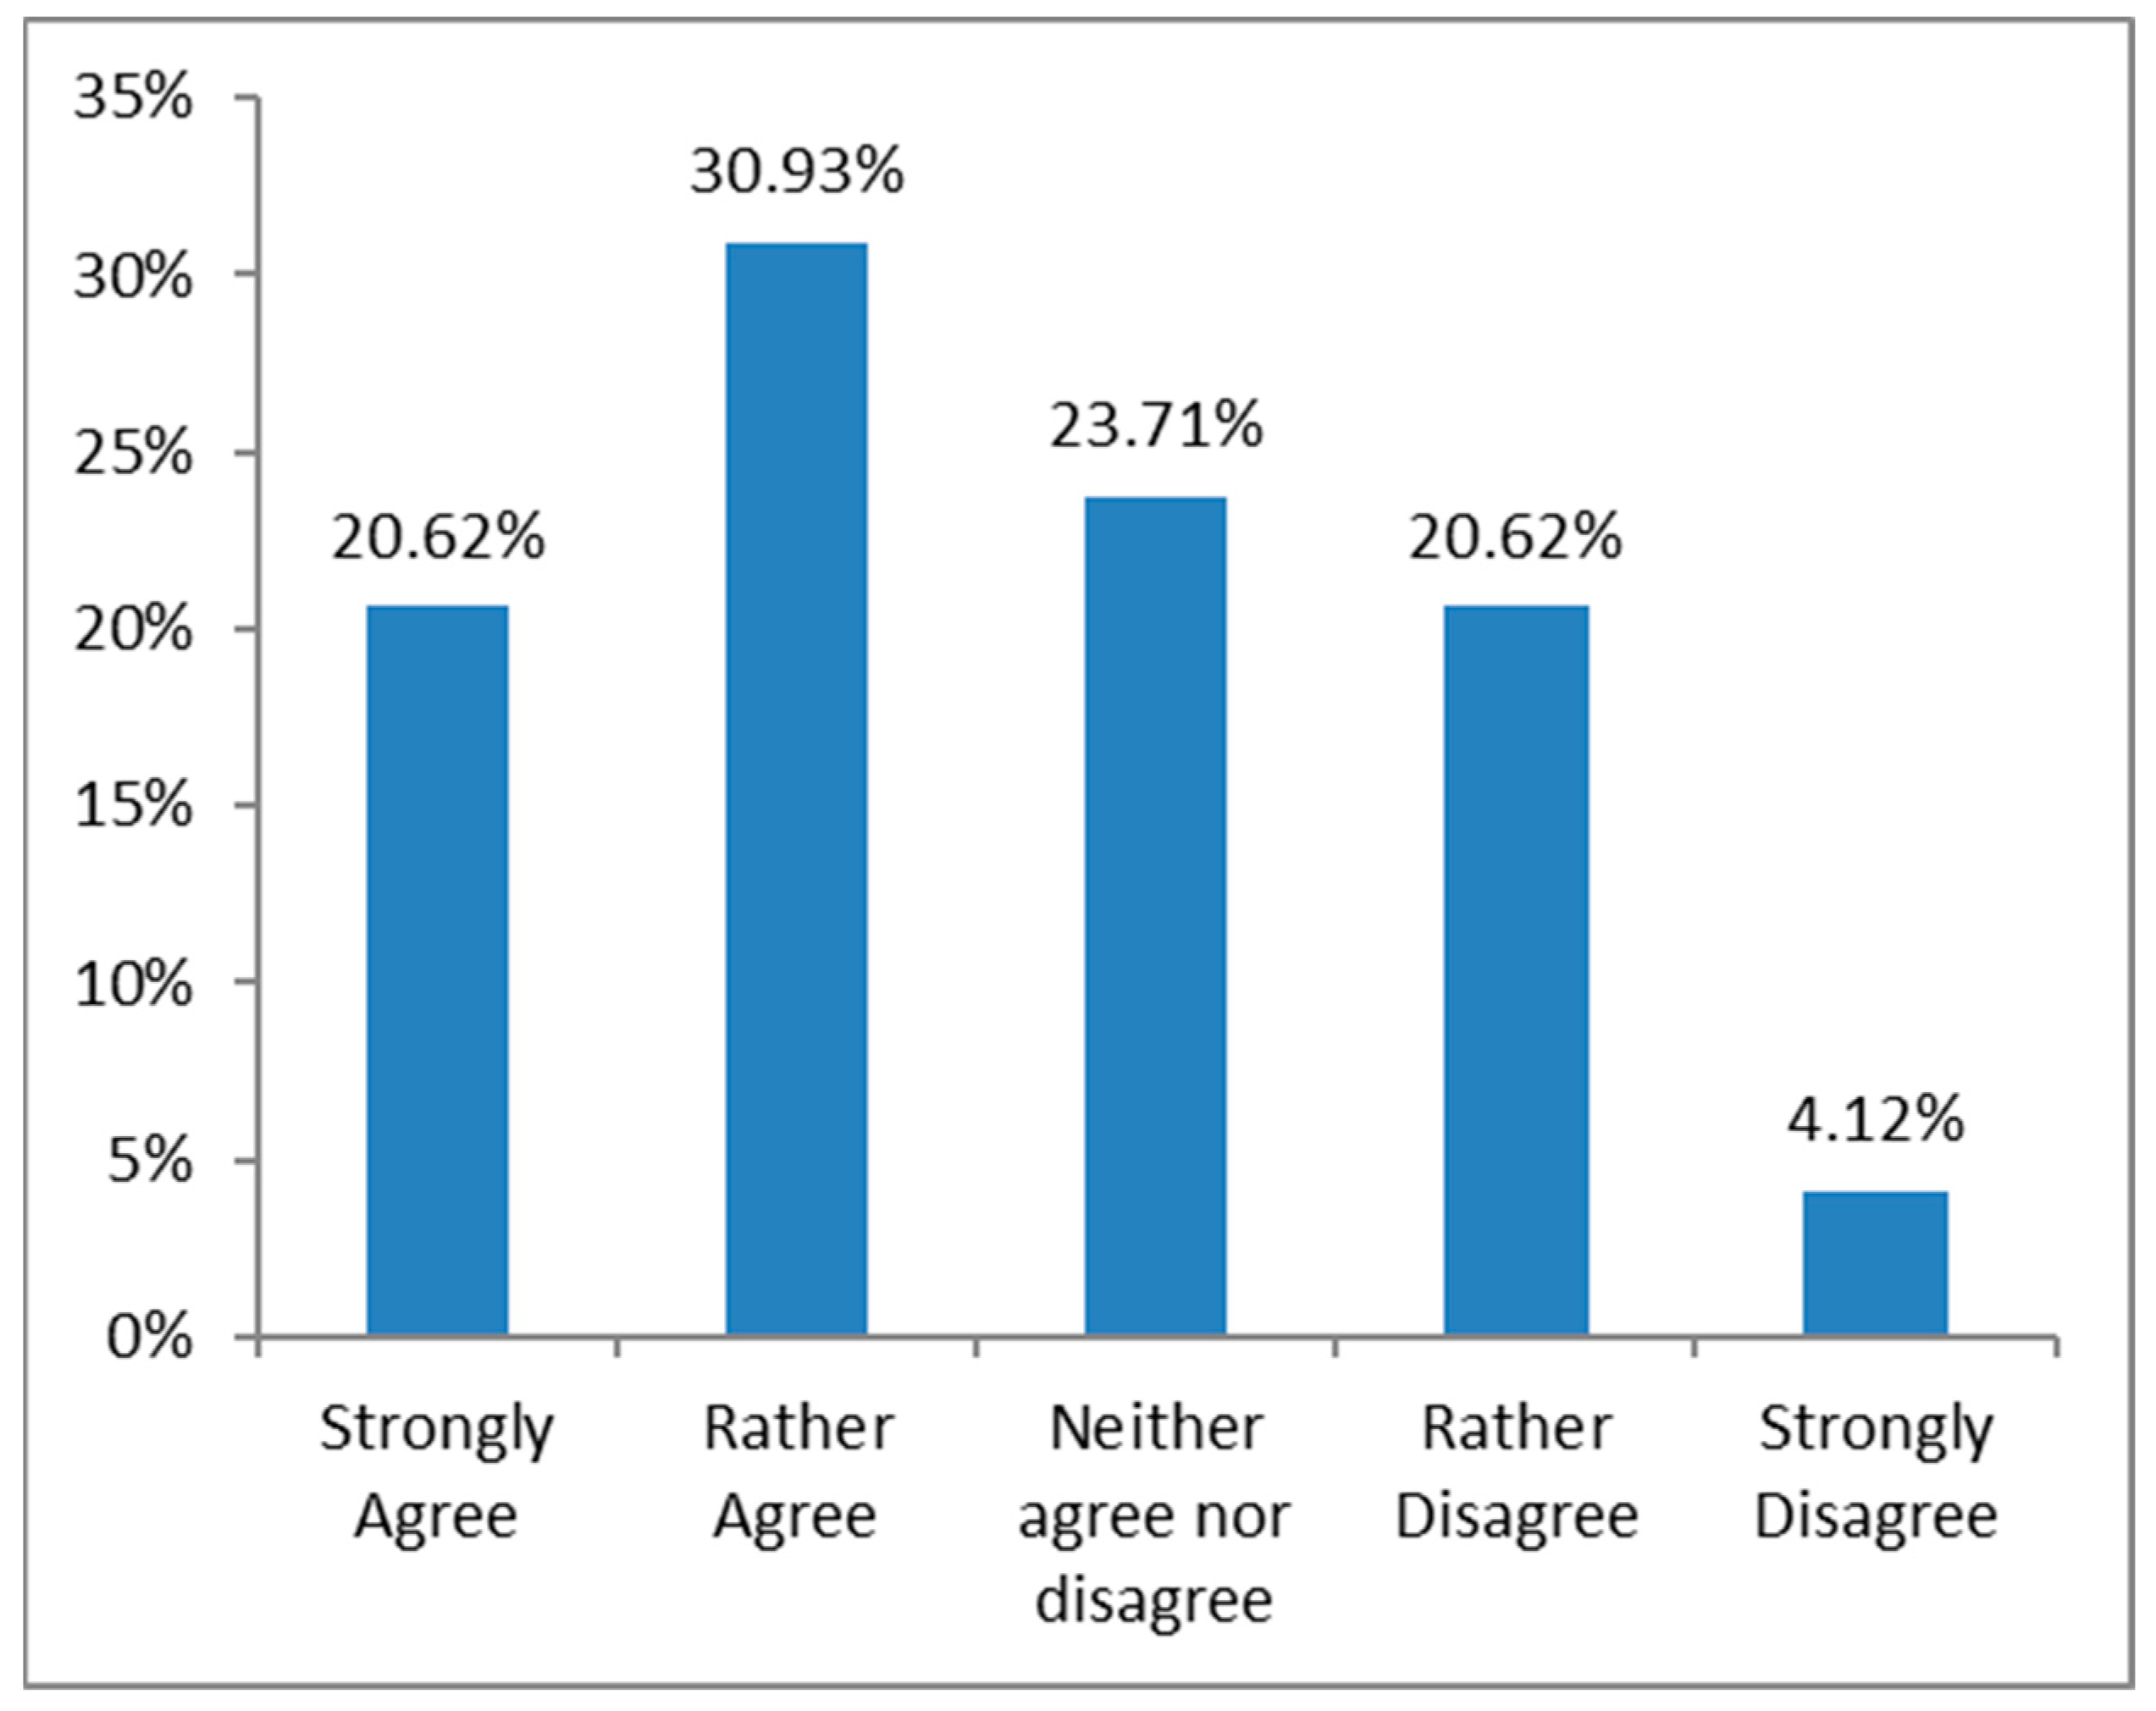
Figure 3.
Q6: State your opinion on whether the final assessment of students using a numerical scale is a valid and reliable process.
Figure 3.
Q6: State your opinion on whether the final assessment of students using a numerical scale is a valid and reliable process.
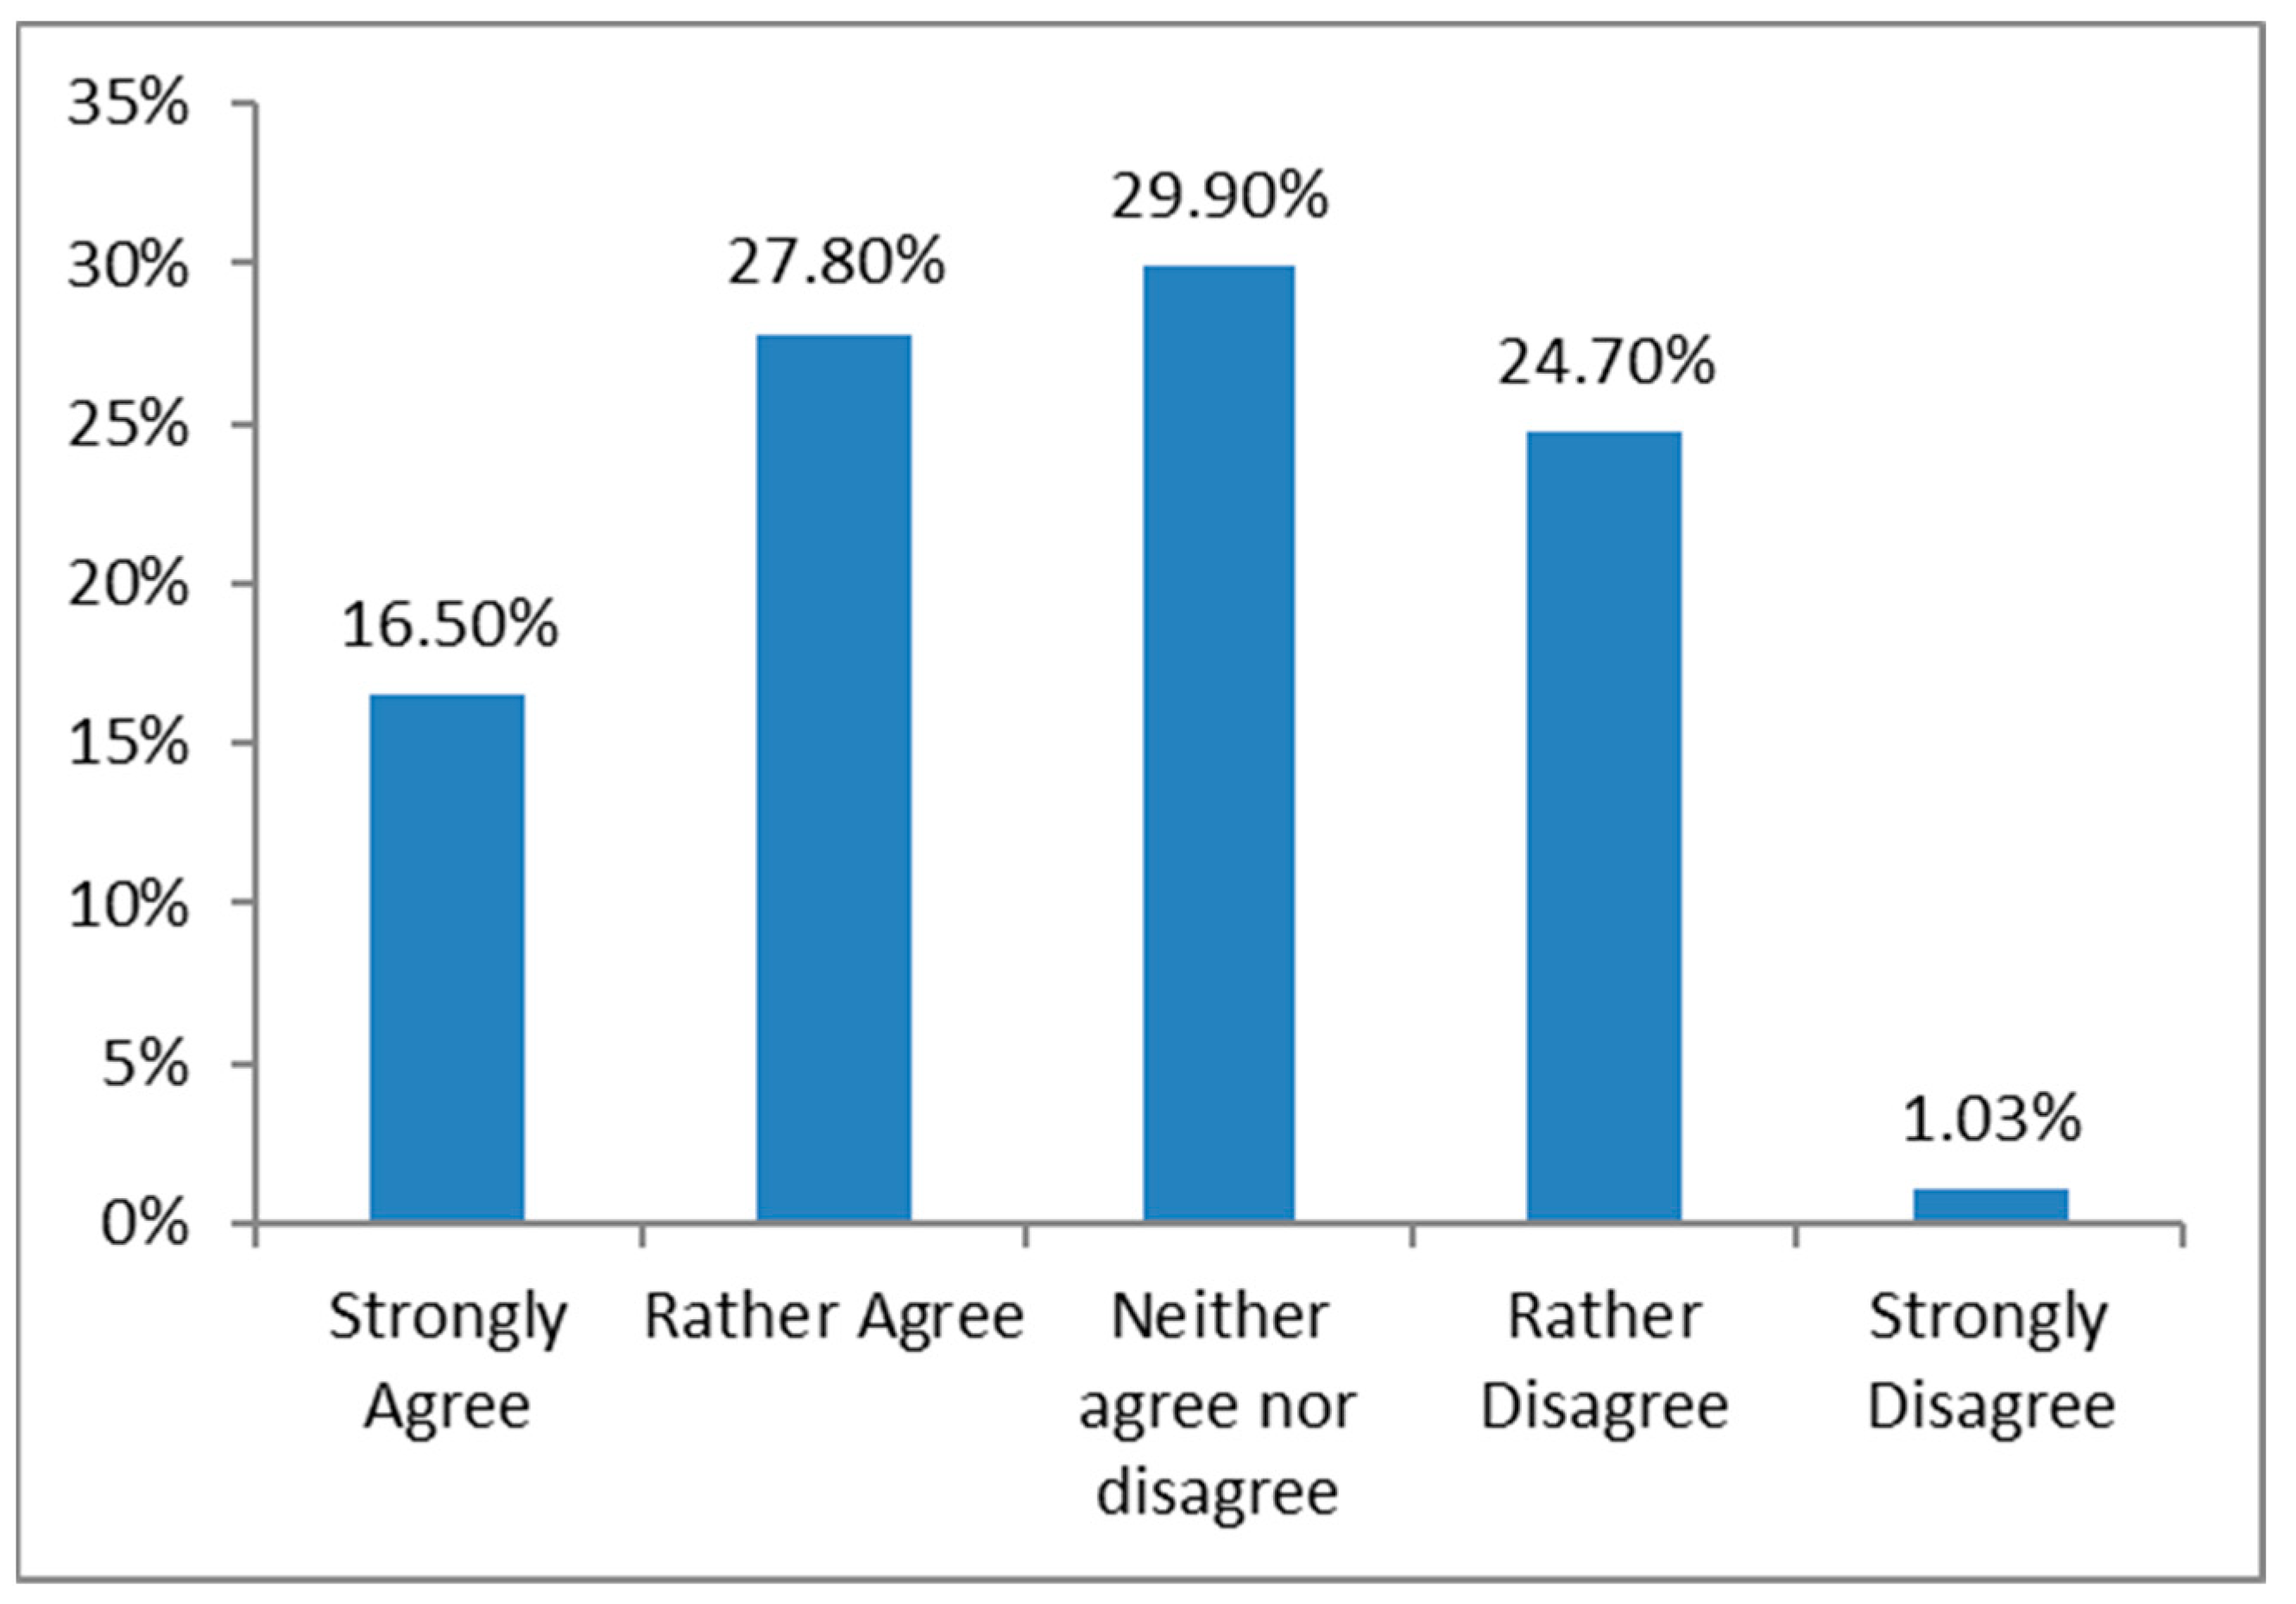
Figure 4.
Q9: State your opinion about how much you know about descriptive assessment procedures.
Figure 4.
Q9: State your opinion about how much you know about descriptive assessment procedures.
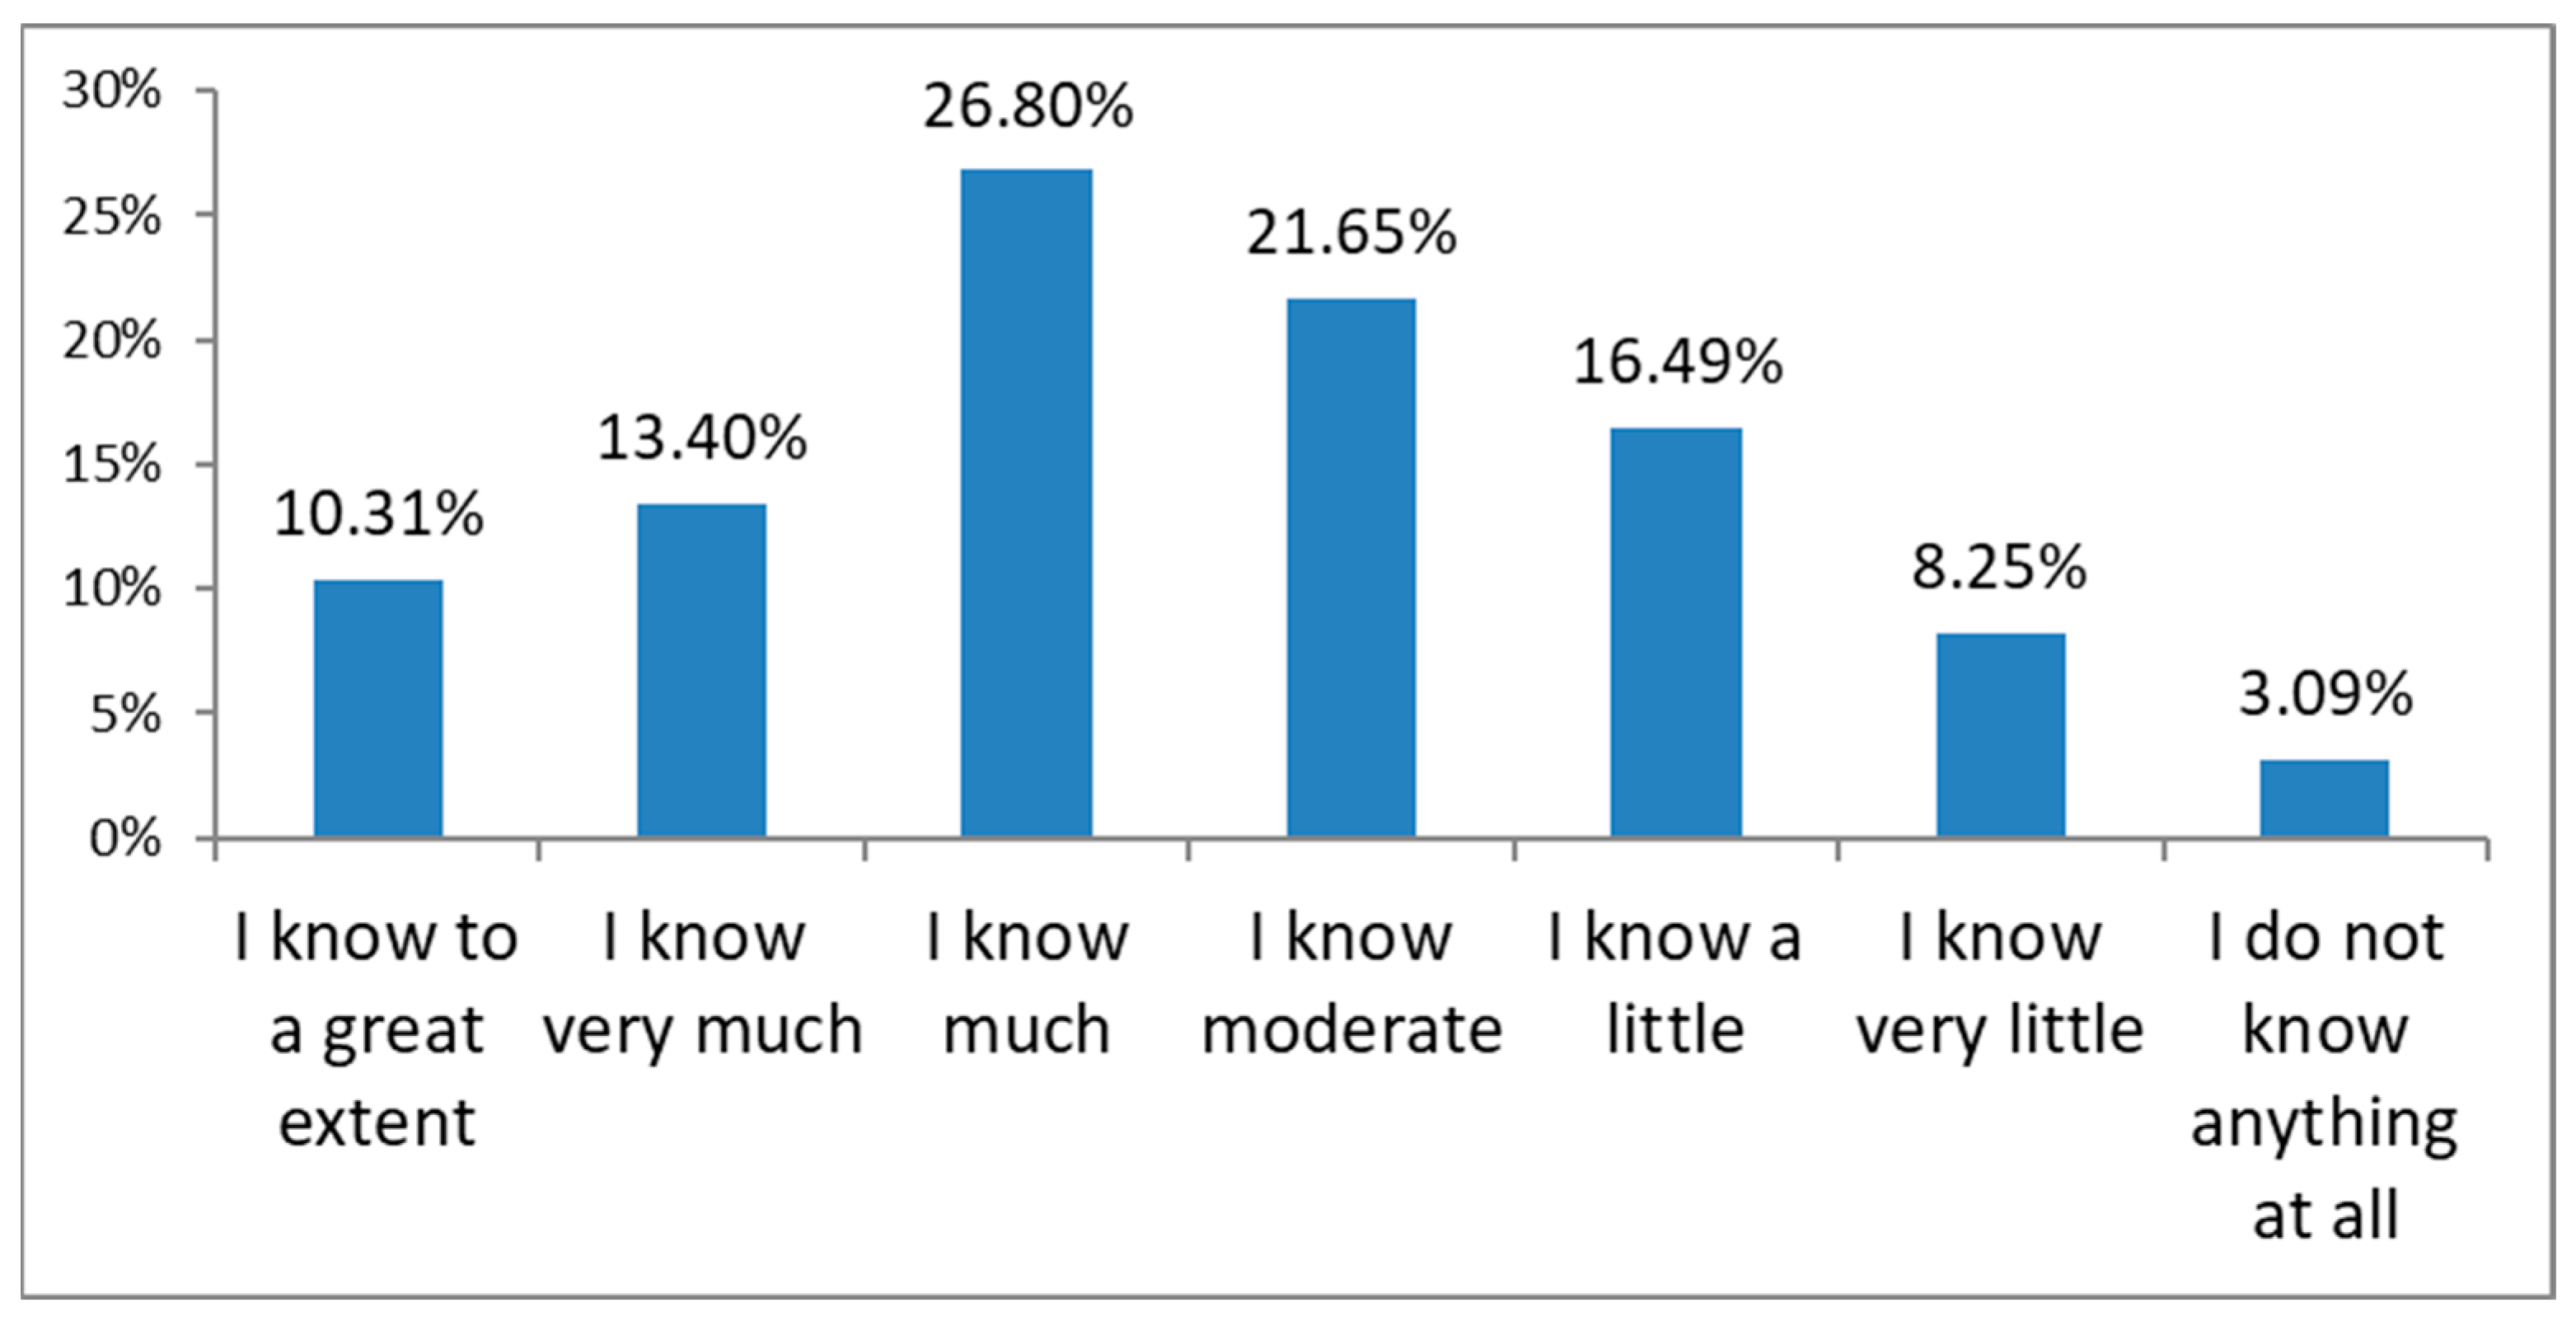
Figure 5.
Q8: State your opinion about the 3 most important dimensions of the educational process contributed by the final assessment in a numerical way (this was a question with multiple choices).
Figure 5.
Q8: State your opinion about the 3 most important dimensions of the educational process contributed by the final assessment in a numerical way (this was a question with multiple choices).
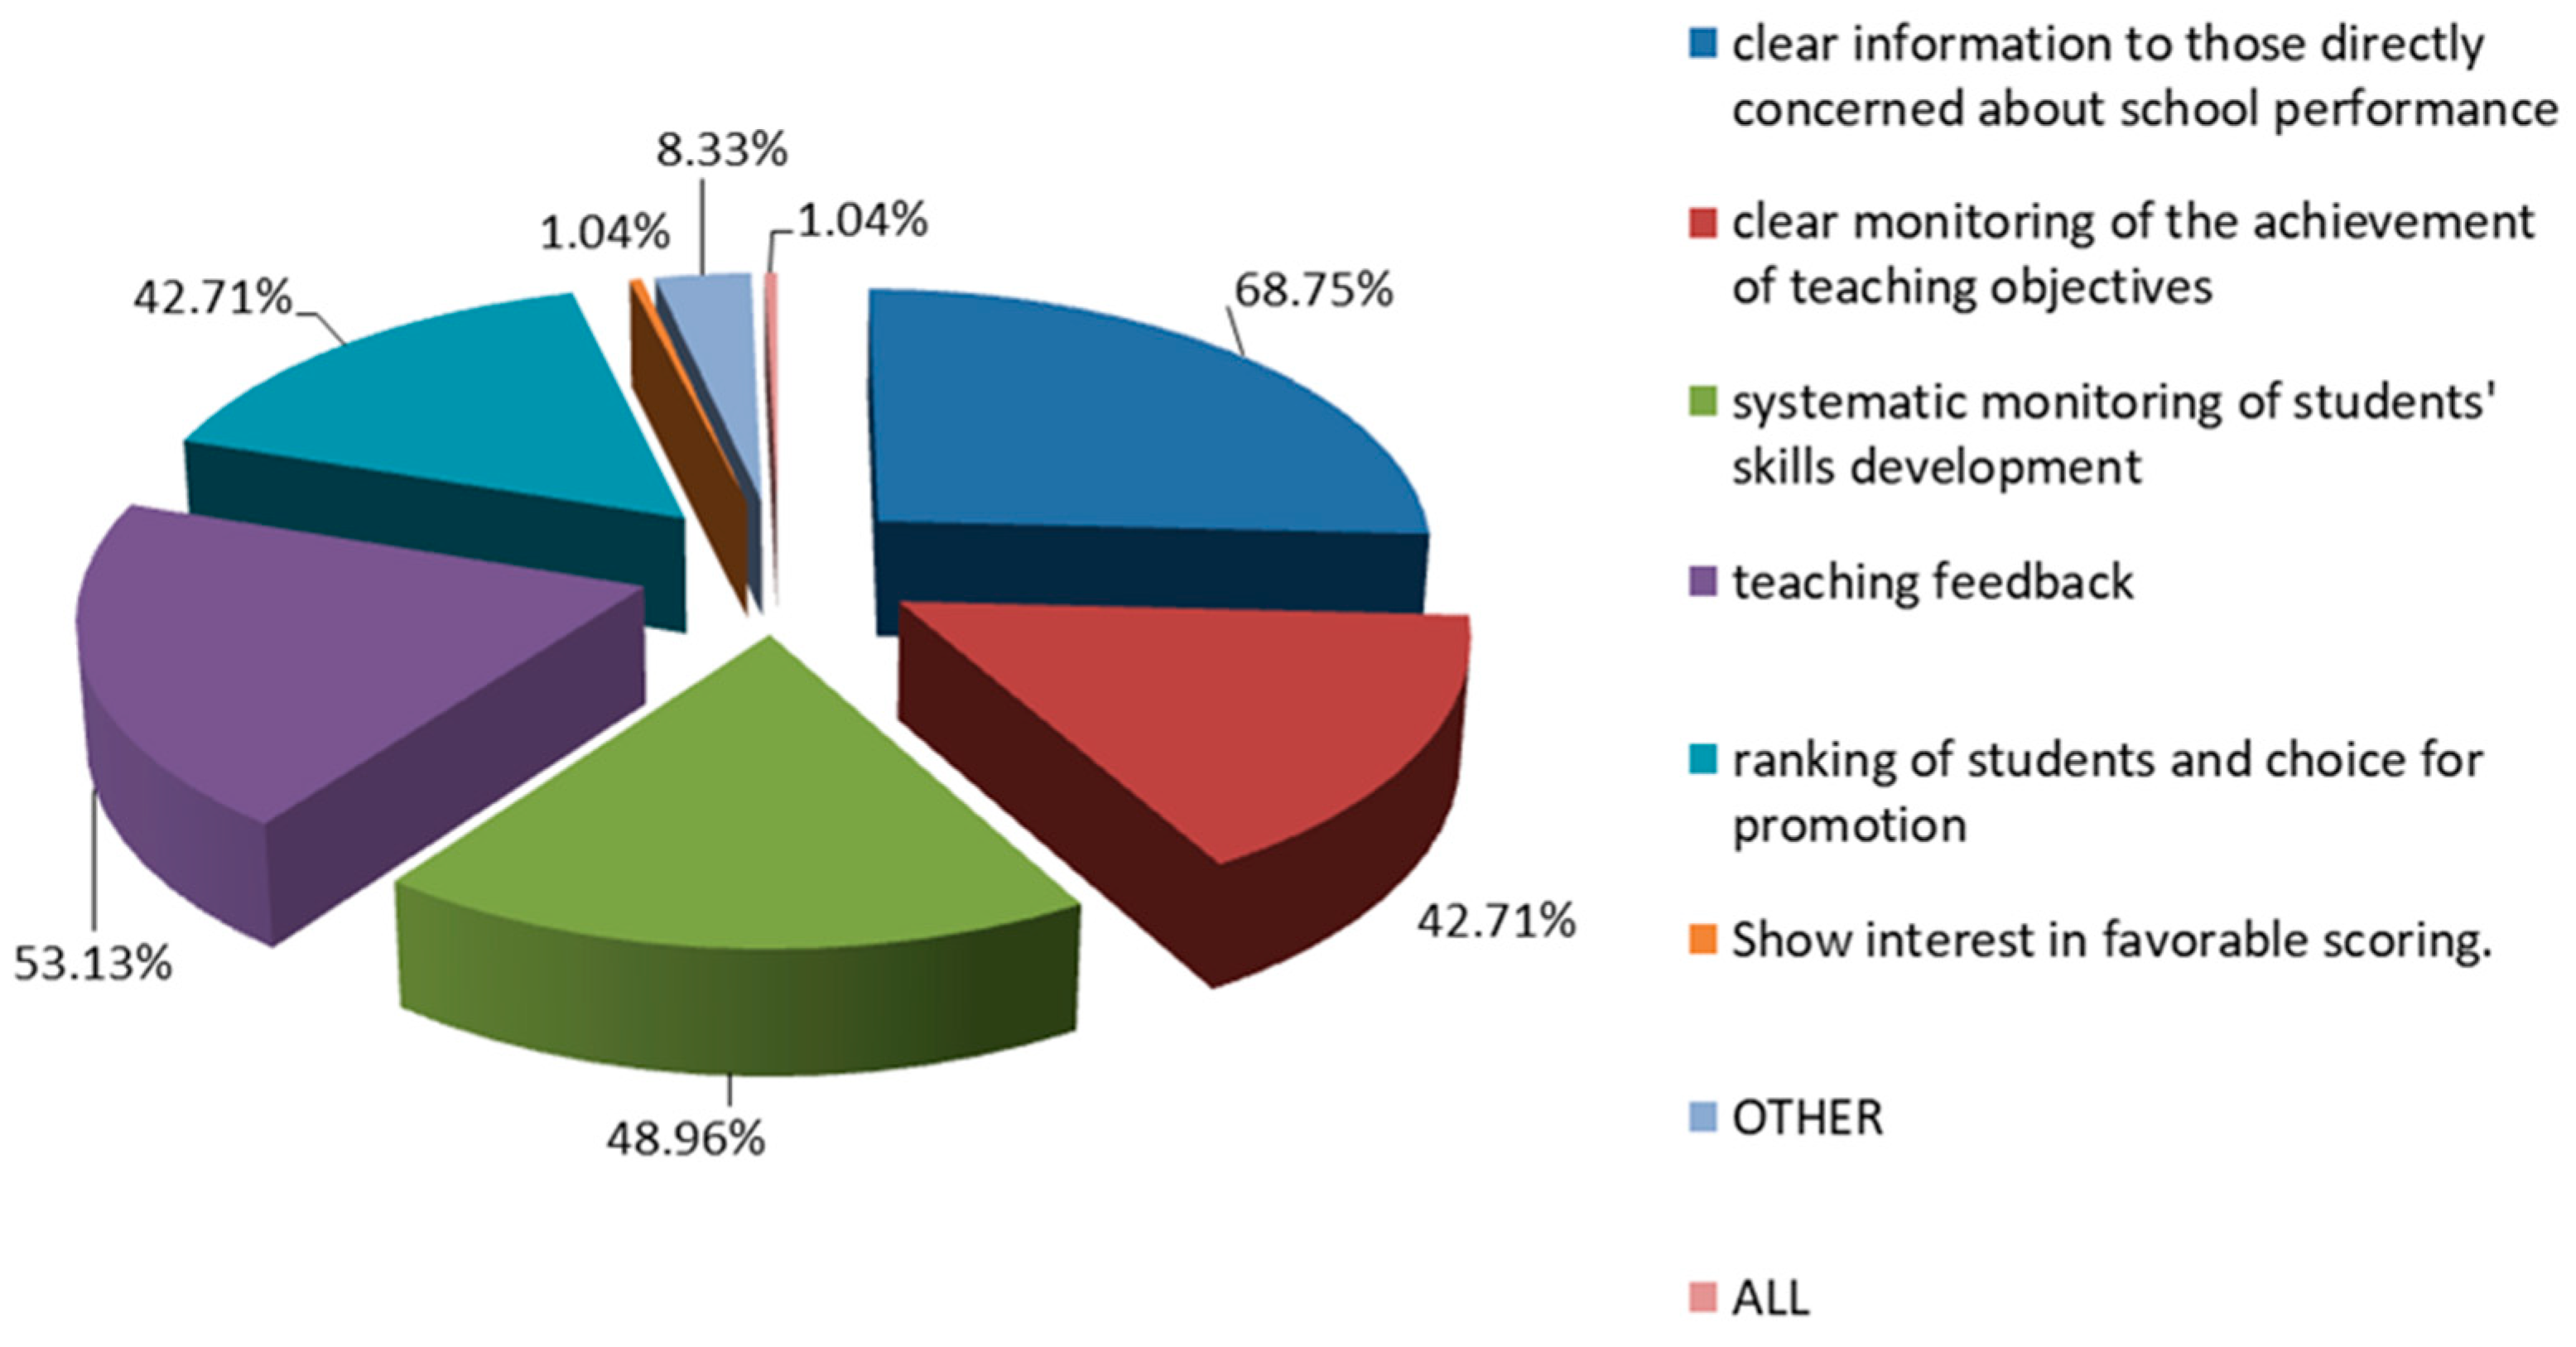
Figure 6.
Q13: State the method you use for the final assessment of the students in the course “Geology-Geography”.
Figure 6.
Q13: State the method you use for the final assessment of the students in the course “Geology-Geography”.
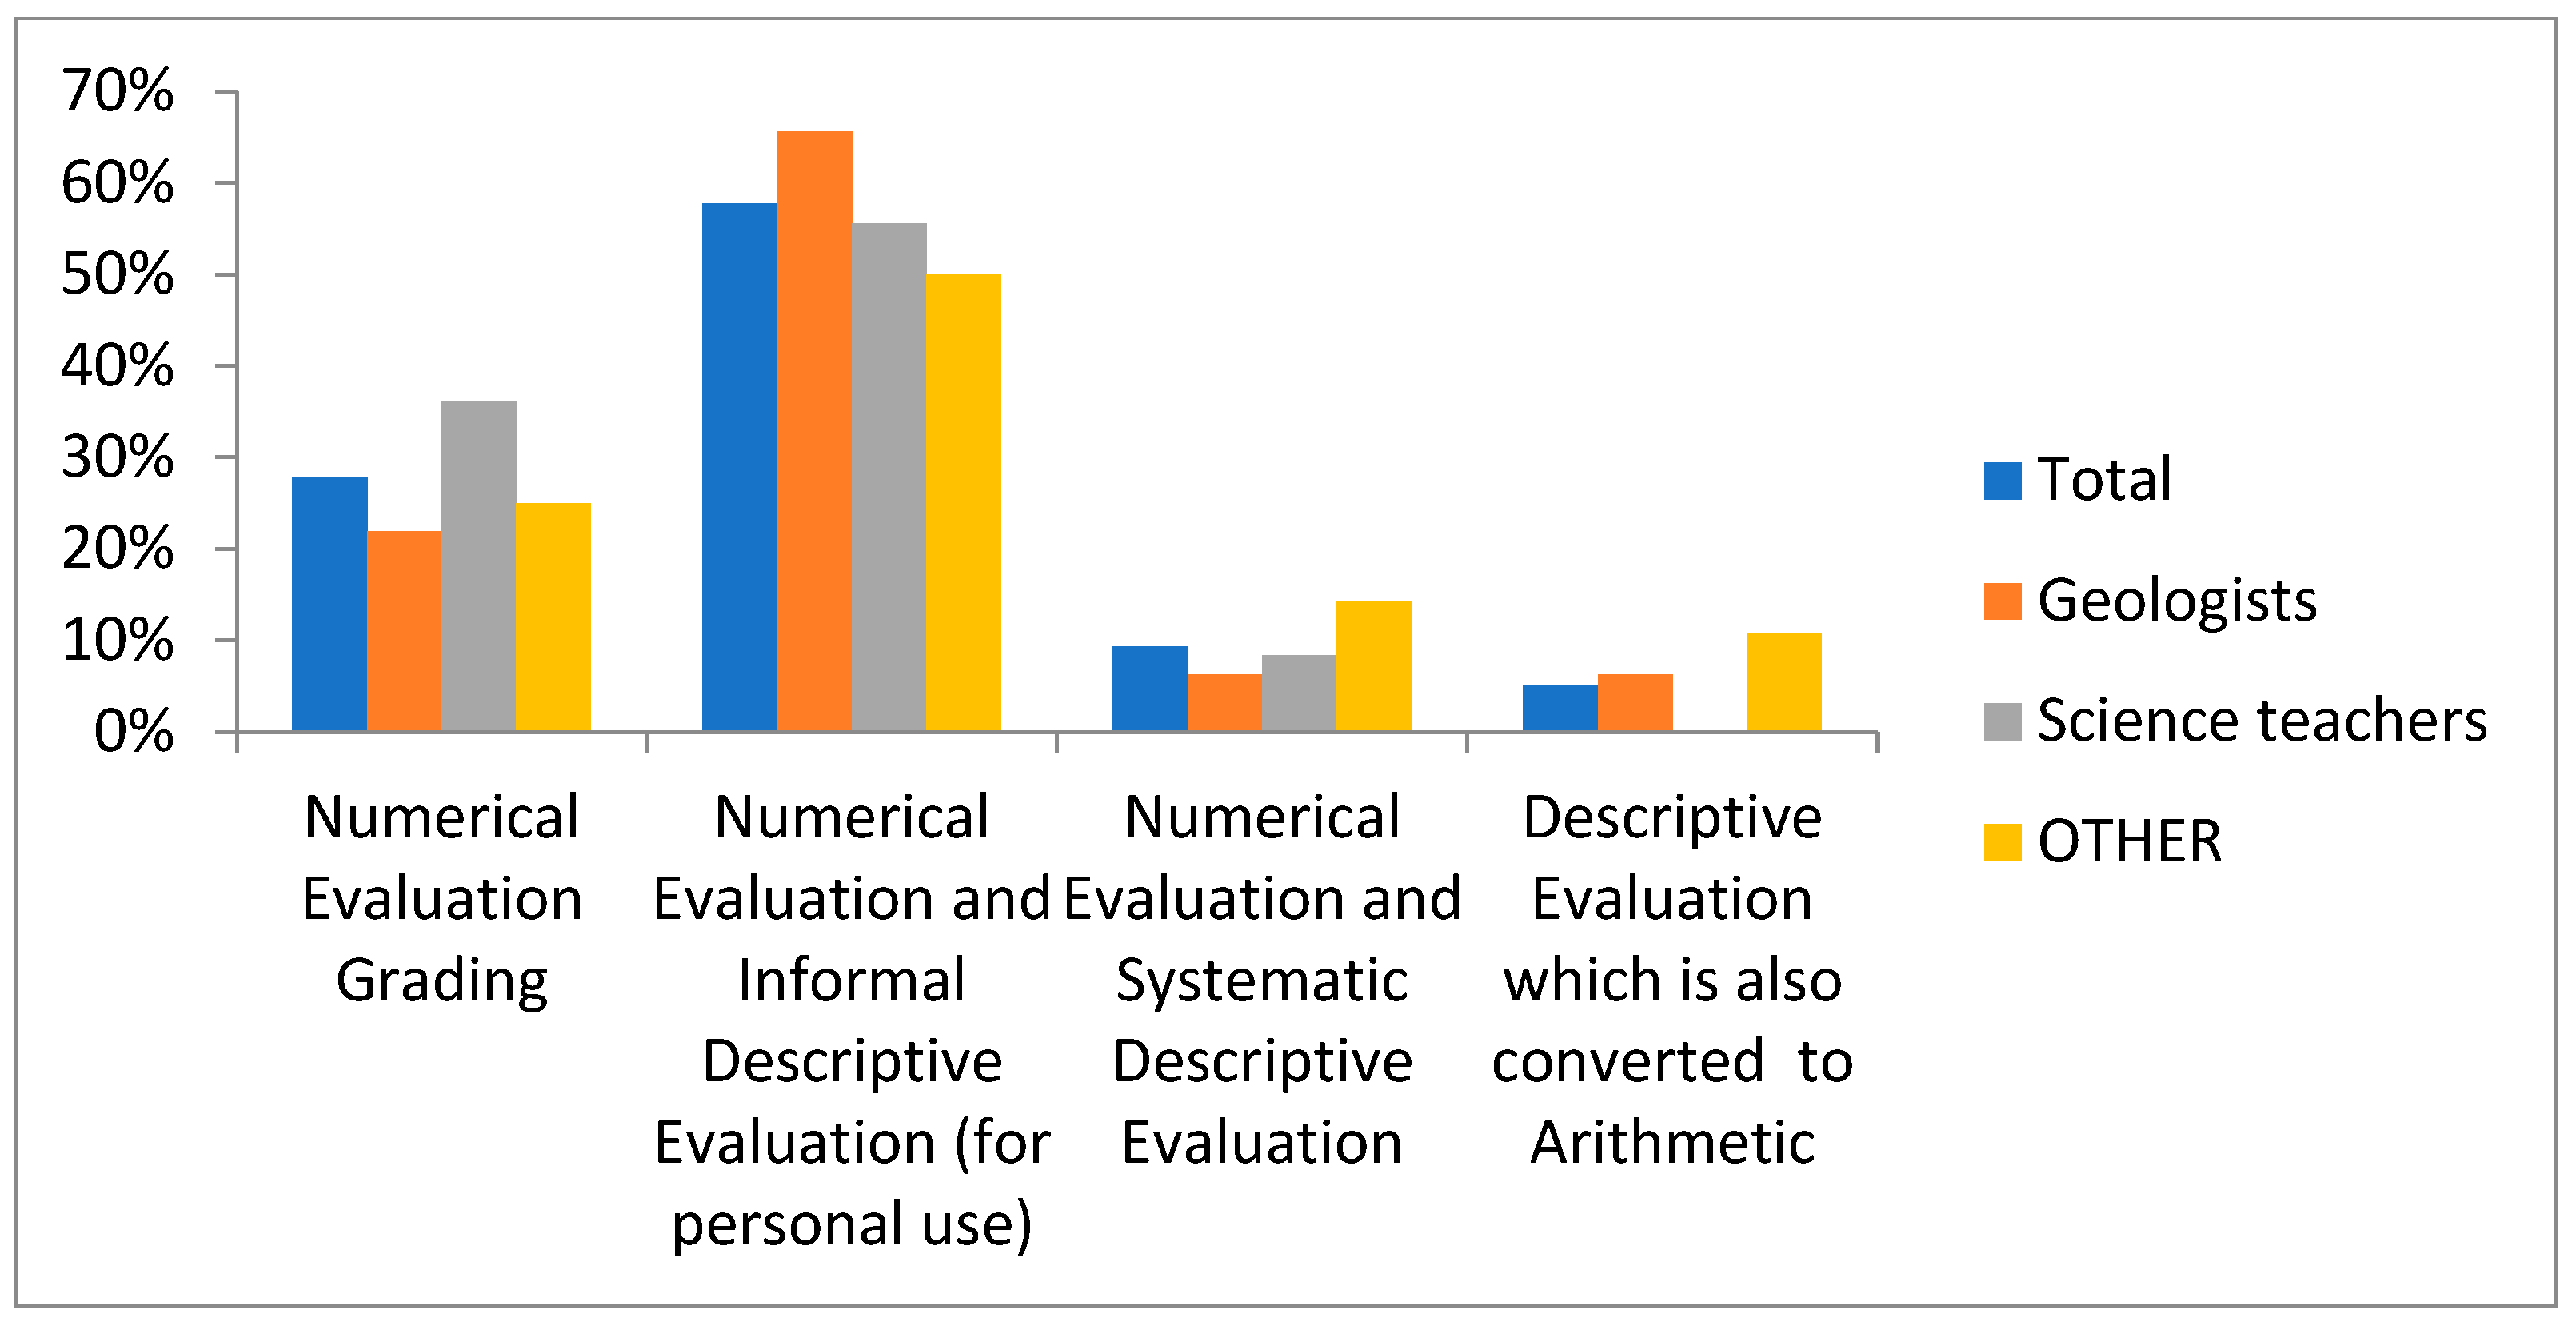
Figure 7.
Q14: State the tools you use for the evaluation of the oral performance of the students in the course “Geology-Geography”.
Figure 7.
Q14: State the tools you use for the evaluation of the oral performance of the students in the course “Geology-Geography”.
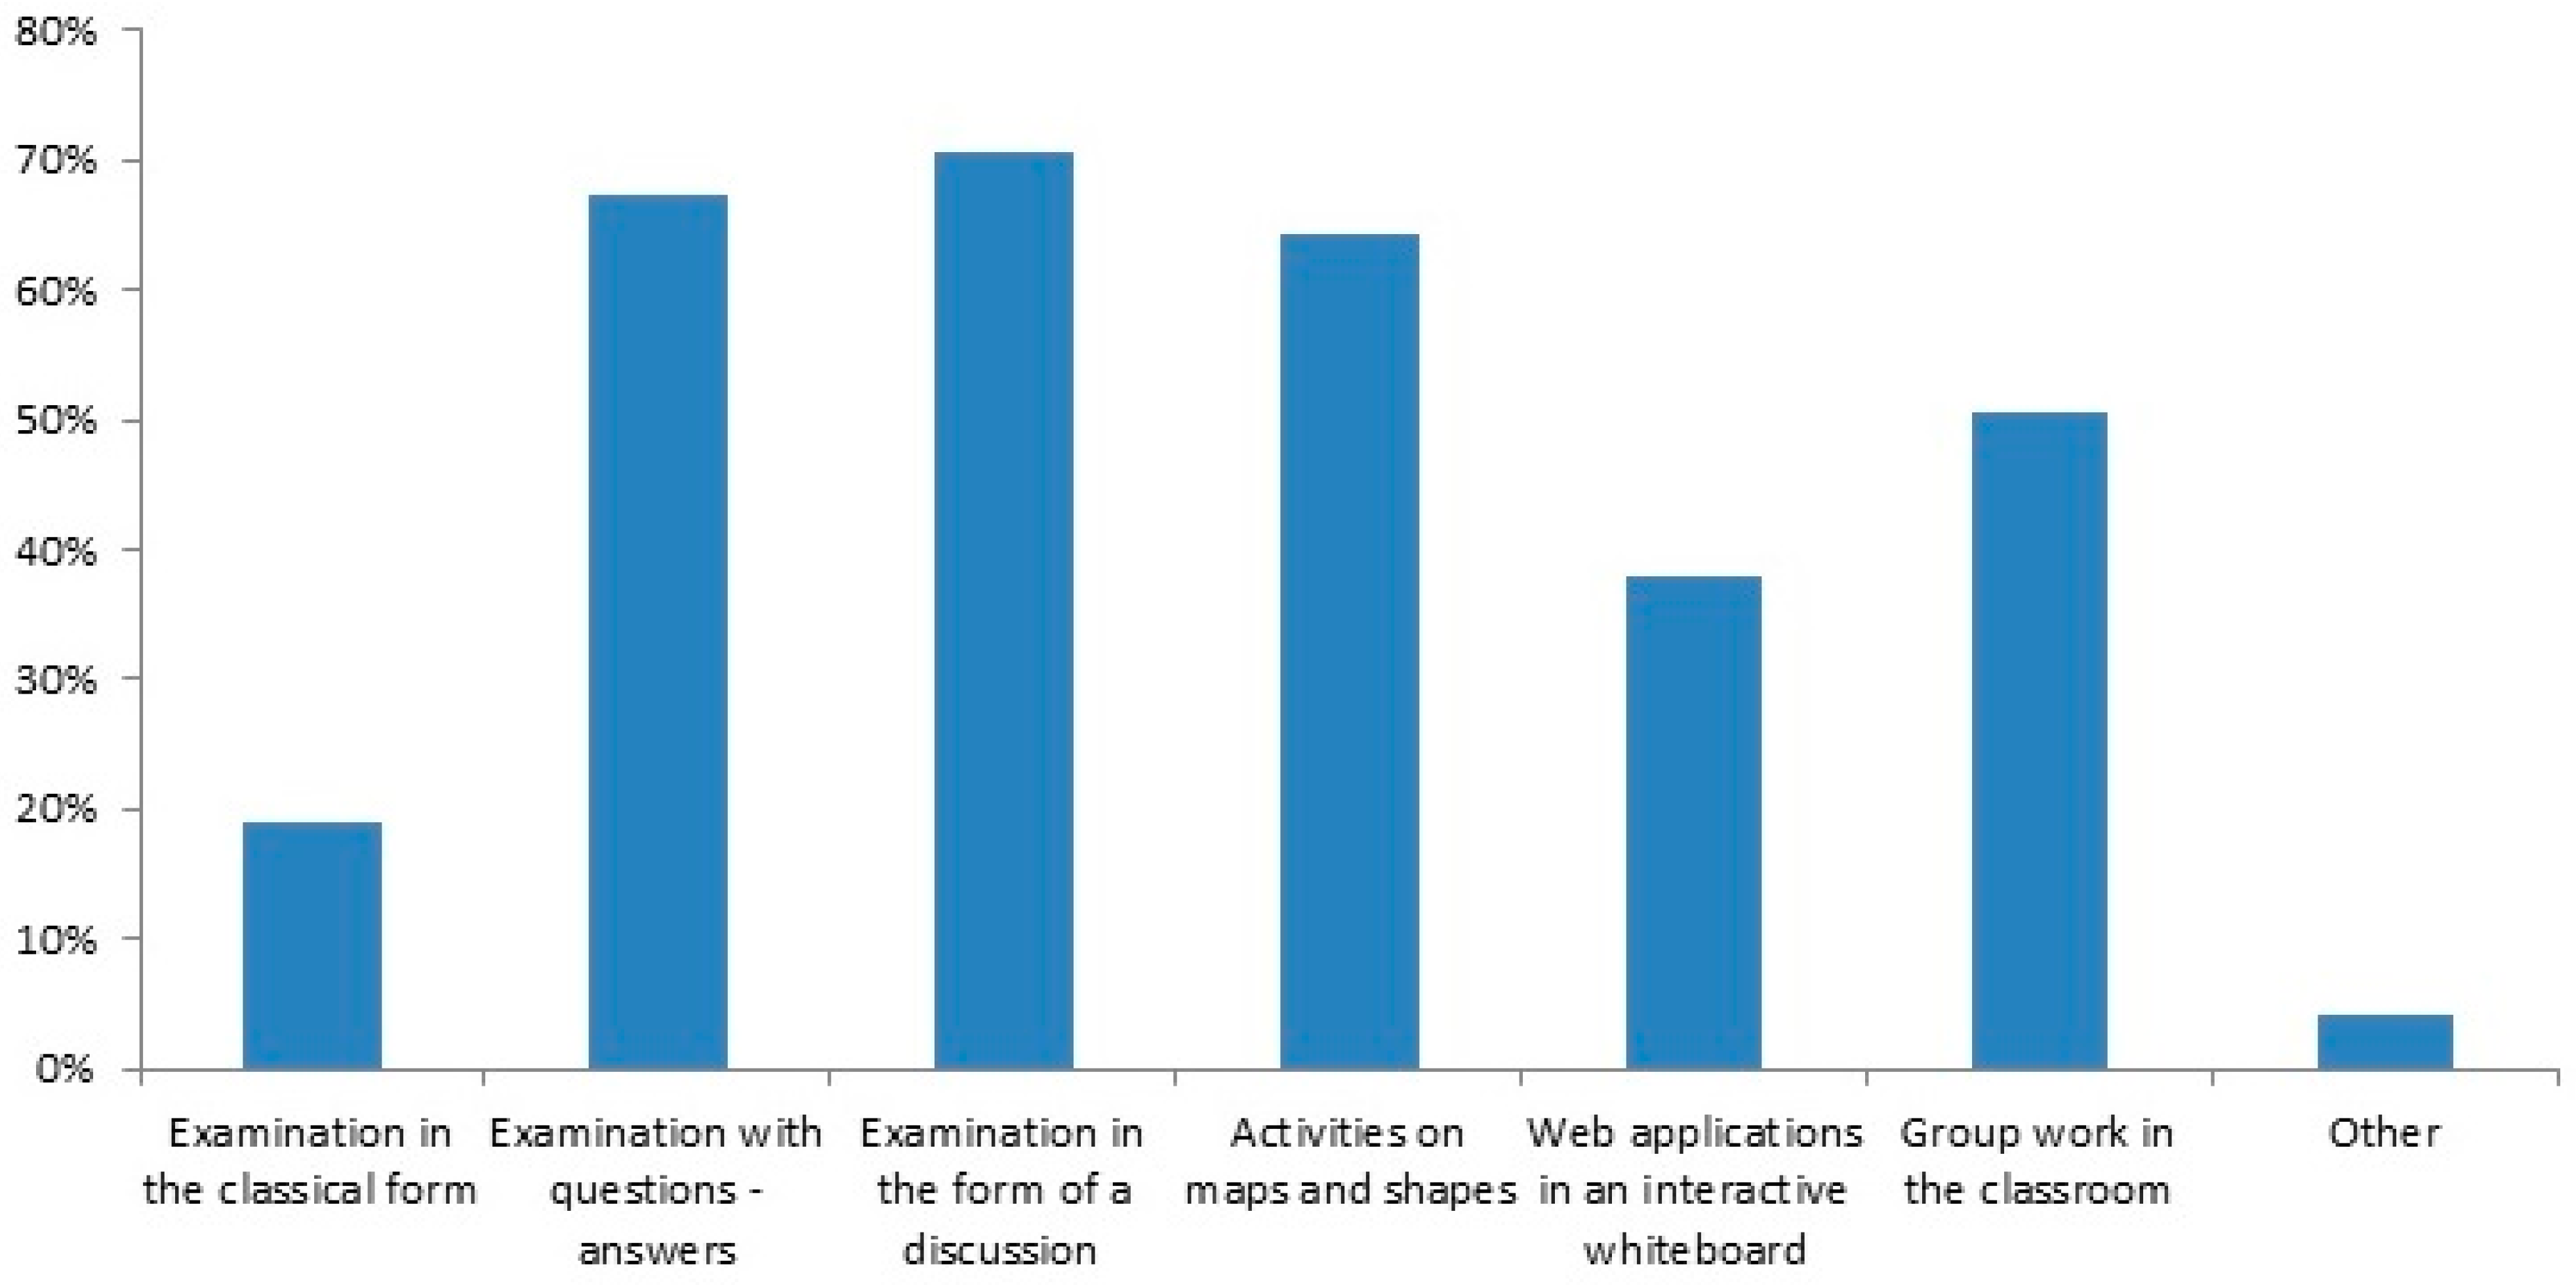
Figure 8.
Q18: State where you received your training in student assessment (PEK is the initial training teachers receive when they start working at schools; IEP is the Institution of Educational Policy) (this was a question with multiple choices).
Figure 8.
Q18: State where you received your training in student assessment (PEK is the initial training teachers receive when they start working at schools; IEP is the Institution of Educational Policy) (this was a question with multiple choices).

Figure 9.
Q19: Note the 3 most important of the following factors that you consider would prevent the application of descriptive assessment in class.
Figure 9.
Q19: Note the 3 most important of the following factors that you consider would prevent the application of descriptive assessment in class.
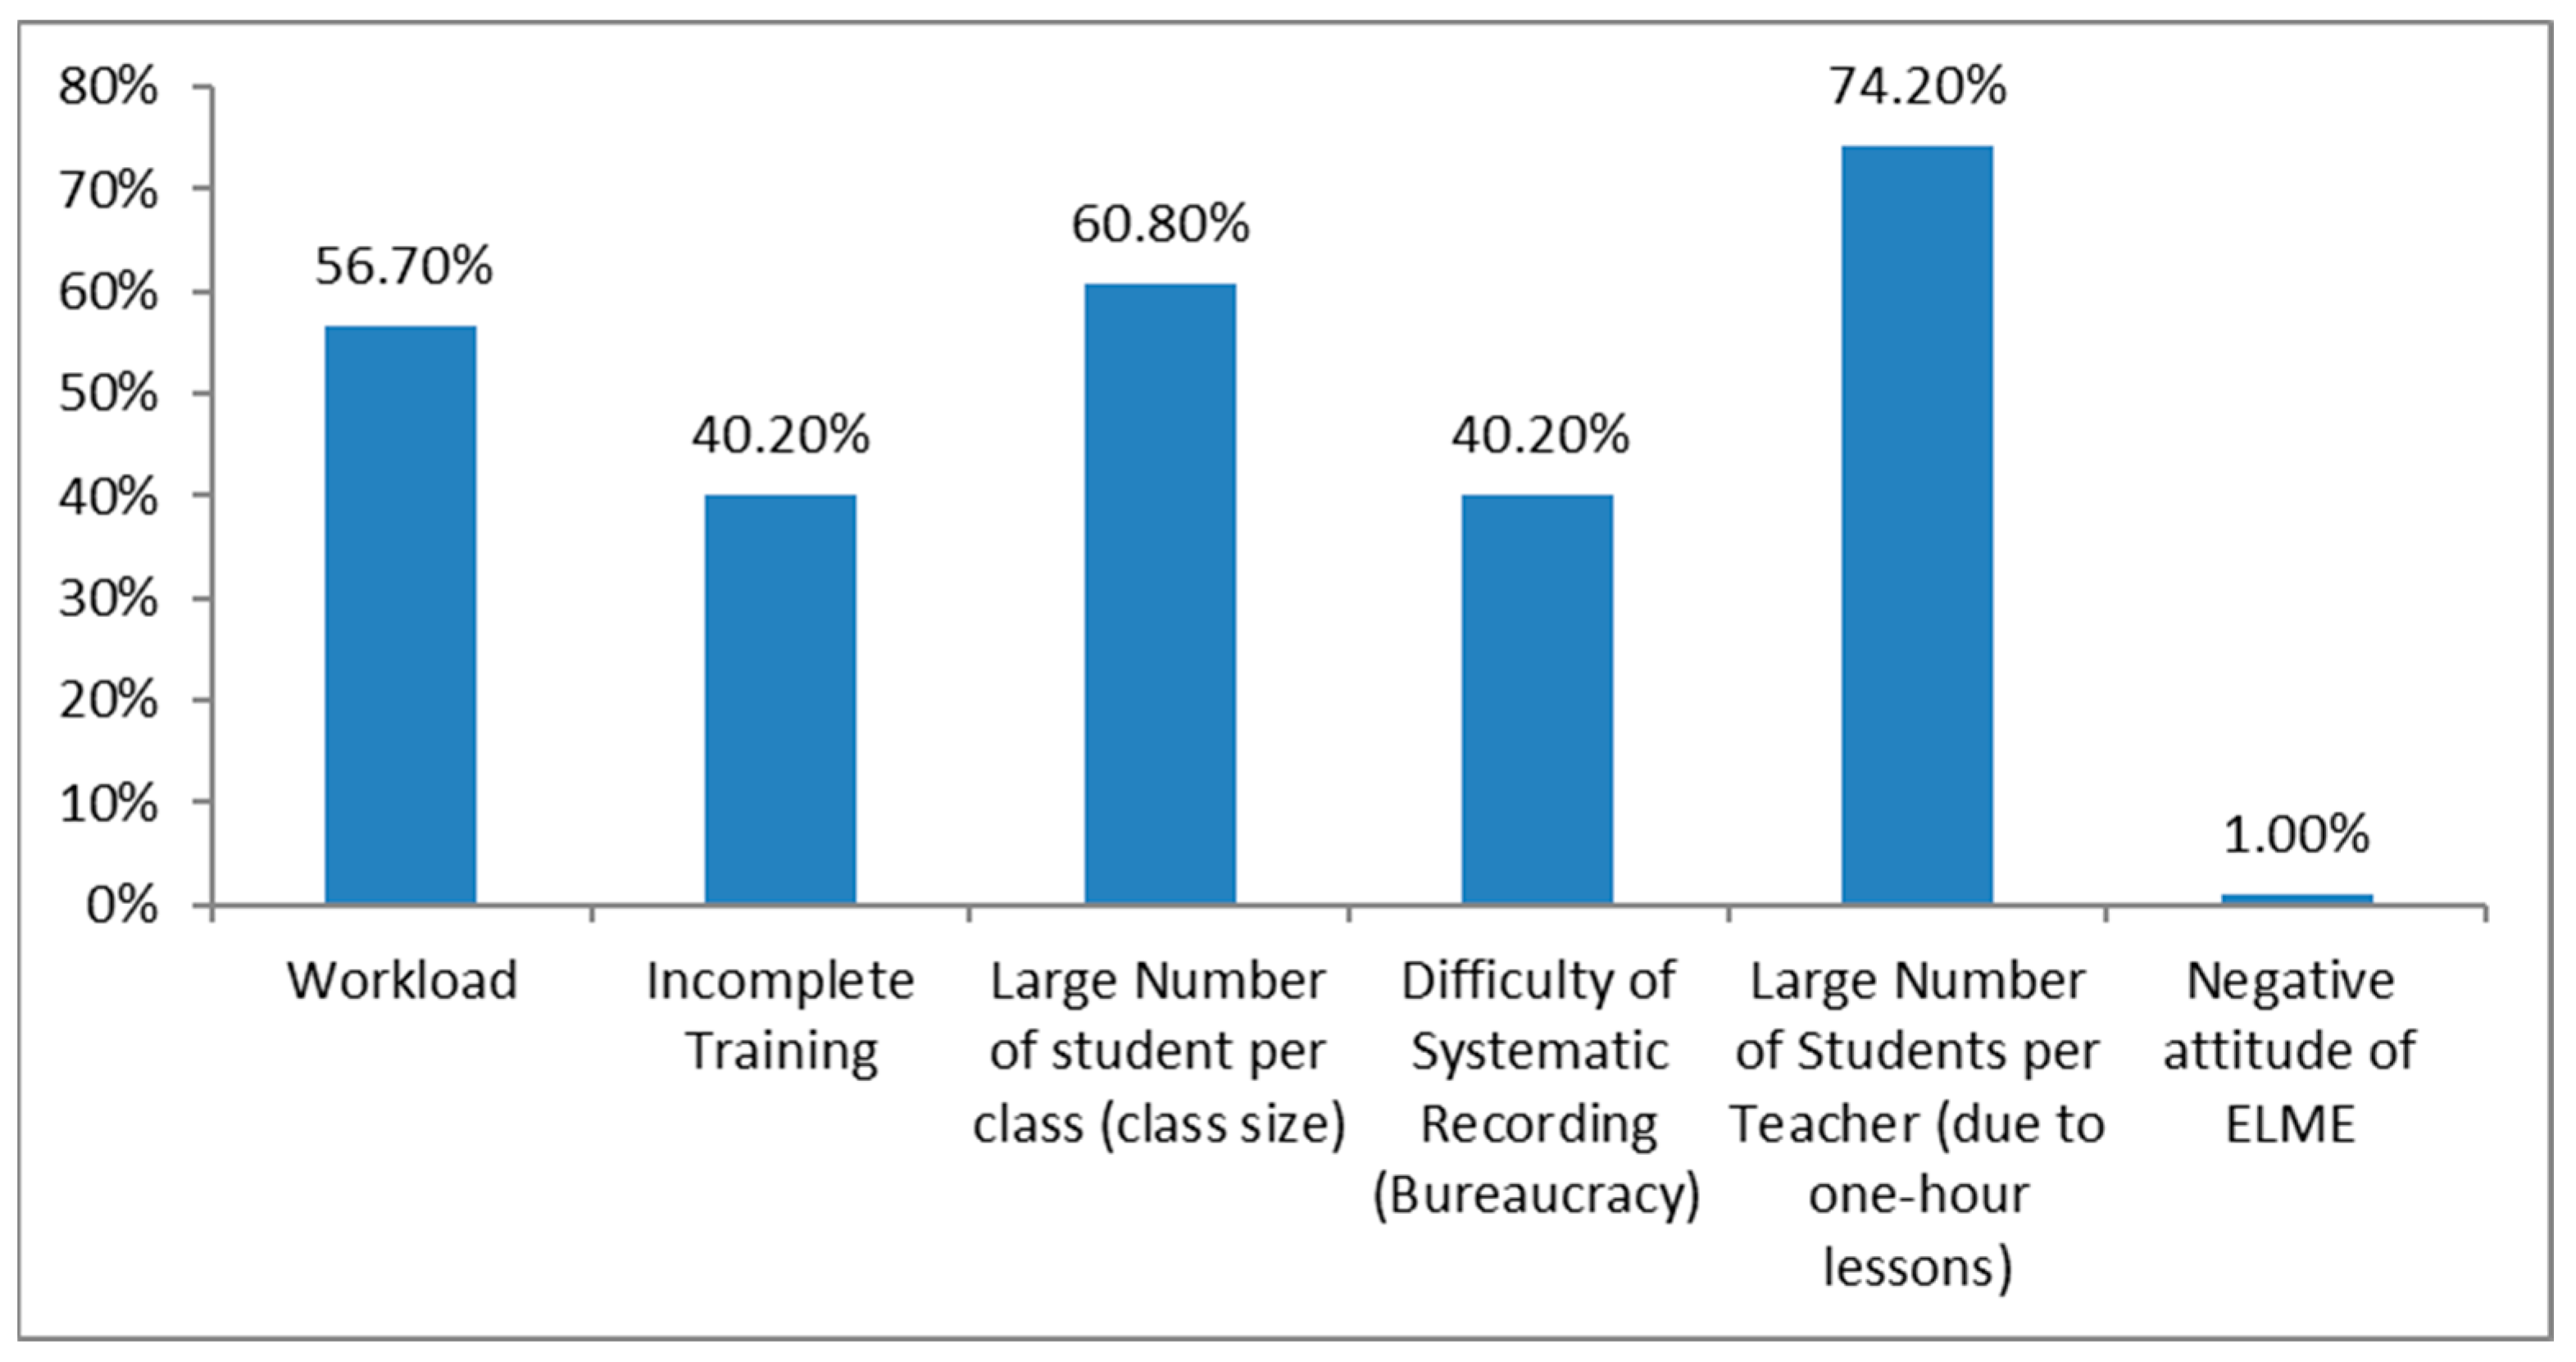
Figure 10.
Q20: Note the 3 most important of the following factors that you consider would assist the application of descriptive assessment in class (this was a question with multiple choices).
Figure 10.
Q20: Note the 3 most important of the following factors that you consider would assist the application of descriptive assessment in class (this was a question with multiple choices).
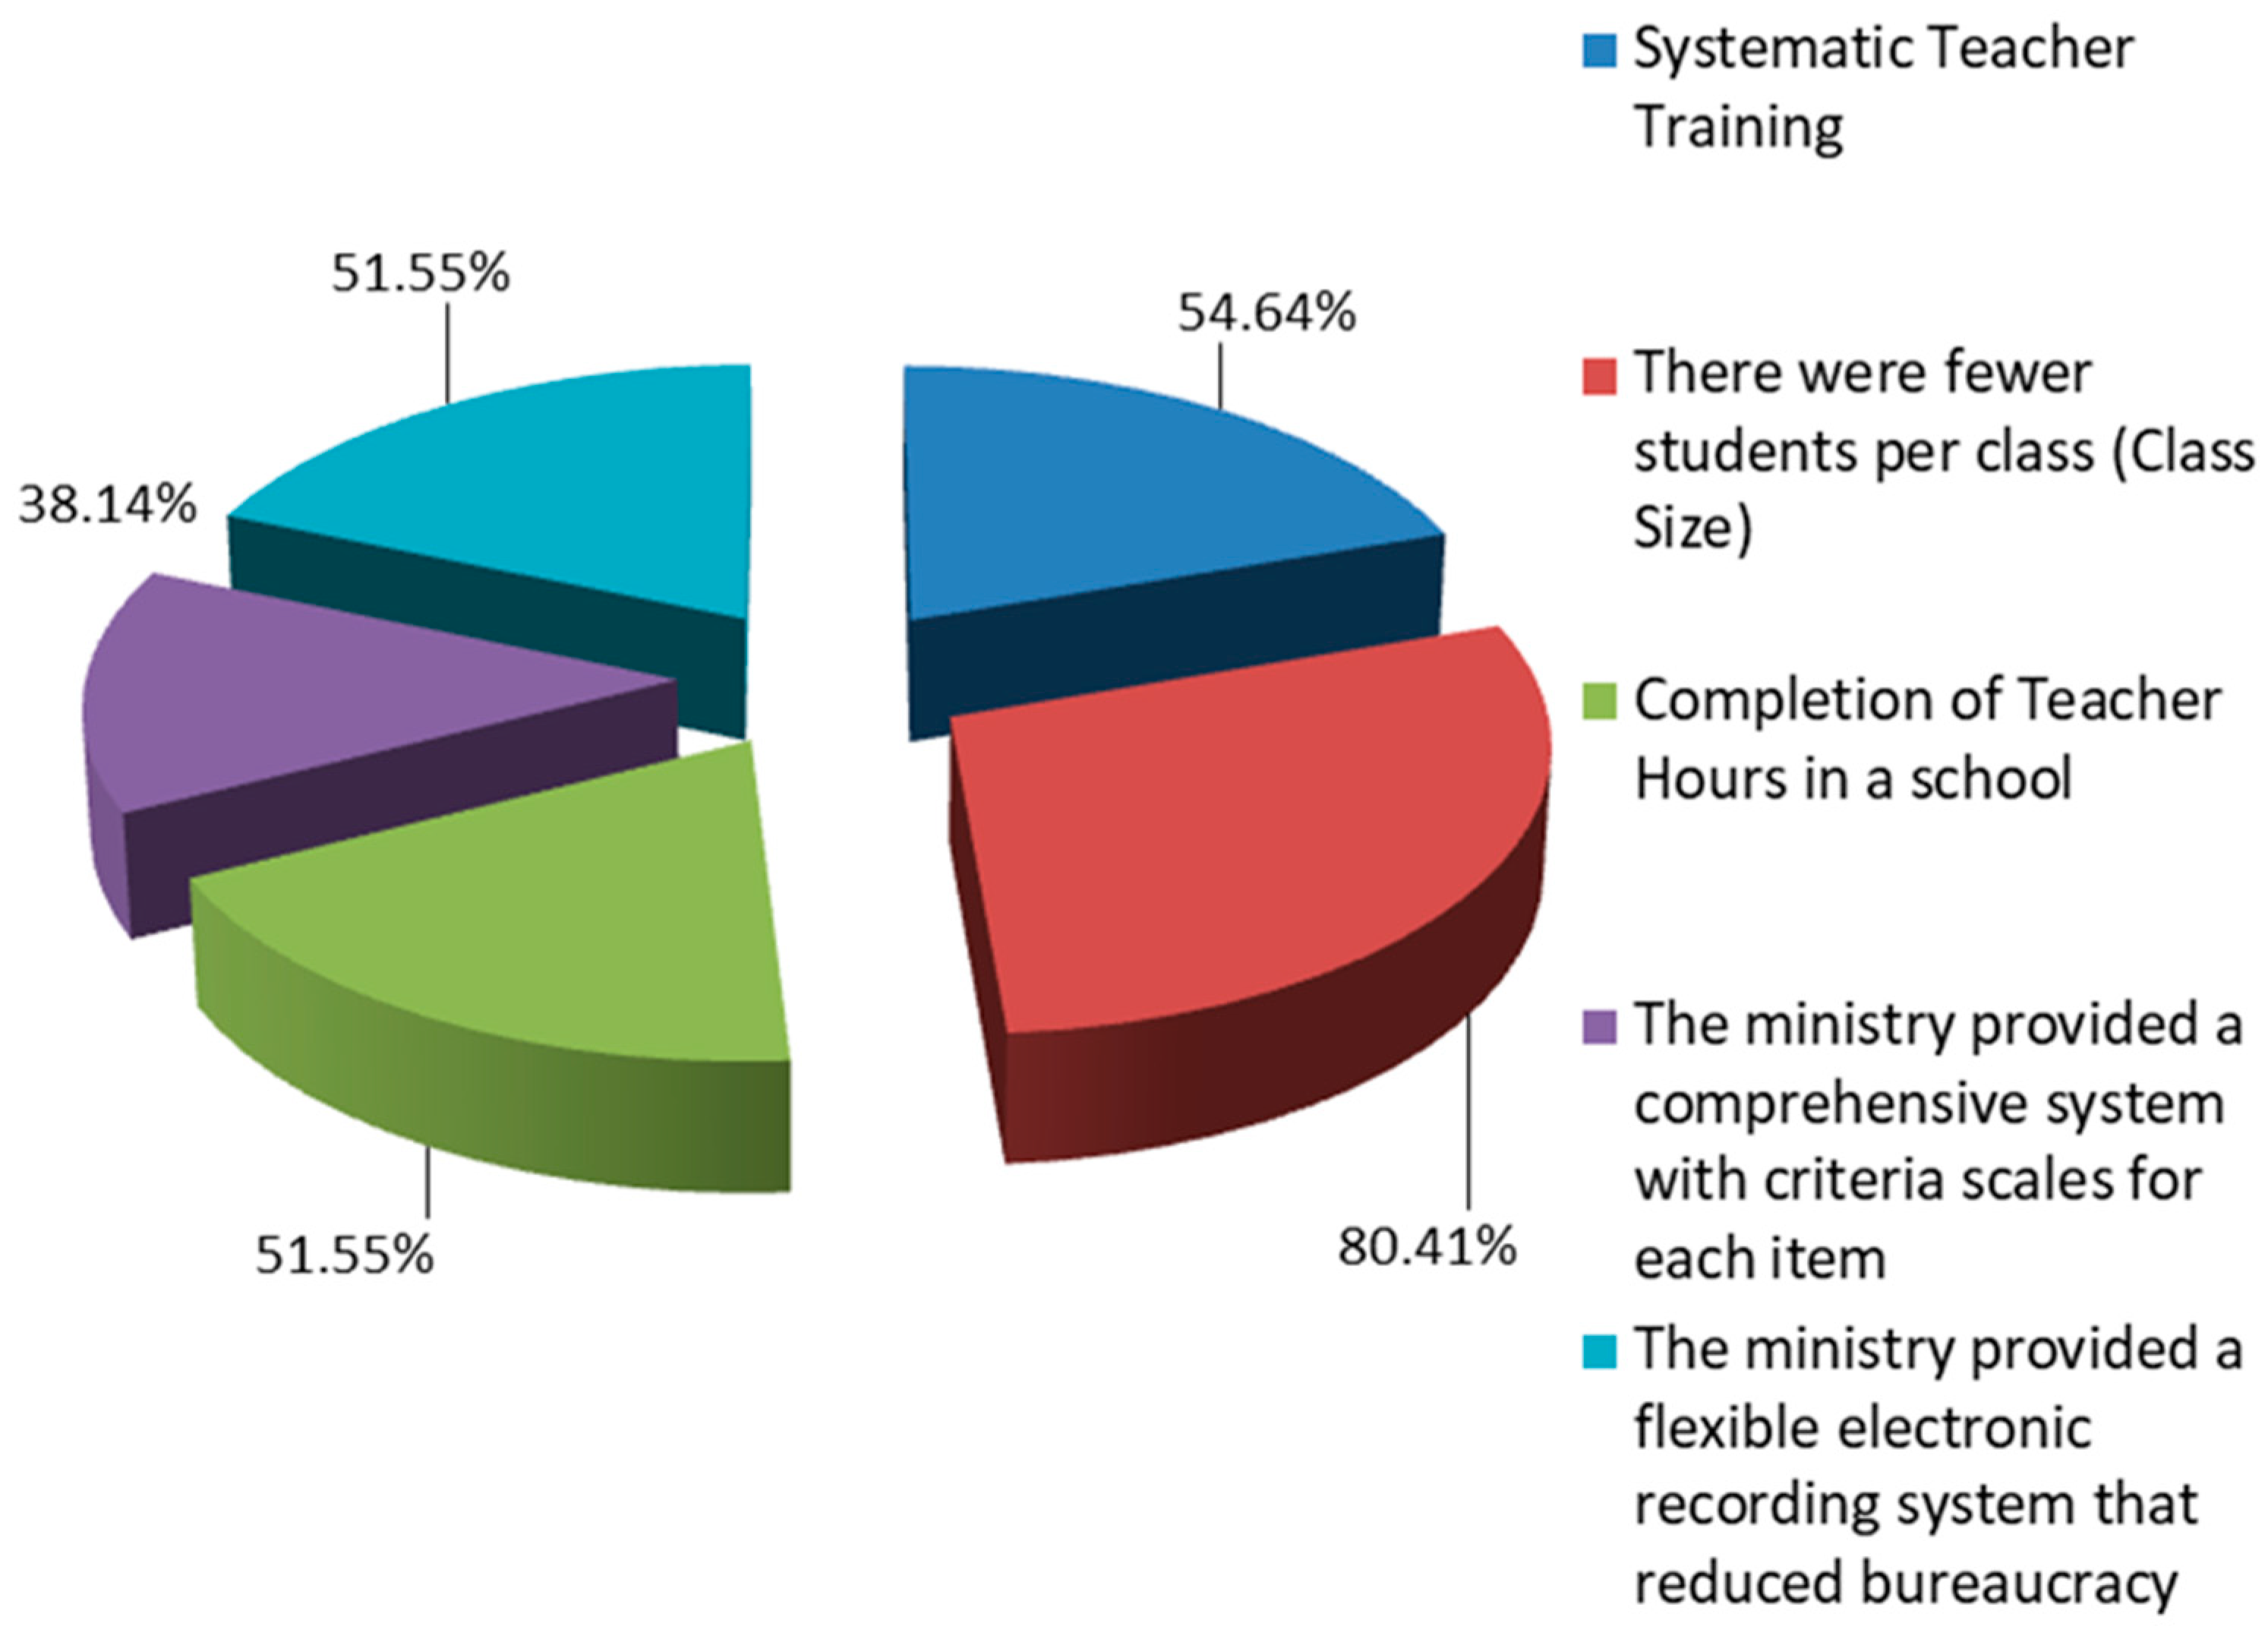
Figure 11.
Q21: State whether you would use an official descriptive assessment evaluation system provided by the Ministry of Education.
Figure 11.
Q21: State whether you would use an official descriptive assessment evaluation system provided by the Ministry of Education.
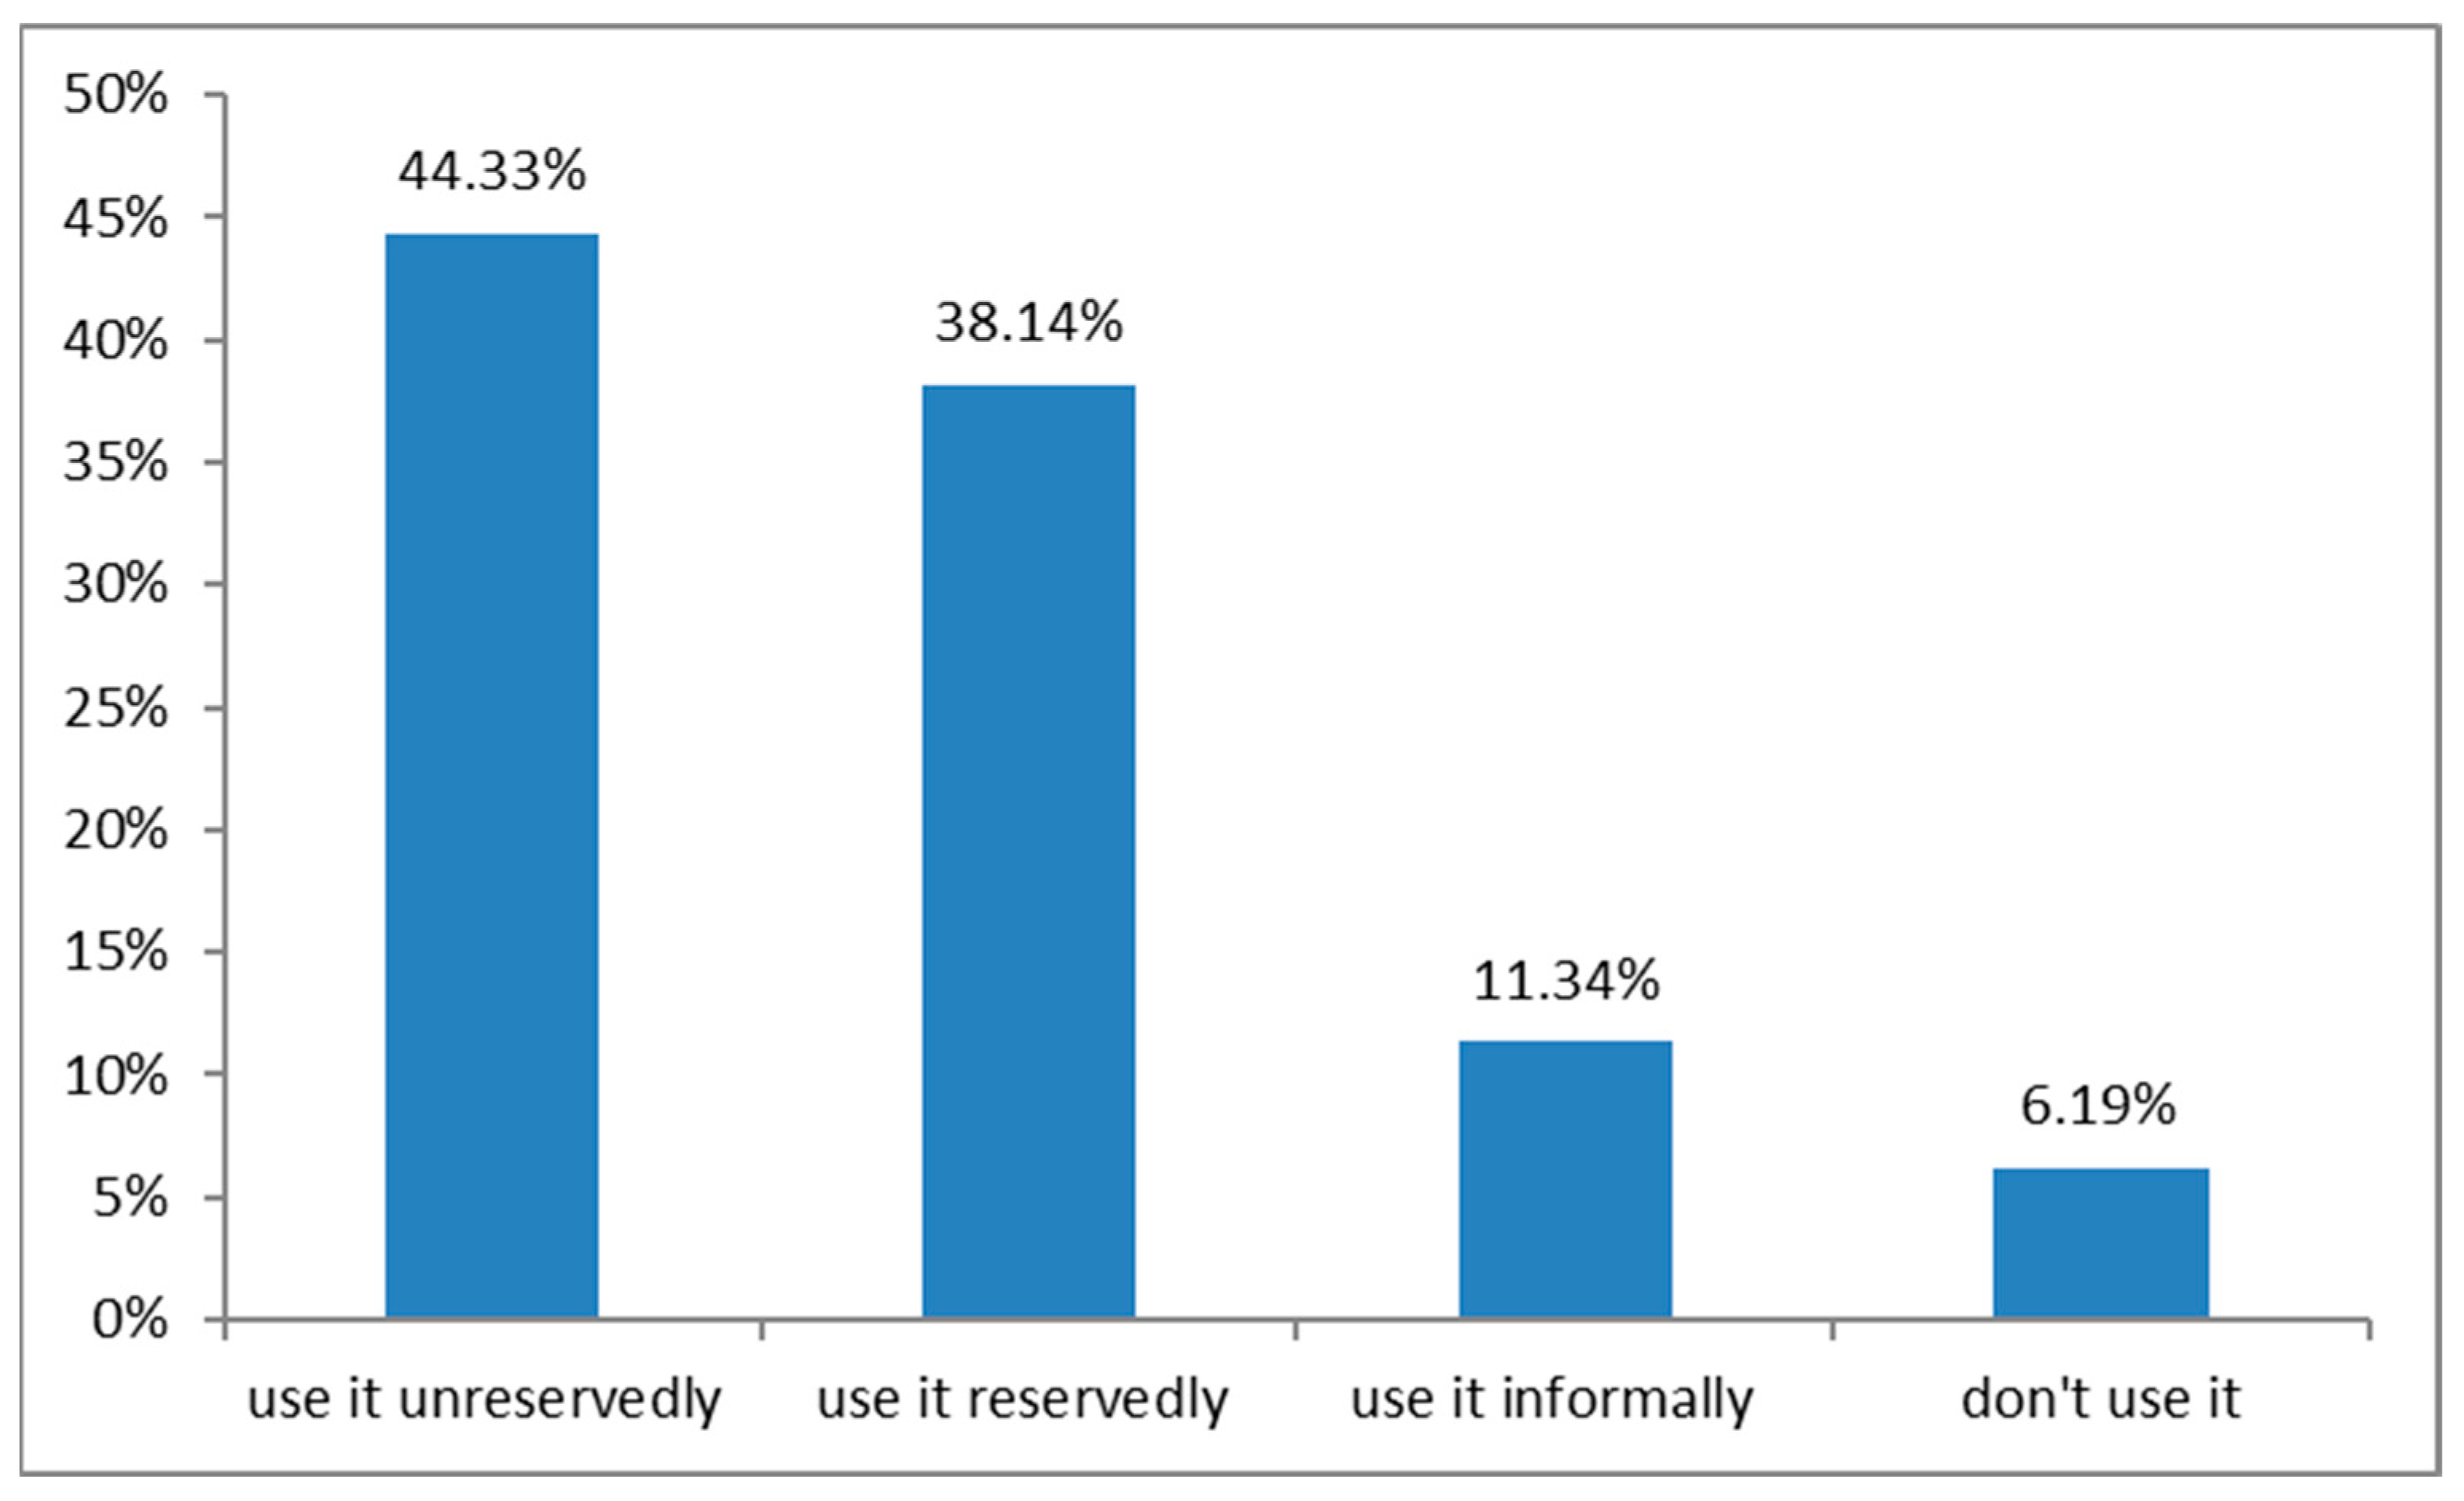
Table 1.
Questions.
| Q1: State your major as a Geology-Geography teacher. Q2: State the location of your school. Q3: State the type of your school. Q4: State the level of your education. Q5: State your opinion on whether the final assessment is a necessary process for high school students. Q6: State your opinion on whether the final assessment of students using a numerical scale is a valid and reliable process. Q7: State your opinion on whether descriptive assessment of students is a valid and reliable process. Q8: State your opinion about the 3 most important dimensions of the educational process contributed by the final assessment in a numerical way. Q19: State your opinion about how much you know about Descriptive Assessment procedures. Q10: State your opinion on whether you would be interested in including a descriptive assessment complementary to your teaching. Q11: State your opinion about the three most important points of the educational process contributed by descriptive assessment. Q12: Choose up to 3 teaching subjects that you think the final assessment using descriptive assessment (student card) is more appropriate. Q13: State the method you use for the final assessment of the students in the course “Geology-Geography”. Q14: State the tools you use for the evaluation of the oral performance of the students in the course “Geology-Geography”. Q15: State the tools you use for the evaluation of the written performance of students in the course “Geology-Geography”. Q16: State the tools you use for the evaluation of the students’ homework in the course “Geology-Geography”. Q17: State 3 of the following assessment activities for the course “Geology-Geography” that you consider to best fit the descriptive assessment profile. Q18: State where you received your training in student assessment. Q19: State the 3 most important of the following factors that you consider to prevent the application of descriptive assessment in class. Q20: State the 3 most important of the following factors that you consider to assist the application of descriptive assessment in class. Q21: State whether you would use an official descriptive assessment evaluation system provided by the Ministry of Education. |
Table 2.
Correlation between teachers’ science majors and considerable interest in descriptive assessment.
Table 2.
Correlation between teachers’ science majors and considerable interest in descriptive assessment.
| Teaching Majors | Mathematician | Physicist | Chemist | Biologist | Geologist | Home Economist | Total | |
|---|---|---|---|---|---|---|---|---|
| Strongly Agree | Ν | 1 | 0 | 2 | 2 | 15 | 3 | 23 |
| % | 11% | 0% | 9% | 25% | 47% | 17% | 24% | |
| Rather Agree | Ν | 4 | 8 | 3 | 3 | 8 | 8 | 34 |
| % | 44% | 50% | 18% | 38% | 25% | 44% | 34% | |
| Neither Agree nor Disagree | Ν | 2 | 7 | 5 | 1 | 4 | 3 | 22 |
| % | 22% | 44% | 45% | 13% | 13% | 17% | 23% | |
| Rather disagree | Ν | 2 | 1 | 4 | 2 | 3 | 2 | 14 |
| % | 22% | 6% | 27% | 25% | 9% | 11% | 14% | |
| Strongly Disagree | Ν | 0 | 0 | 0 | 0 | 2 | 2 | 4 |
| % | 0% | 0% | 0% | 0% | 6% | 11% | 5% | |
| Total | 9 | 16 | 14 | 8 | 32 | 18 | 97 | |
Table 3.
Correlation between the teachers’ notion of the necessity of the final assessment and the use of a comprehensive descriptive assessment system provided by the ministry.
Table 3.
Correlation between the teachers’ notion of the necessity of the final assessment and the use of a comprehensive descriptive assessment system provided by the ministry.
| Unreservetively Use | Cautionly Use | Informal Use | Not Use at All | Total | ||
|---|---|---|---|---|---|---|
| Strongly Agree | Ν | 11 | 15 | 2 | 3 | 31 |
| % | 256% | 40.5% | 18.2% | 50.% | 32% | |
| Rather Agree | Ν | 12 | 15 | 4 | 1 | 32 |
| % | 27.9% | 40.5% | 36.4% | 16.7% | 33% | |
| Neither Agree nor Disagree | Ν | 9 | 5 | 4 | 2 | 20 |
| % | 20.9% | 13.5% | 36.4% | 33.3% | 20.6% | |
| Rather disagree | Ν | 7 | 1 | 0 | 0 | 8 |
| % | 16.3% | 2.7% | 0.0% | 0.0% | 8.3% | |
| Strongly Disagree | Ν | 4 | 1 | 1 | 0 | 6 |
| % | 9.3% | 2.7% | 9.1% | 0.0% | 6.1% | |
| Total | 9 | 32 | 1 | 18 | 97 | |
Table 4.
Correlation between teachers’ training regarding assessment and their intention to integrate descriptive assessment.
Table 4.
Correlation between teachers’ training regarding assessment and their intention to integrate descriptive assessment.
| I Know a Great Extent | I Know a Lot | I Know Enough | I Know Some | I Know a Little | I Know Very Little | I Do not Know Anything | Total | ||
|---|---|---|---|---|---|---|---|---|---|
| Strongly Agree | Ν | 3 | 5 | 7 | 5 | 1 | 3 | 0 | 24 |
| % | 30.0% | 38.5% | 26.9% | 23.8% | 6.3% | 37.5% | 0.0% | 24.7% | |
| Rather Agree | Ν | 2 | 5 | 12 | 5 | 6 | 1 | 2 | 33 |
| % | 20.0% | 38.5% | 46.2% | 23.8% | 37.5% | 12.5% | 66.7% | 34.0% | |
| Neither Agree nor Disagree | Ν | 2 | 1 | 5 | 6 | 6 | 2 | 0 | 22 |
| % | 20.0% | 7.7% | 19.2% | 28.6% | 37.5% | 25.0% | 0.0% | 22.7% | |
| Rather disagree | Ν | 0 | 2 | 2 | 4 | 3 | 2 | 0 | 13 |
| % | 0.0% | 15.4% | 7.7% | 19.0% | 18.8% | 25.0% | 0.0% | 13.4% | |
| Strongly Disagree | Ν | 3 | 0 | 0 | 1 | 0 | 0 | 1 | 5 |
| % | 30.0% | 0.0% | 0.0% | 4.8% | 0.0% | 0.0% | 33.3% | 5.2% | |
| Total | 10 | 13 | 26 | 21 | 16 | 8 | 3 | 97 |
|
Disclaimer/Publisher’s Note: The statements, opinions and data contained in all publications are solely those of the individual author(s) and contributor(s) and not of MDPI and/or the editor(s). MDPI and/or the editor(s) disclaim responsibility for any injury to people or property resulting from any ideas, methods, instructions or products referred to in the content. |
[ad_2]