Ecological Restoration in Eastern Canada Using Four Early-Successional Species on Severely Degraded Sites Using a Factorial of Site-Preparation Treatments: Growth and Biomass over Two Years
Figure 1.
(A) Rainfall (mm) sourced from nearby Fredericton, New Brunswick (45.9636° N, 66.6431° W) from 1 April 2021 to 30 September 2021. (B) Soil moisture readings in 2021 showing differences between straw and no straw coverage on dates when field assessments were performed. Dates marked with * are significantly different at p < 0.05. Note that the x-axis date ranges differ.
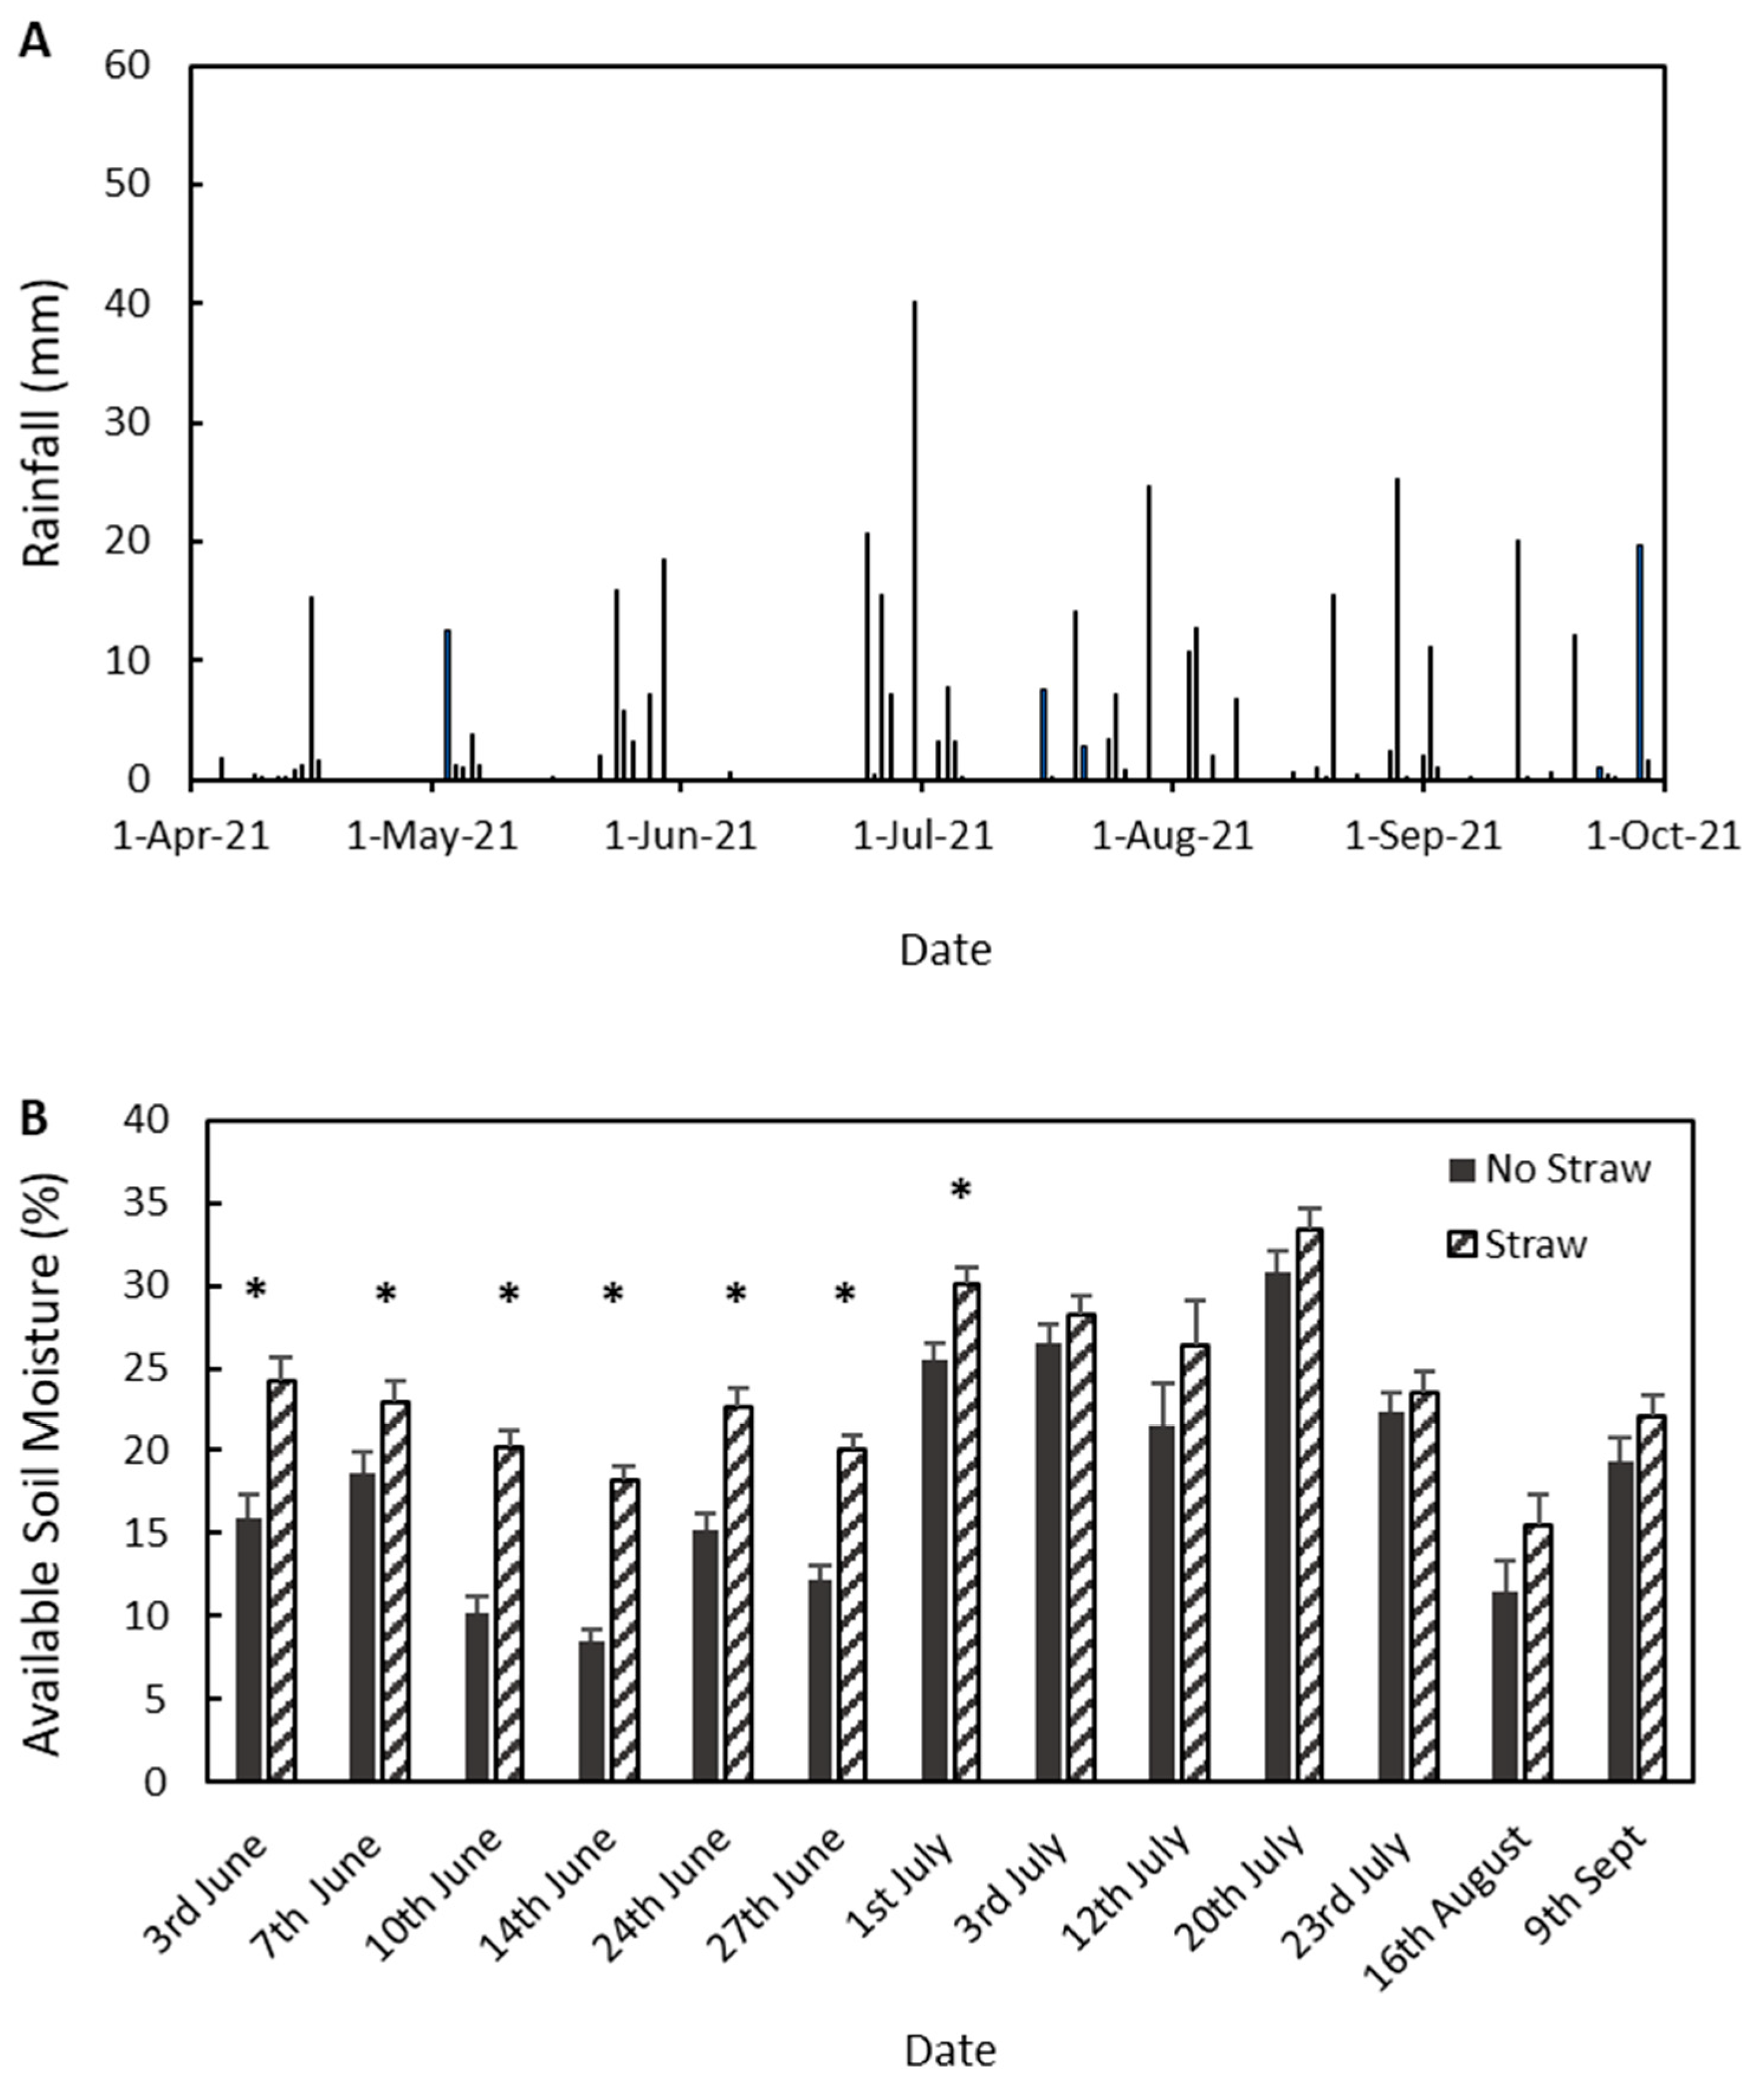
Figure 2.
(A) Rainfall (mm) sourced from nearby Fredericton, NB (45.9636° N, 66.6431° W) from 1 April to 30 September 2022. (B) Soil moisture readings taken in 2022 showing differences between straw and no straw plots on dates when field assessments were performed. Dates marked with * are significantly different at p < 0.05. Note that the x-axis ranges differ.
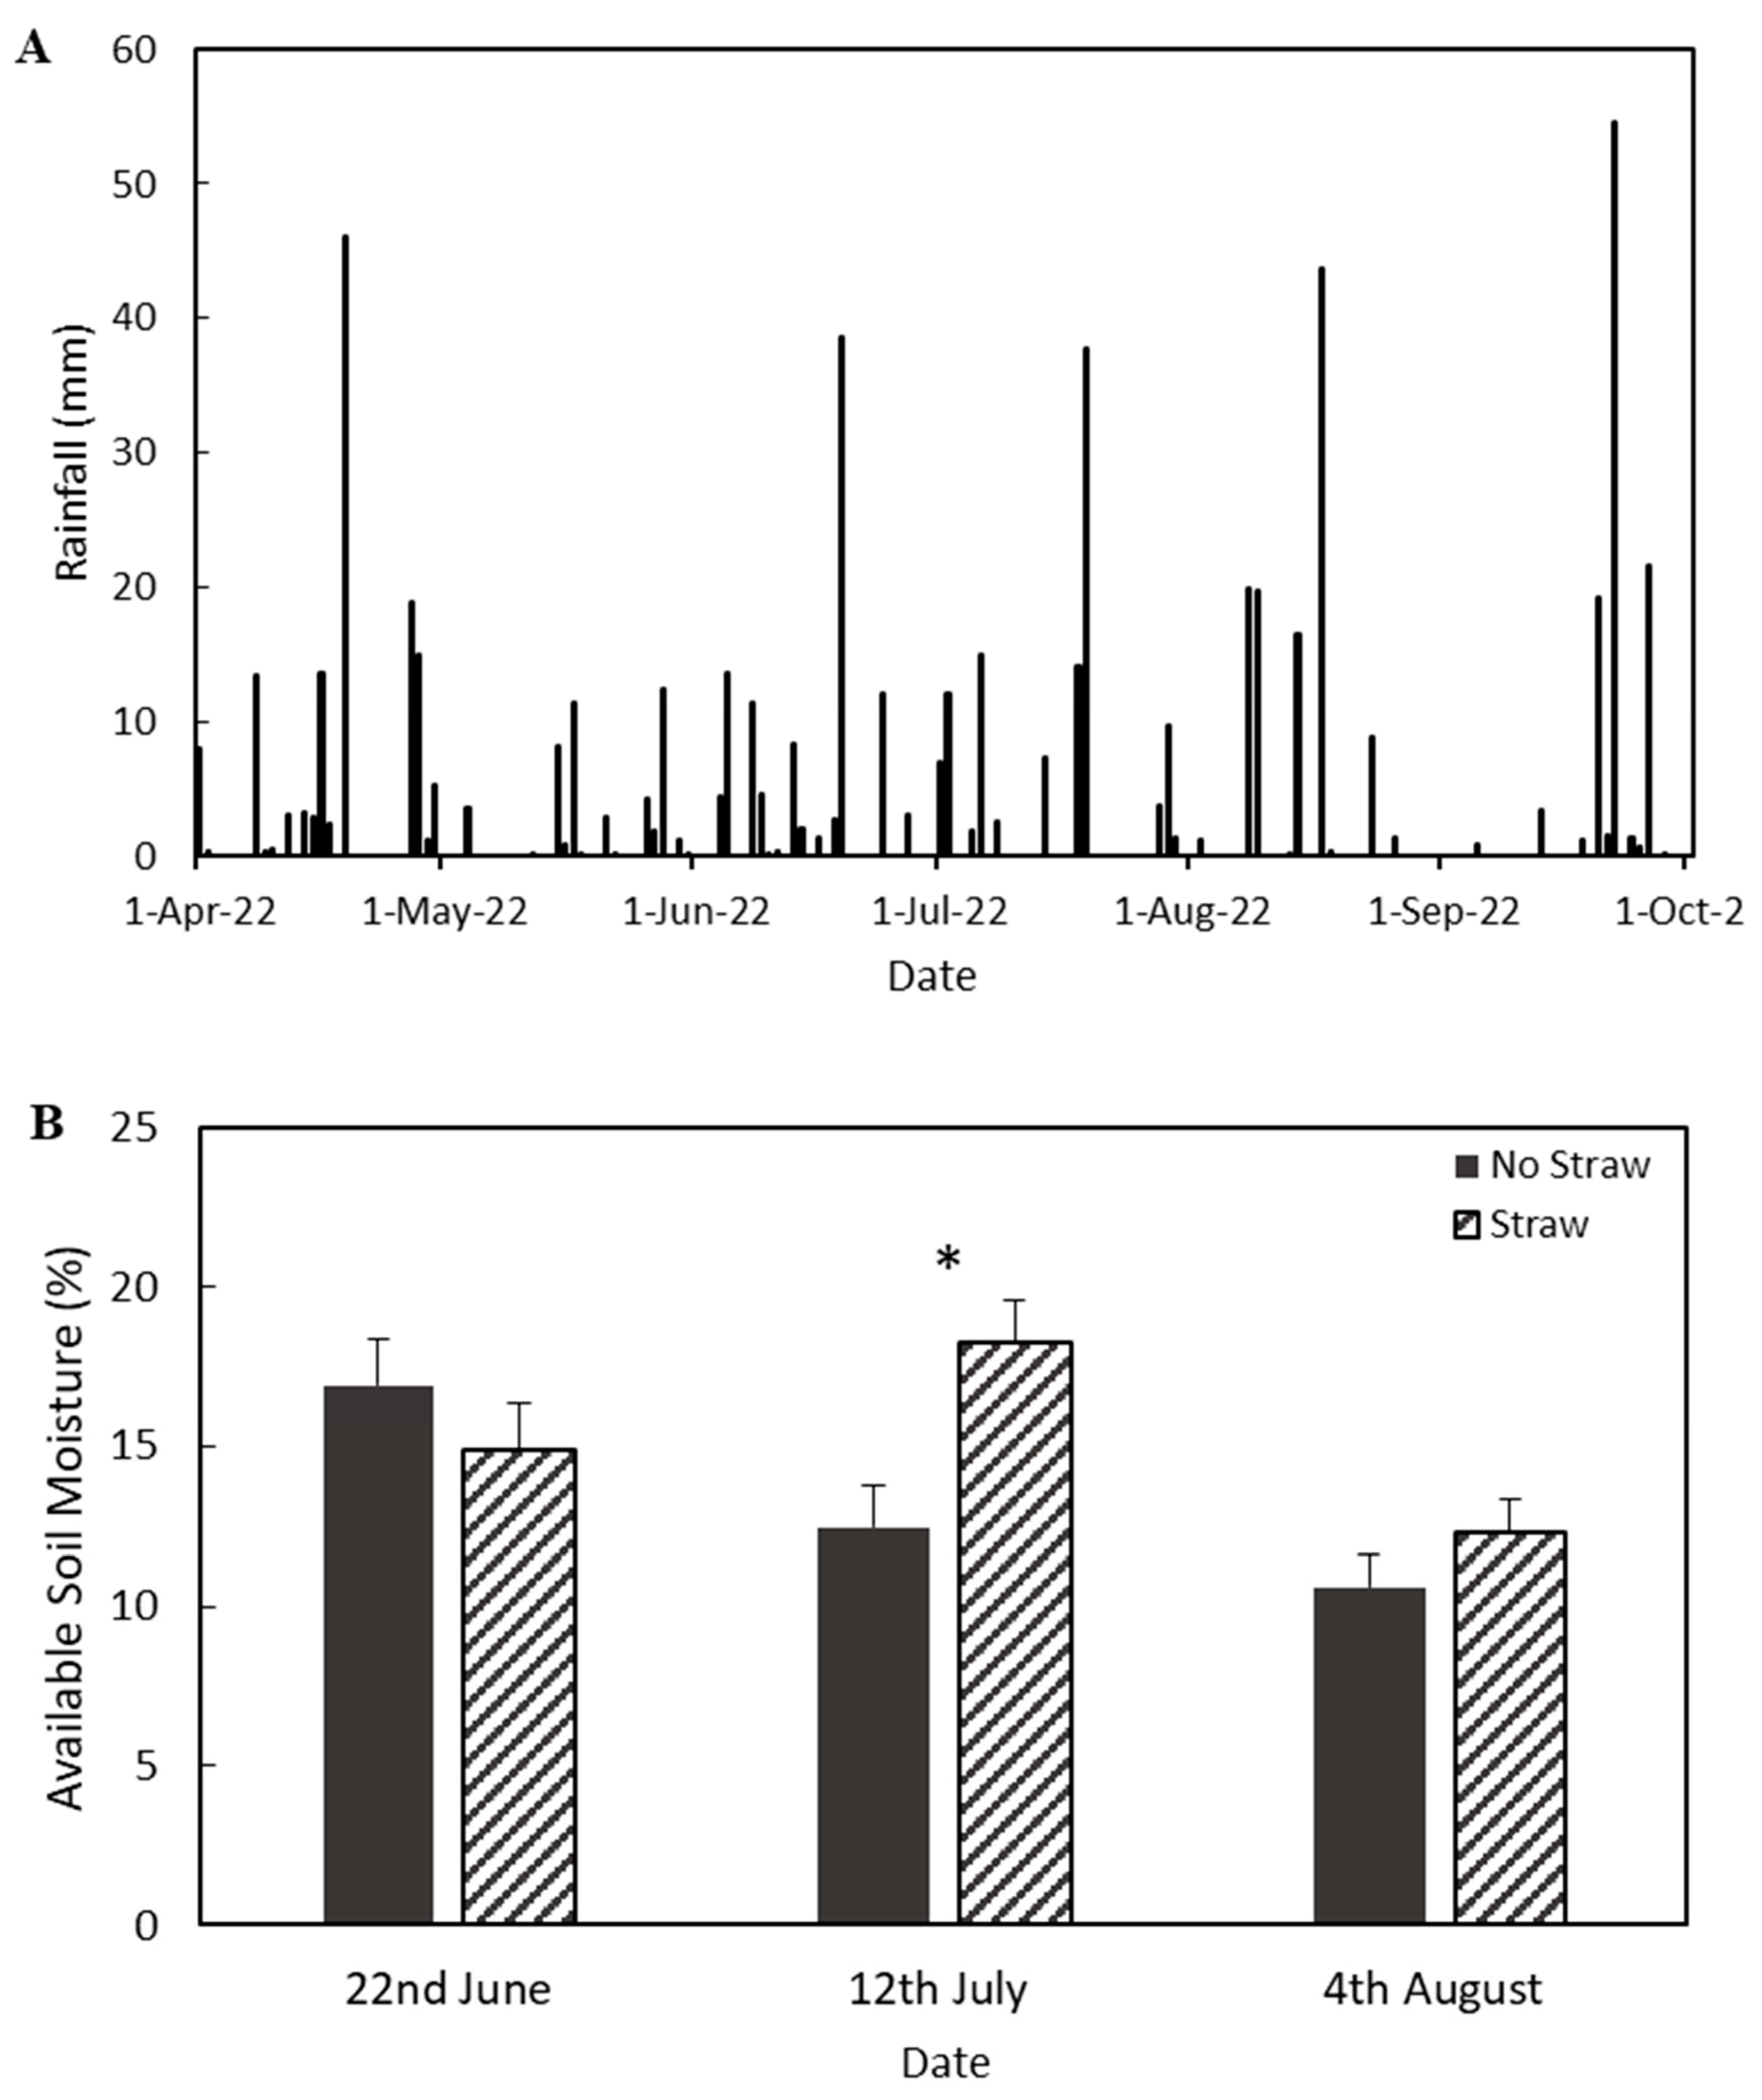
Figure 3.
First-year growth (cm) (mean ± SE) showing (A) species × S × CWD interaction; (B) site × S × CWD interaction. NS: no straw, S: straw, NCWD: no coarse woody debris, CWD: coarse woody debris (n = 1417).
Figure 3.
First-year growth (cm) (mean ± SE) showing (A) species × S × CWD interaction; (B) site × S × CWD interaction. NS: no straw, S: straw, NCWD: no coarse woody debris, CWD: coarse woody debris (n = 1417).
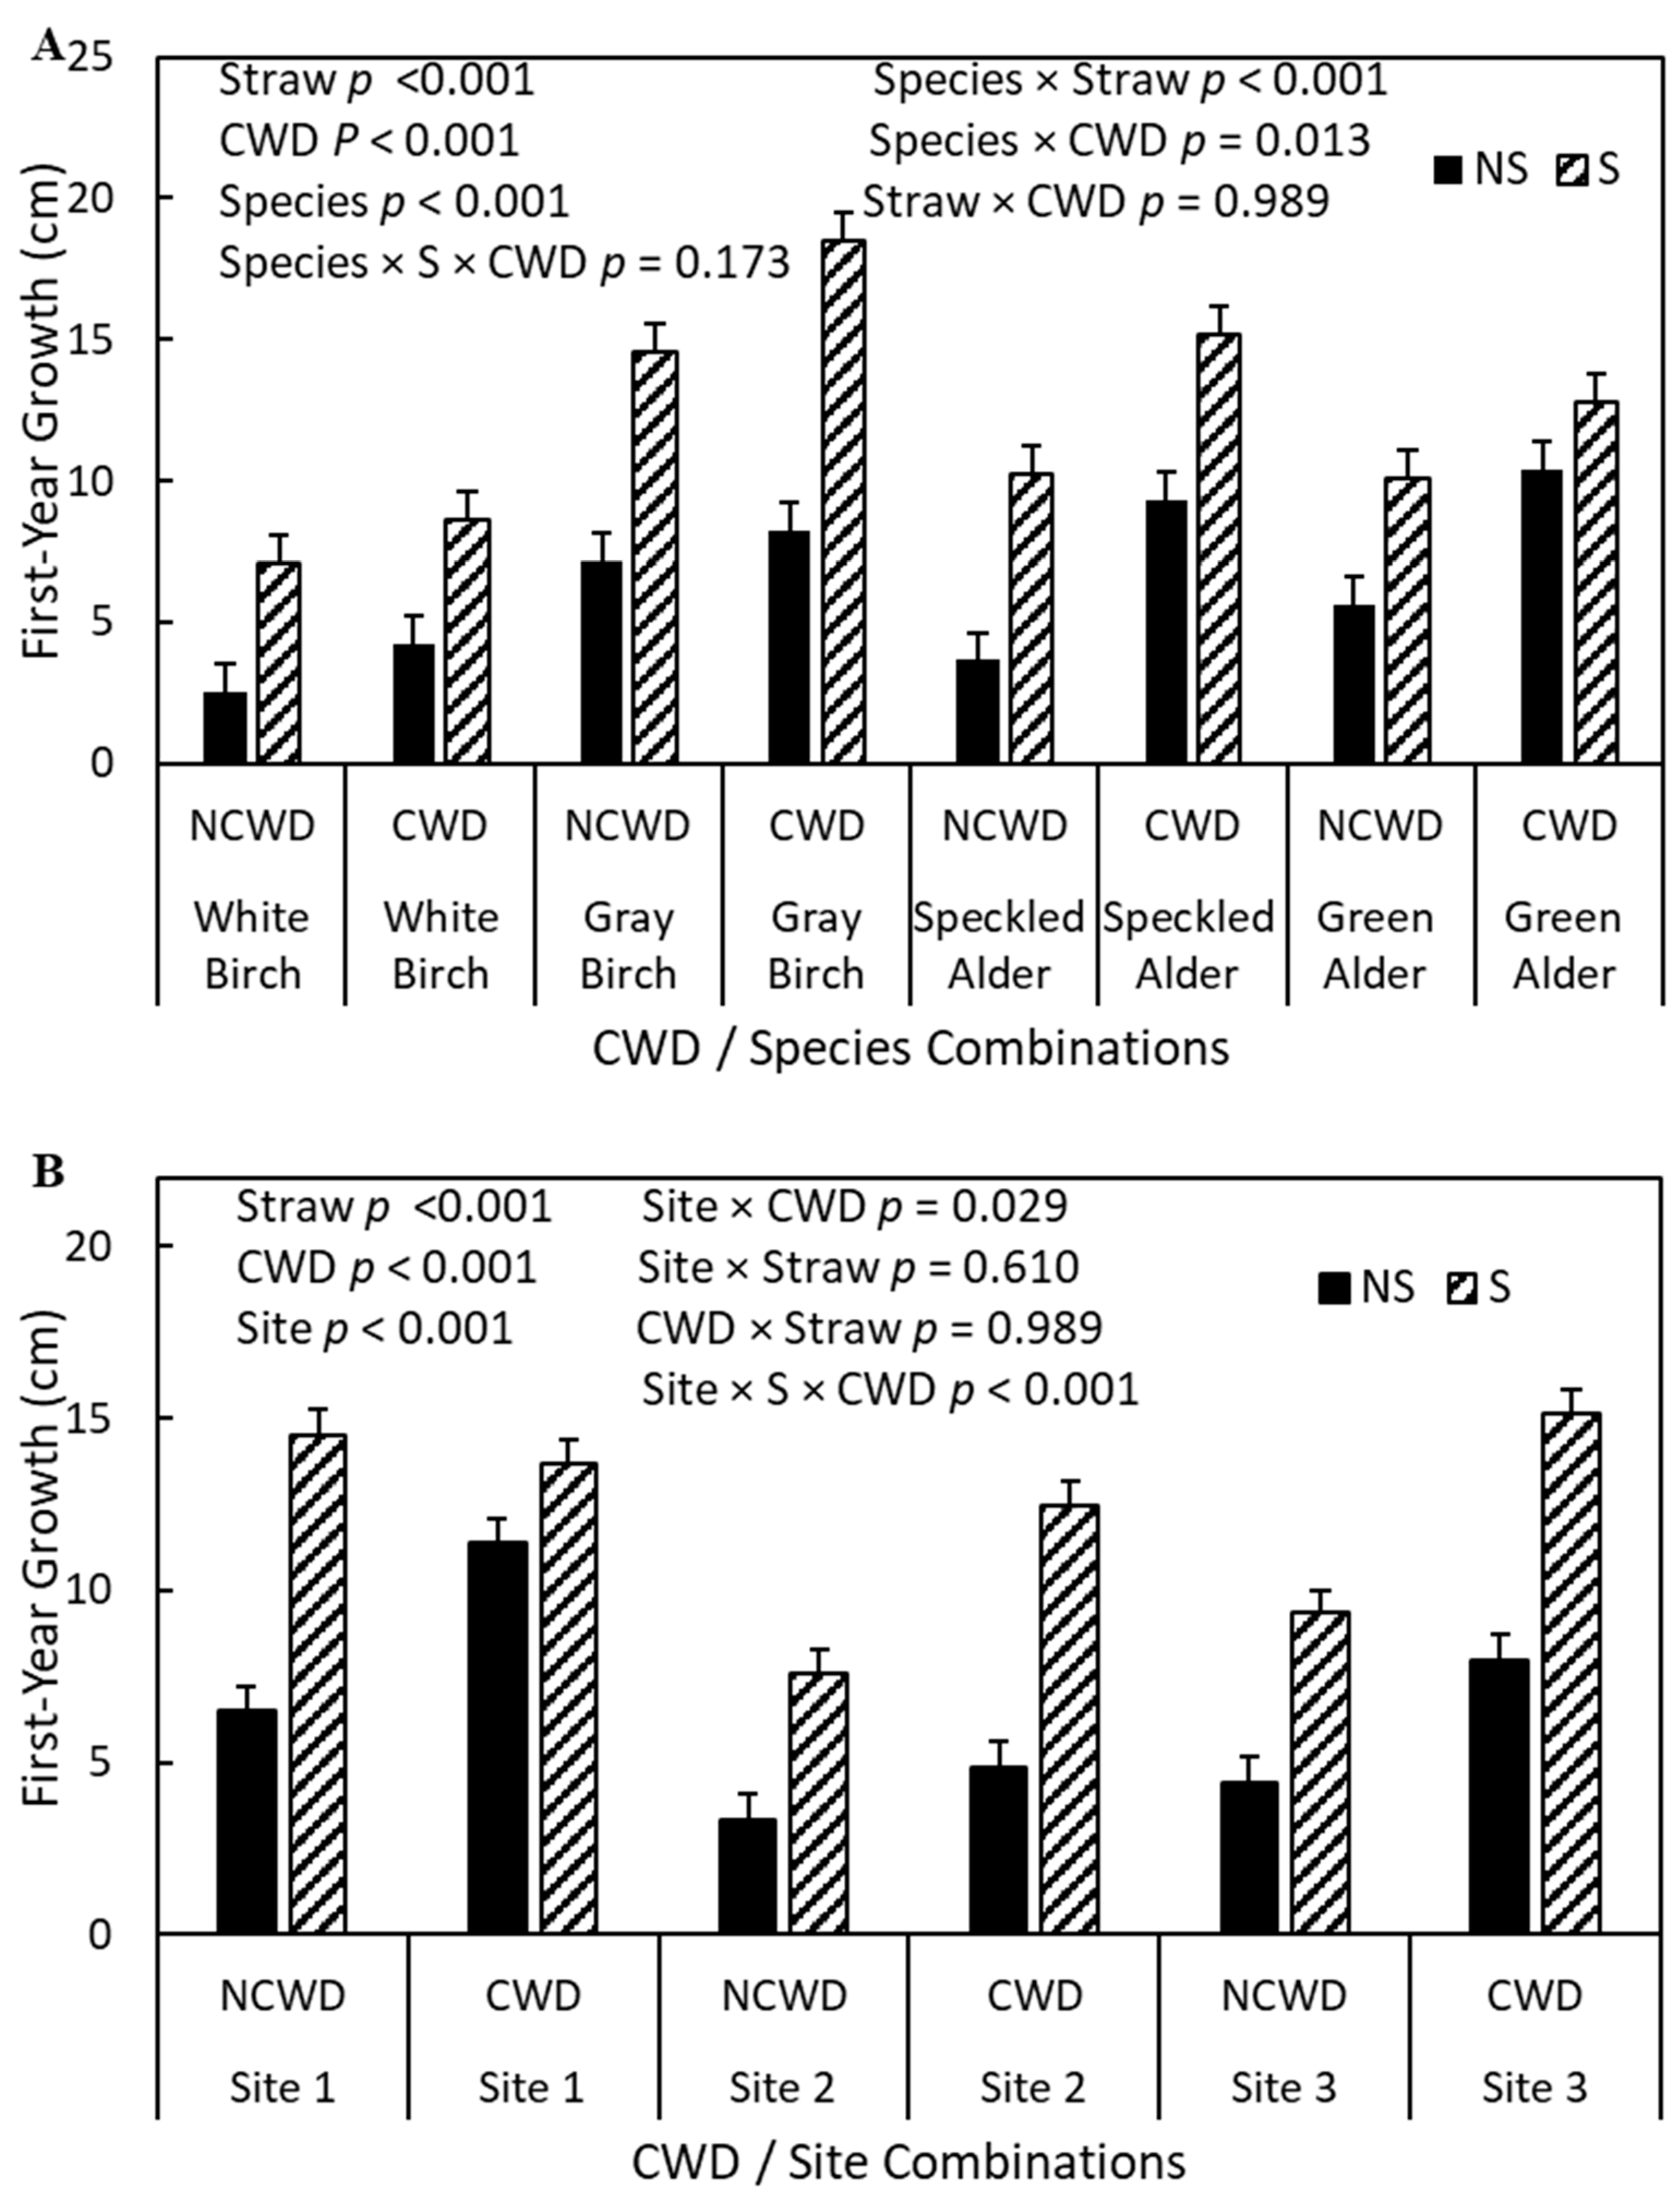
Figure 4.
Second-year growth (cm) (mean ± SE) showing (A) species × S × CWD interaction; (B) site × S × CWD interaction. NS: no straw, S: straw, NCWD: no coarse woody debris, CWD: coarse woody debris (n = 1210).
Figure 4.
Second-year growth (cm) (mean ± SE) showing (A) species × S × CWD interaction; (B) site × S × CWD interaction. NS: no straw, S: straw, NCWD: no coarse woody debris, CWD: coarse woody debris (n = 1210).
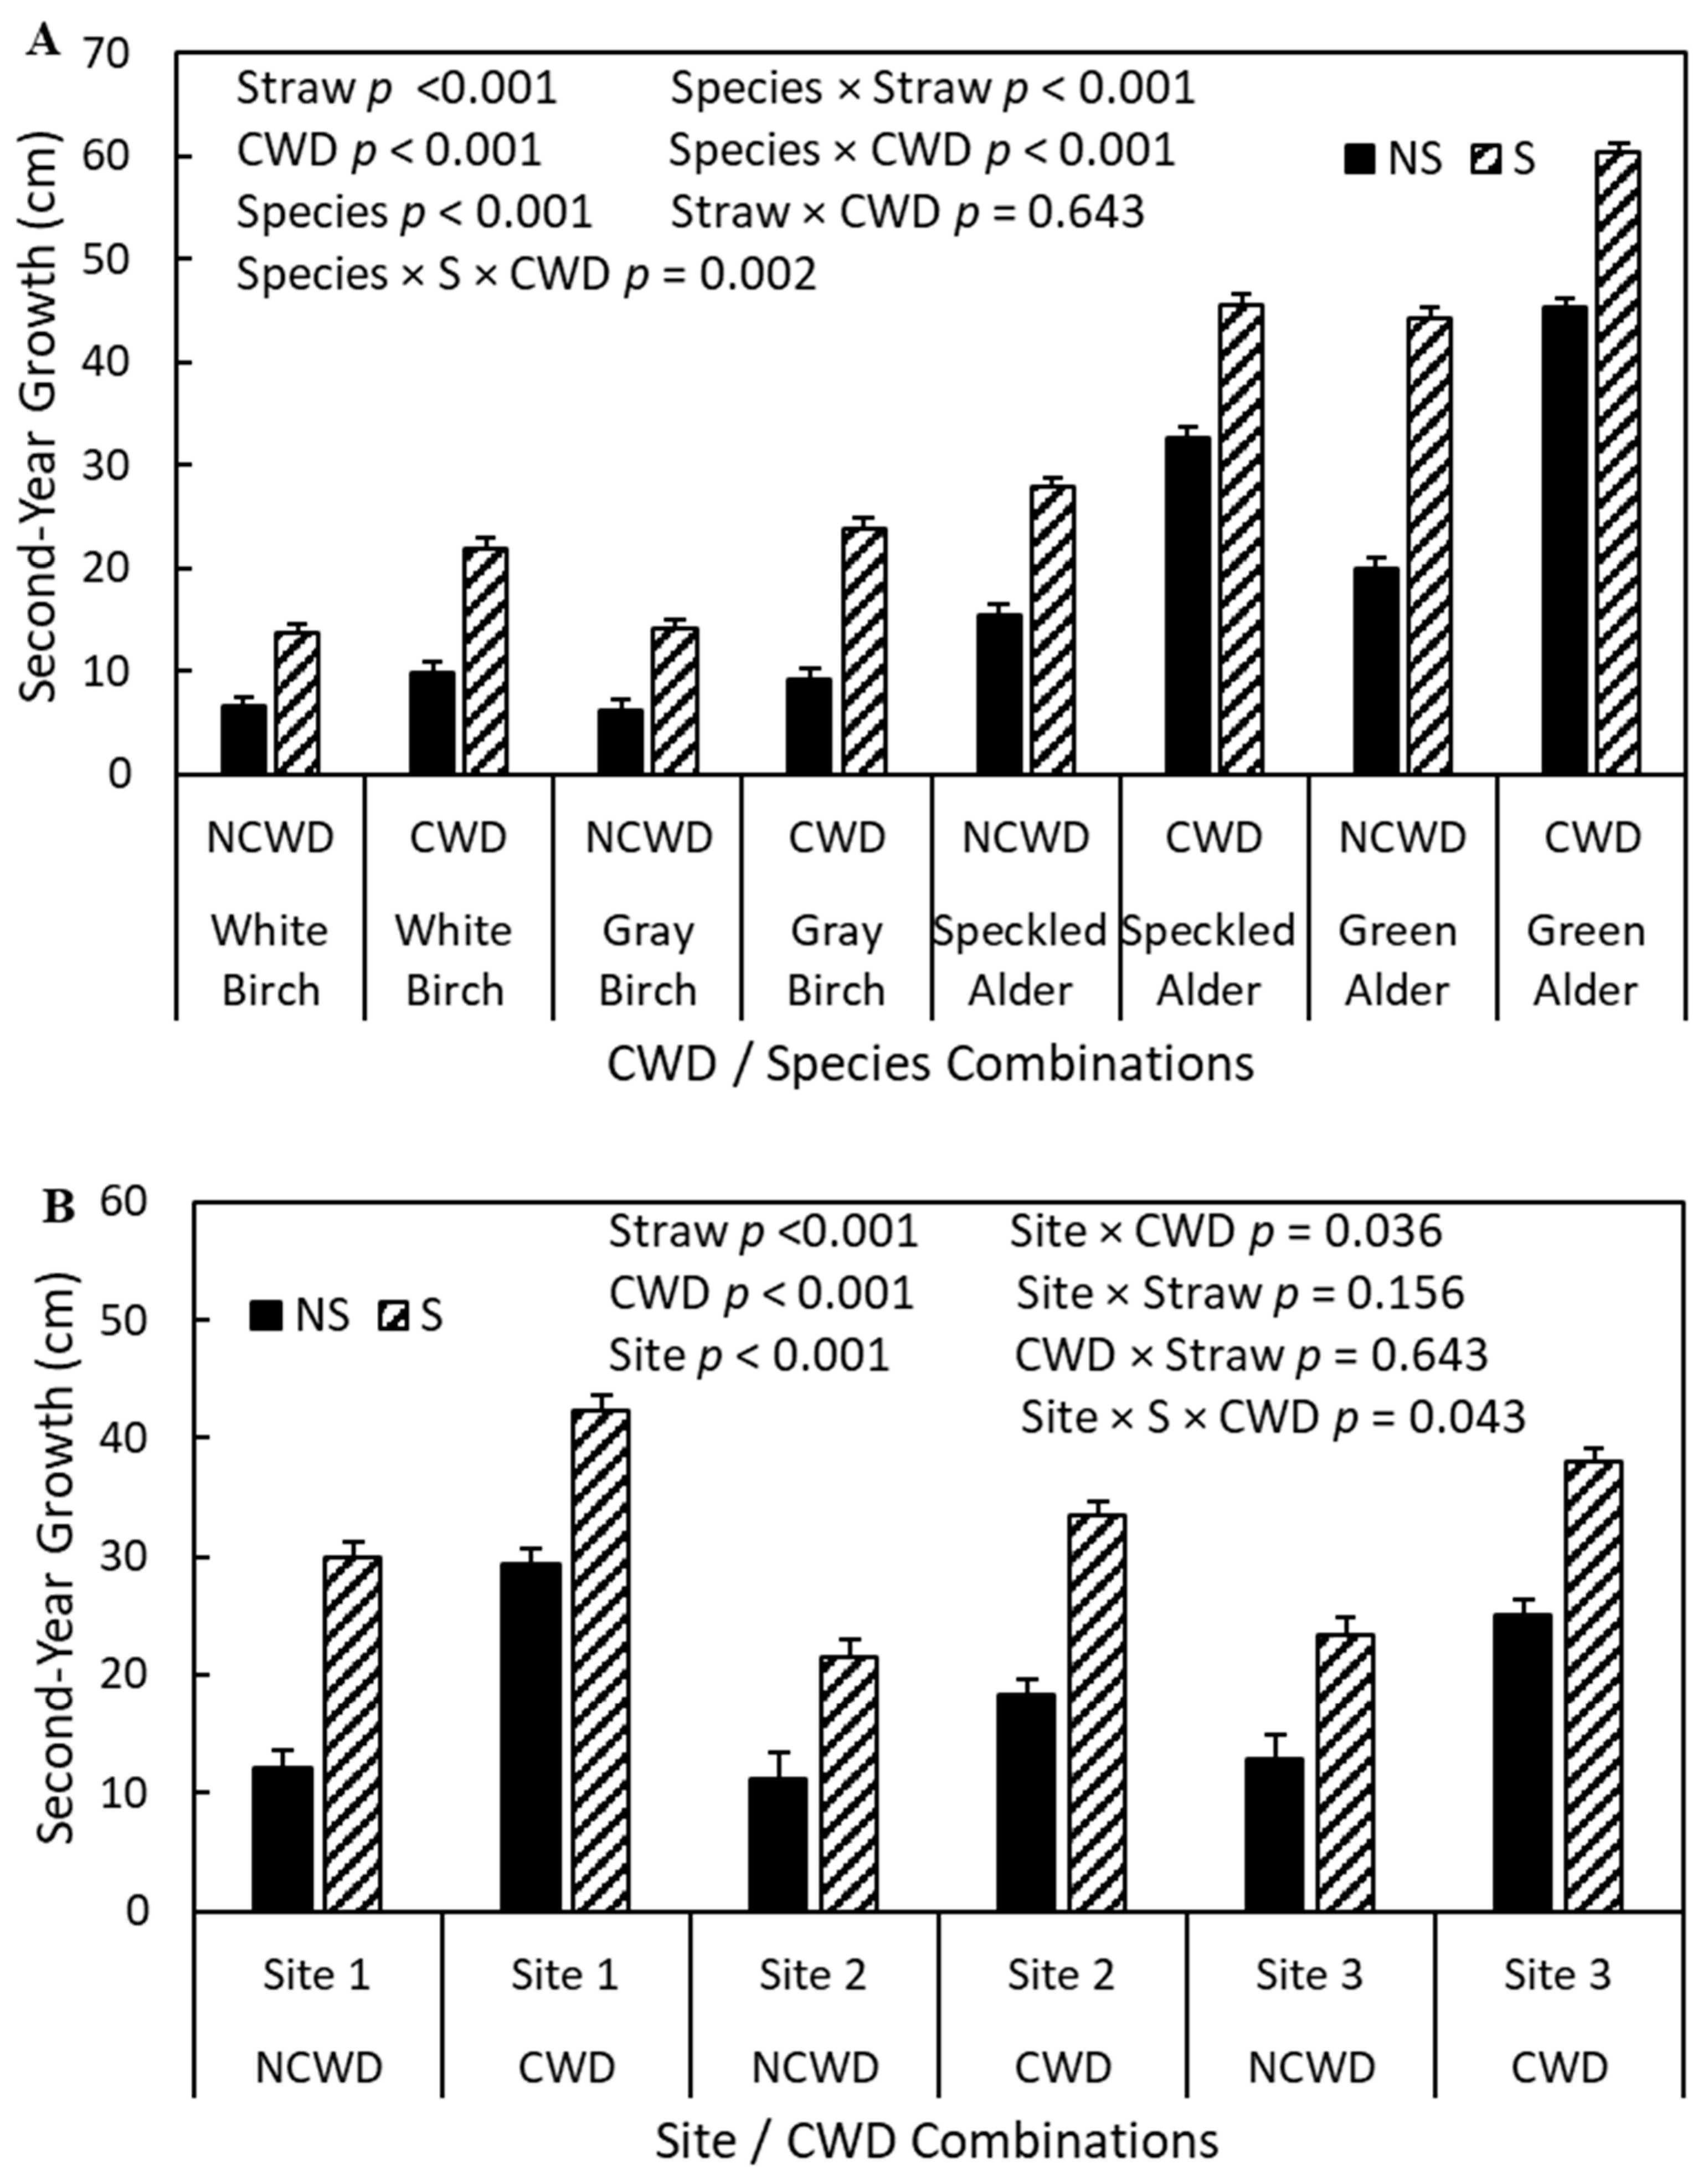
Figure 5.
Stem number (mean ± SE) showing a species × S × CWD interaction. NS: no straw, S: straw, NCWD: no coarse woody debris, CWD: coarse woody debris (n = 1210).
Figure 5.
Stem number (mean ± SE) showing a species × S × CWD interaction. NS: no straw, S: straw, NCWD: no coarse woody debris, CWD: coarse woody debris (n = 1210).
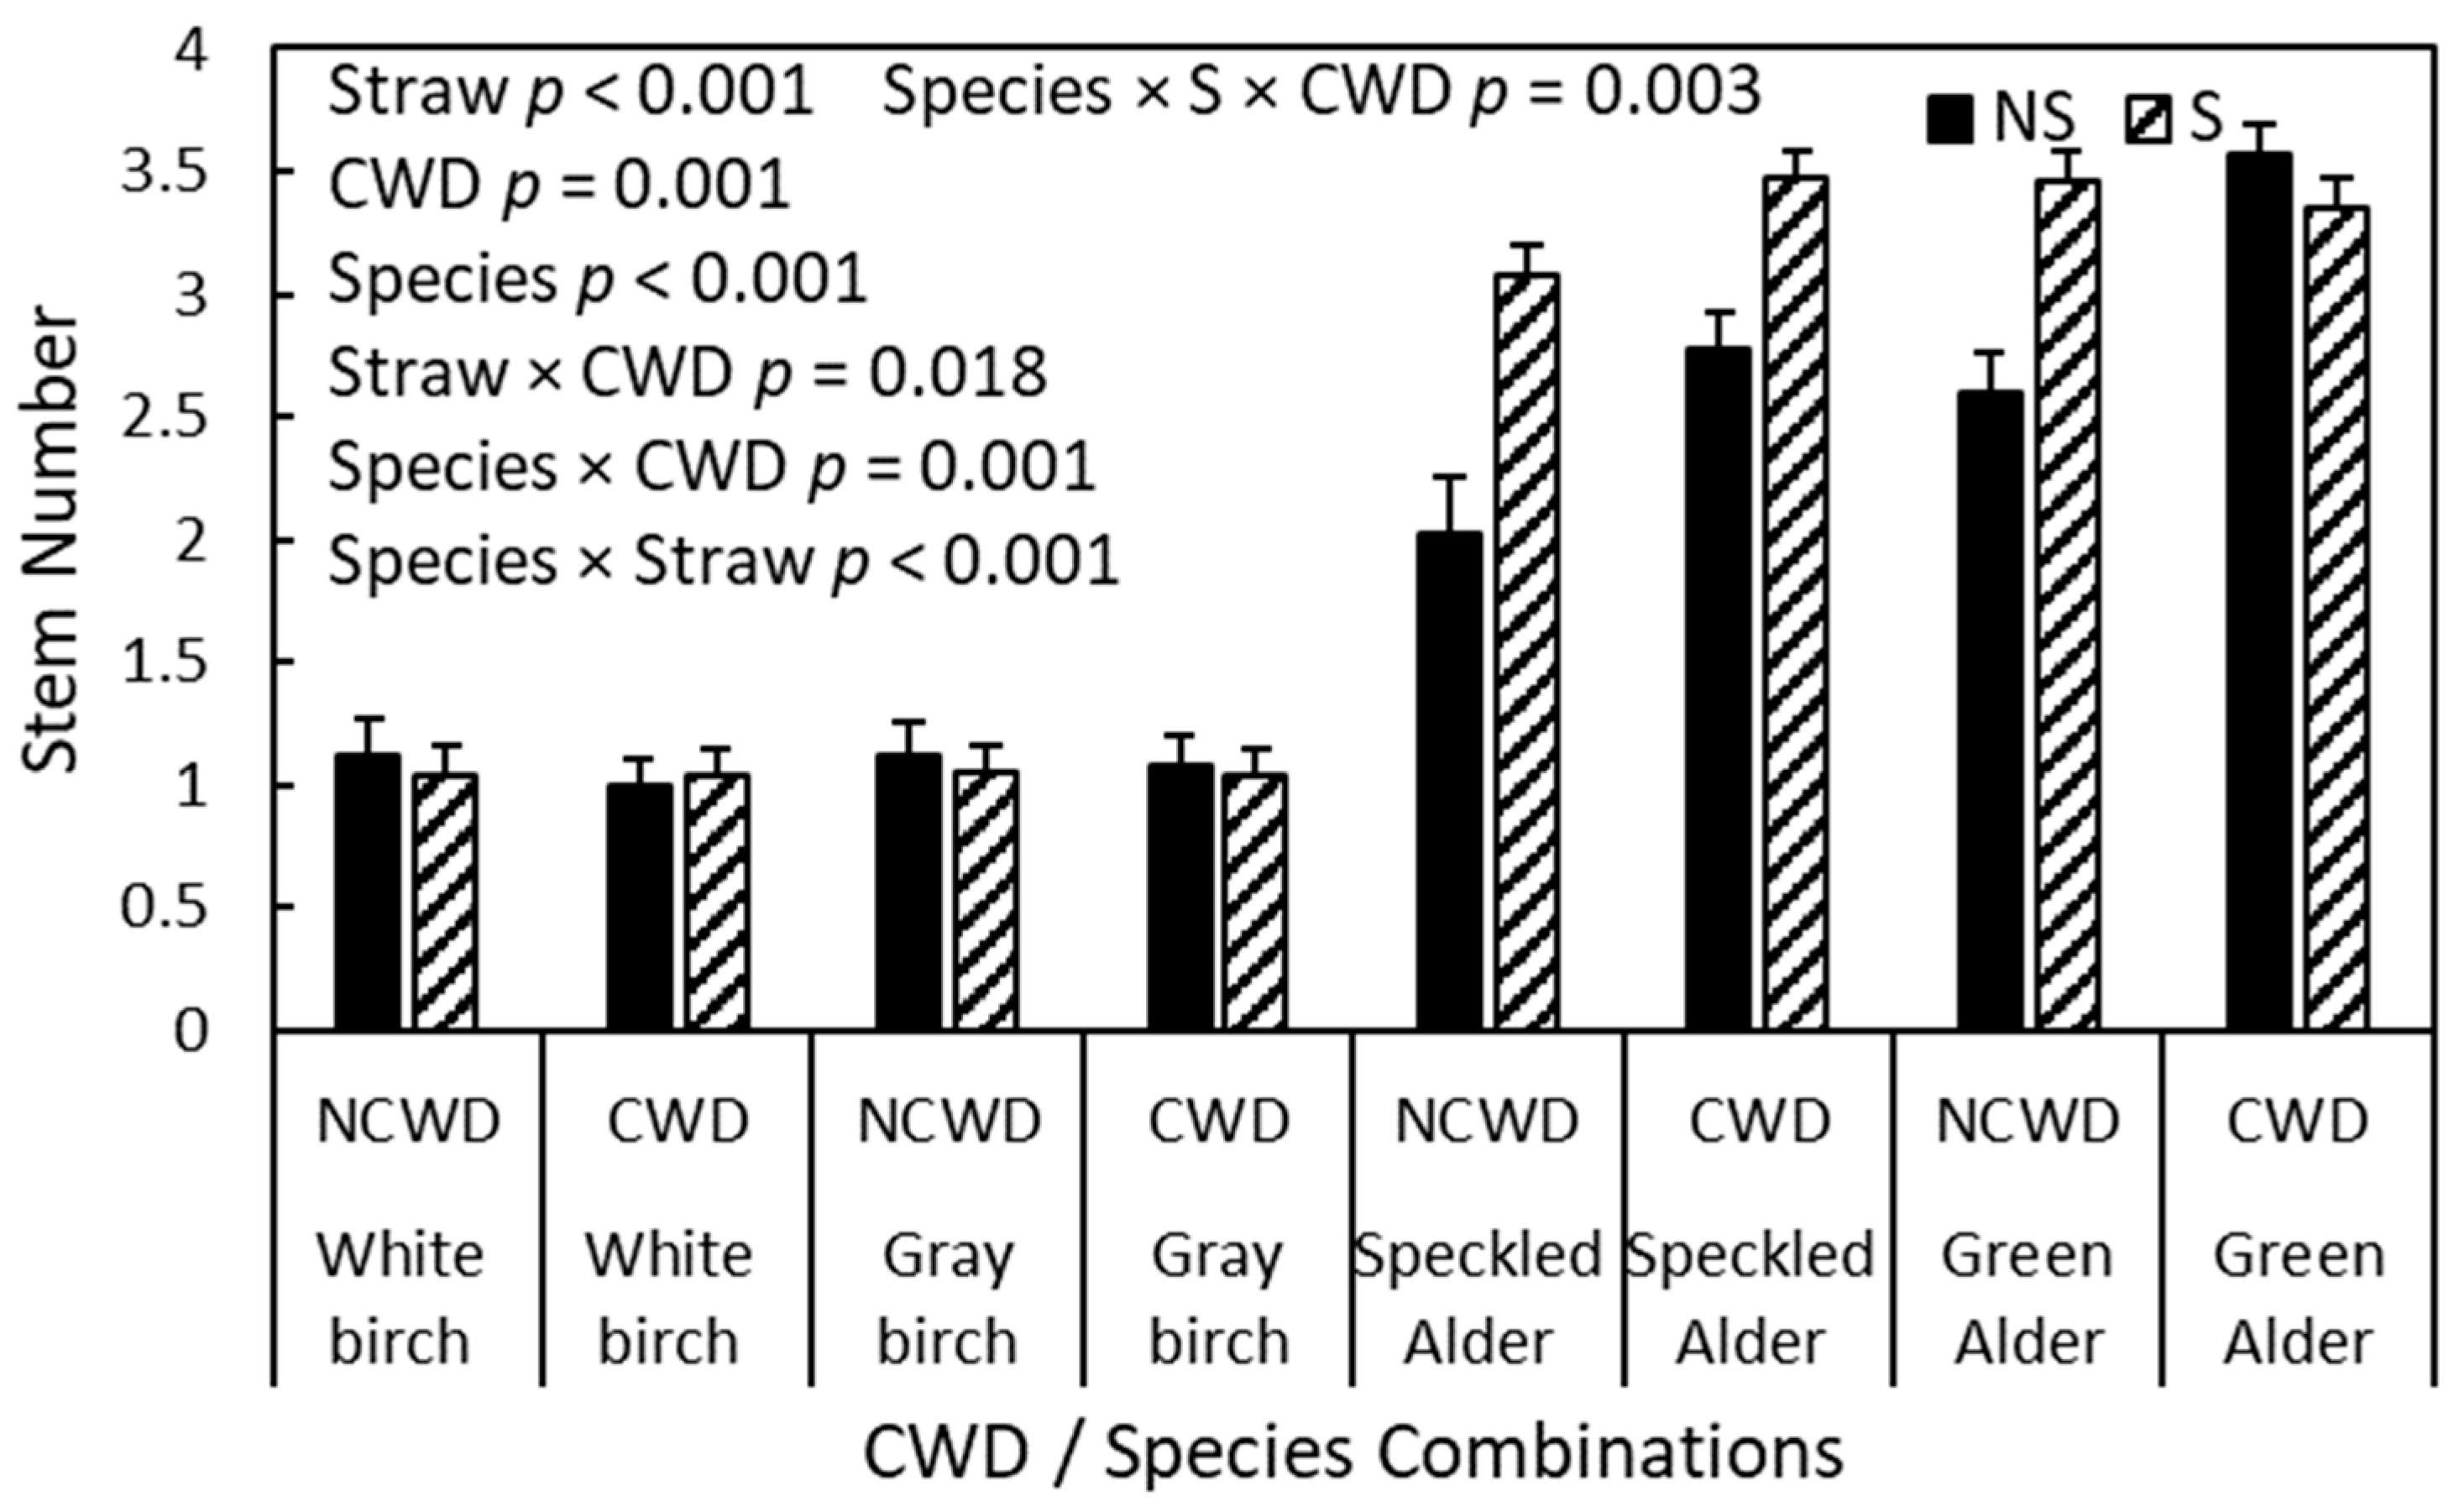
Figure 6.
Stem dry mass (mean ± SE) showing (A) species × S × CWD interaction; (B) site × MC × species interaction. NS: no straw, S: straw, NCWD: no coarse woody debris, CWD: coarse woody debris, NMC: no Meri-Crusher, MC: Meri-Crusher (n = 358).
Figure 6.
Stem dry mass (mean ± SE) showing (A) species × S × CWD interaction; (B) site × MC × species interaction. NS: no straw, S: straw, NCWD: no coarse woody debris, CWD: coarse woody debris, NMC: no Meri-Crusher, MC: Meri-Crusher (n = 358).
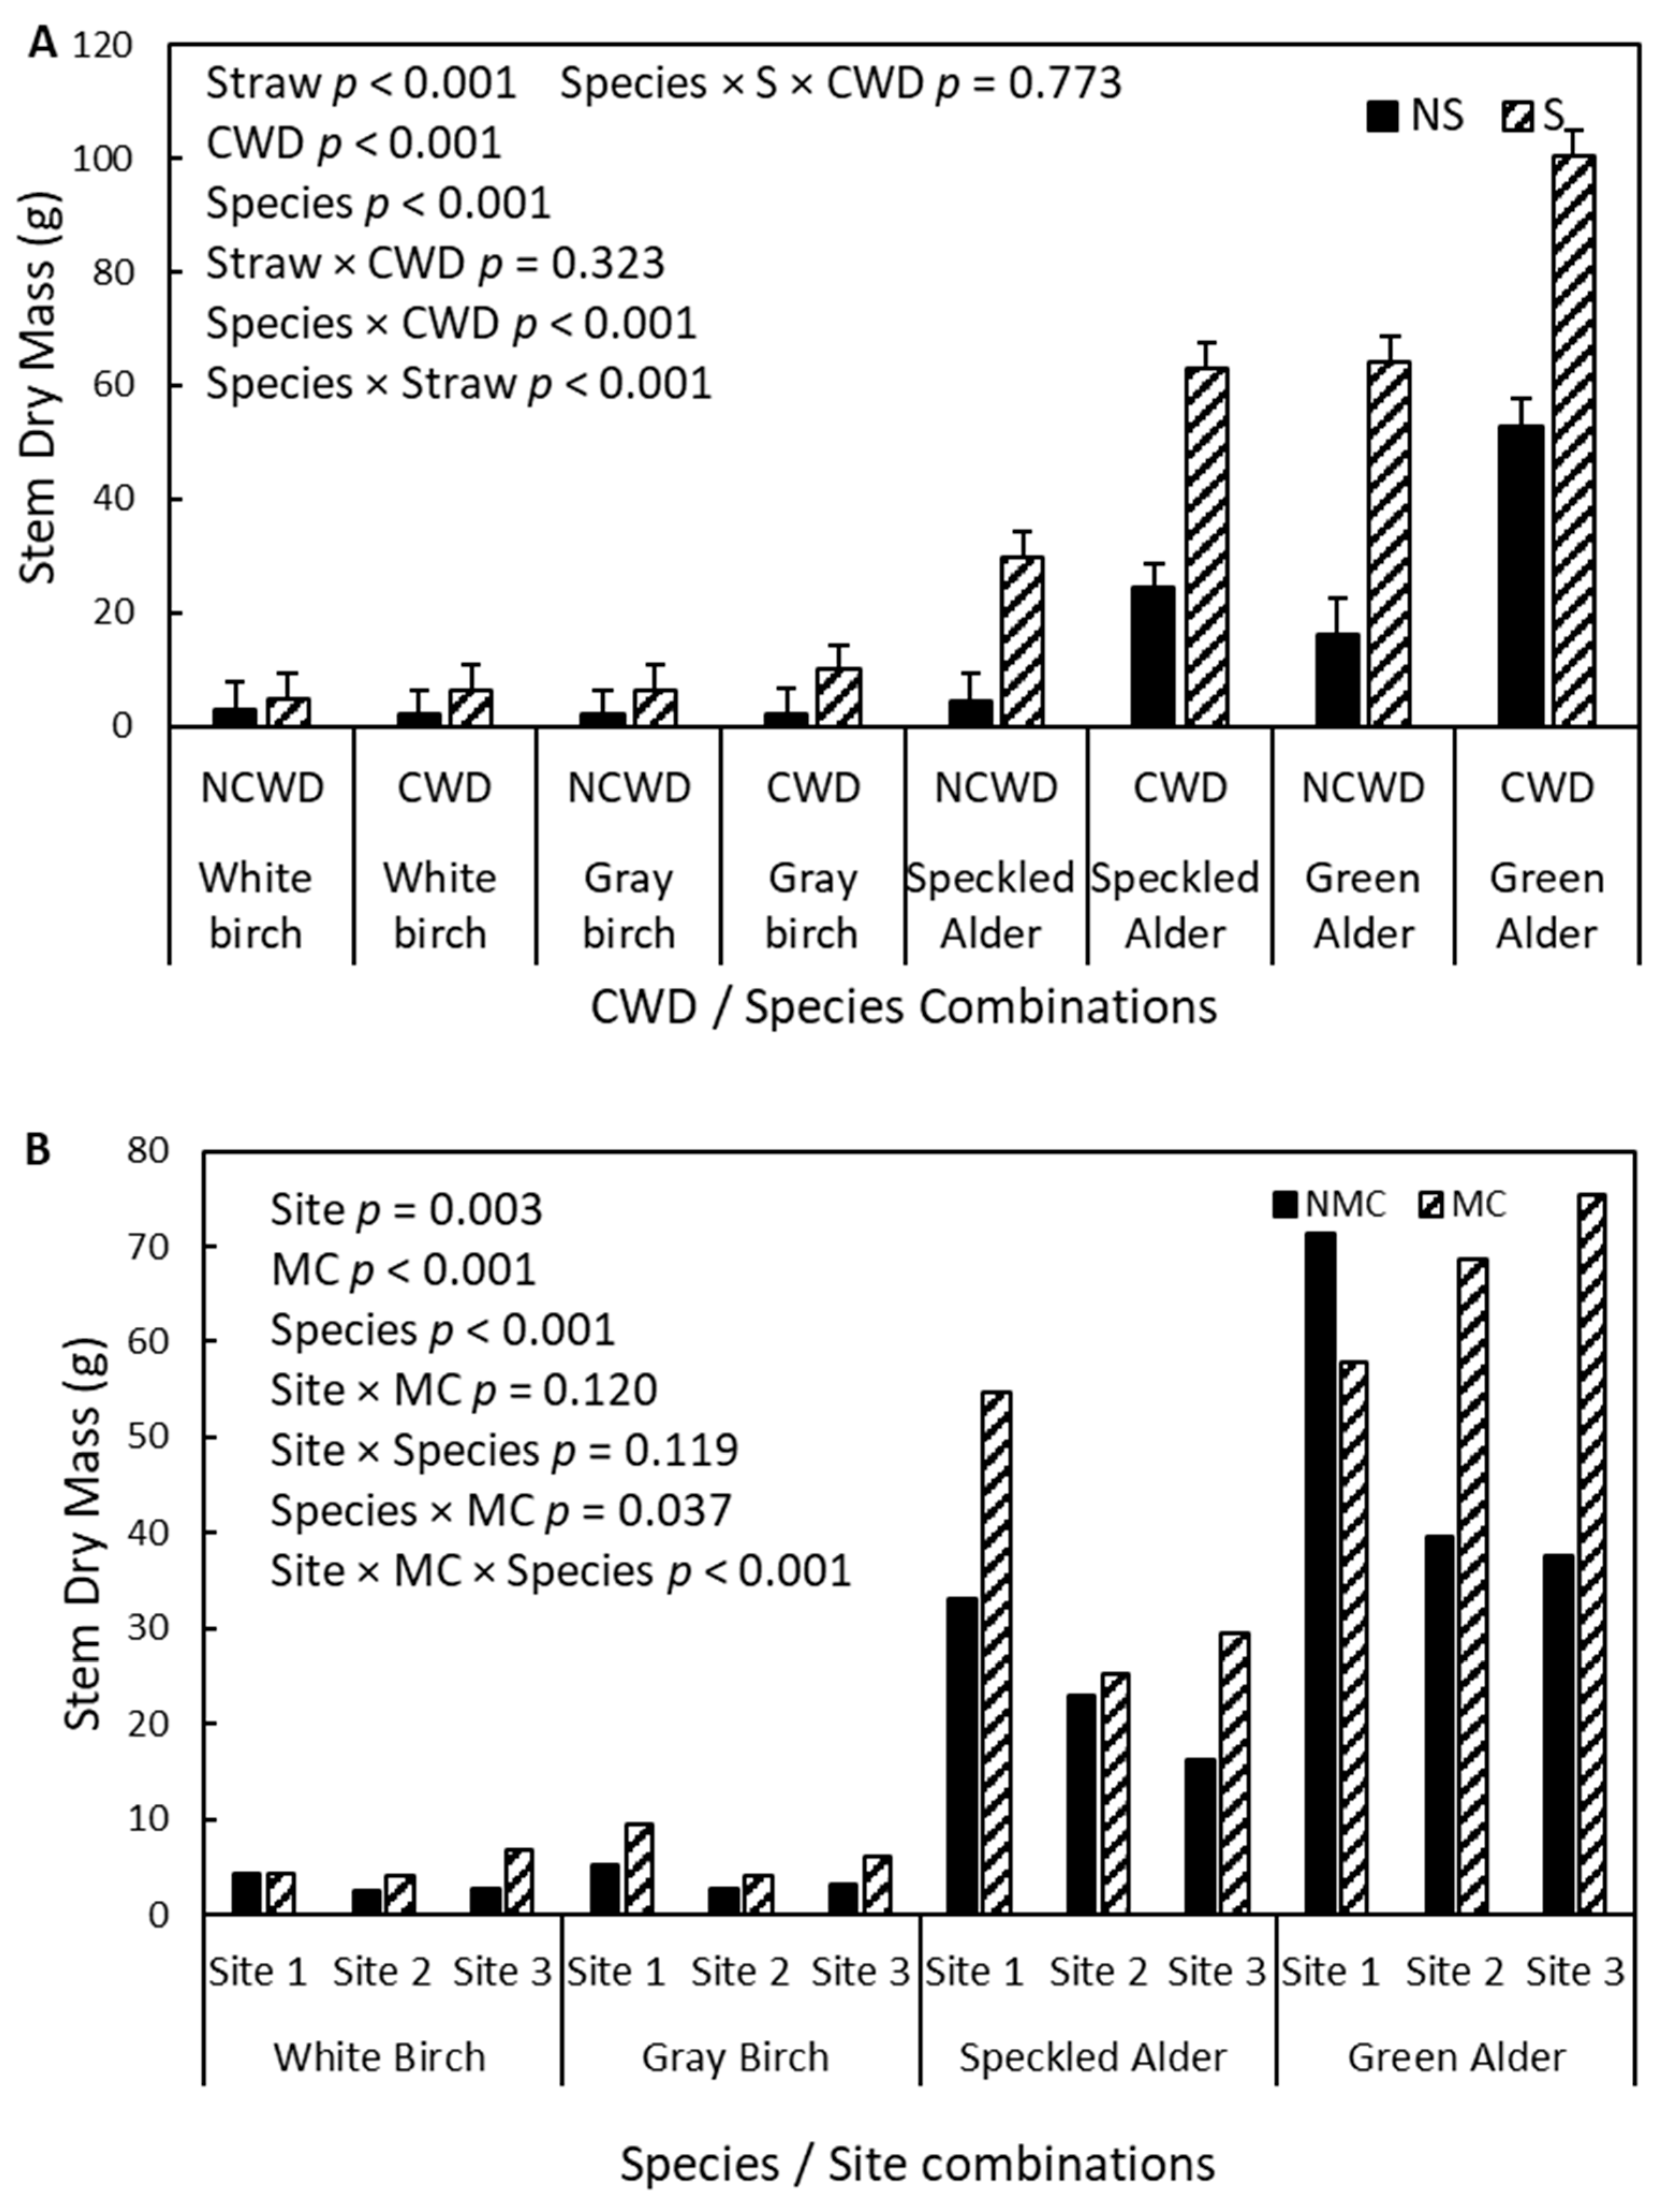
Figure 7.
Stem dry mass (mean ± SE) for each treatment combination including an expected line assuming single-treatment effects were additive for (A) white birch and (B) gray birch. Note that (A,B) have differing Y-axis scales. CRTL: control, no treatments, MC: Meri-Crusher, CWD: coarse woody debris, MCCWD: Meri-Crusher + coarse woody debris, S: straw, MCS: Meri-Crusher + straw, SCWD: straw + coarse woody debris, MCSCWD: Meri-Crusher + straw + coarse woody debris (n = 358).
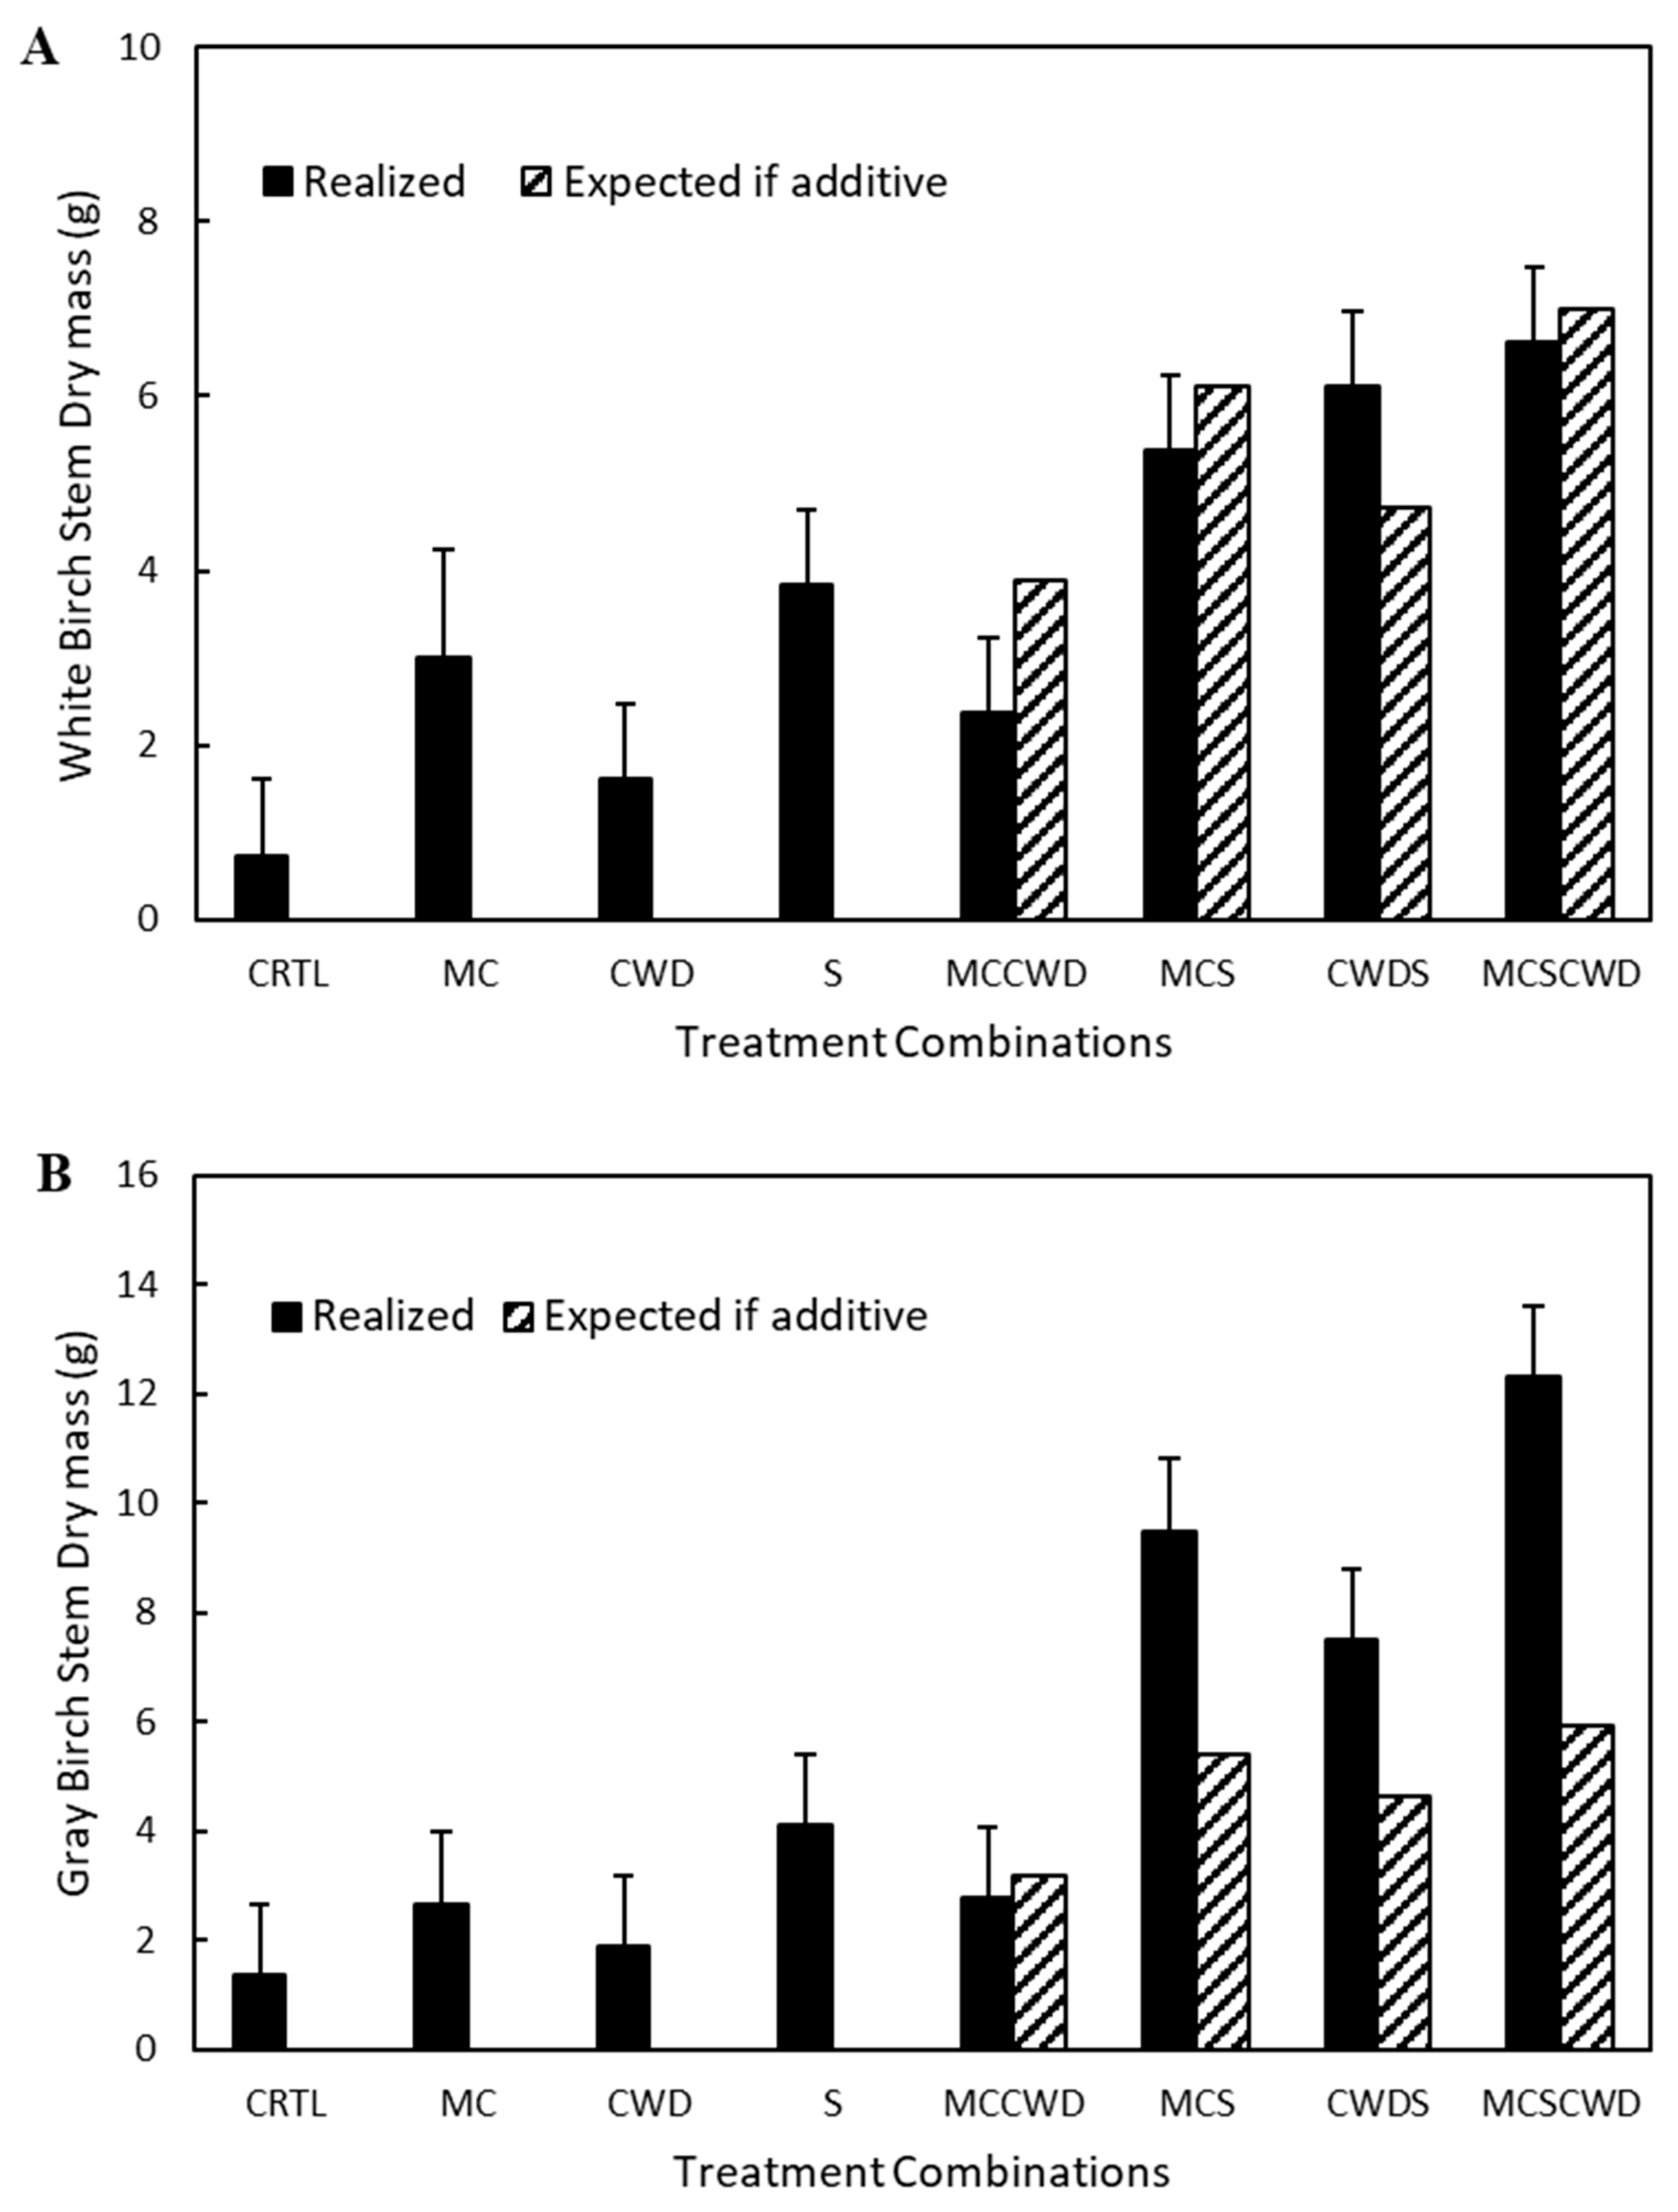
Figure 8.
Stem dry mass (mean ± SE) for each treatment combination including an expected line assuming single-treatment effects were additive for (A) green alder and (B) speckled alder. Note that (A,B) have differing Y-axis scales. CRTL: control, no treatments, MC: Meri-Crusher, CWD: coarse woody debris, MCCWD: Meri-Crusher + coarse woody debris, S: straw, MCS: Meri-Crusher + straw, SCWD: straw + coarse woody debris, MCSCWD: Meri-Crusher + straw + coarse woody debris (n = 358).
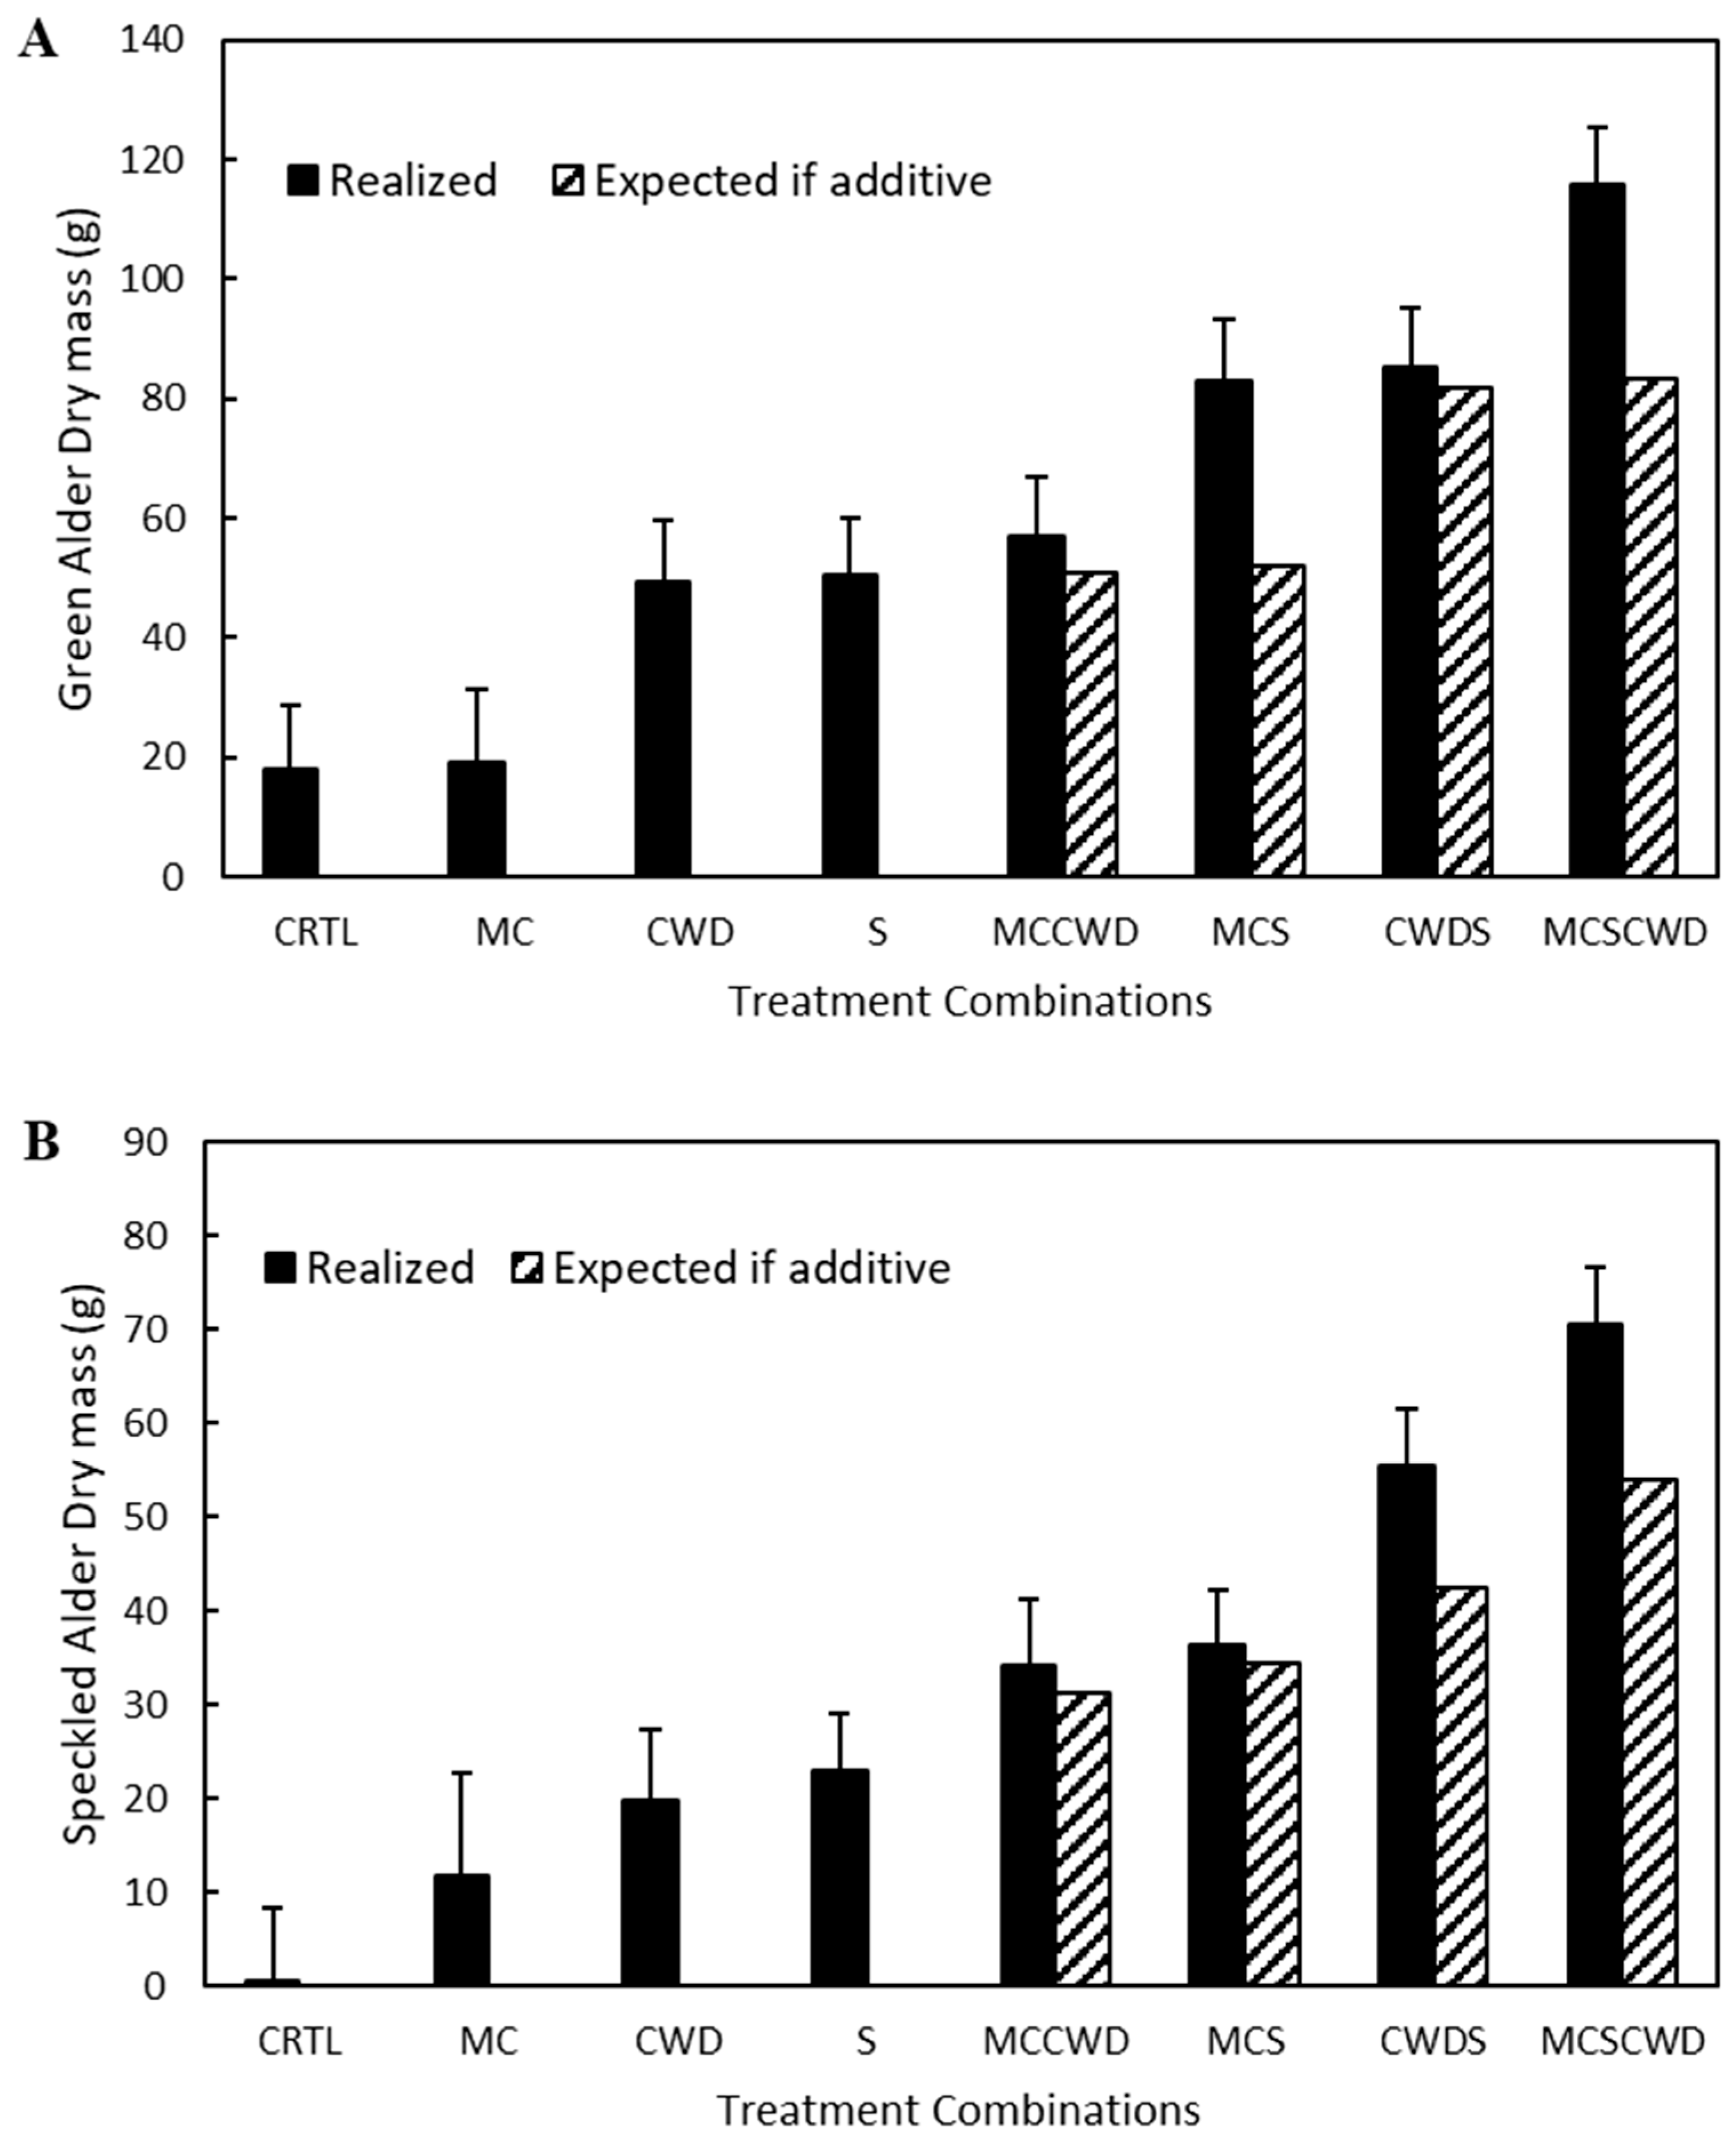
Table 1.
Species and provenance of seedling materials used in the experiments.
Table 1.
Species and provenance of seedling materials used in the experiments.
| Species | Source Year | Provenance | Country | Latitude (N) | Longitude (W) | Elevation (m) | |
|---|---|---|---|---|---|---|---|
| Betula papyrifera | White birch | 1998 | Wayeton, NB | CAN | 47.21667 | −65.93333 | 300 |
| Betula papyrifera | White birch | 1998 | Jewetts Creek, NB | CAN | 45.83333 | −66.98333 | 50 |
| Betula populifolia | Gray birch | 2008 | Newmarket, NB | CAN | 45.80501 | −66.95634 | 149 |
| Betula populifolia | Gray birch | 2008 | Newmarket, NB | CAN | 45.83147 | −66.97115 | 130 |
| Betula populifolia | Gray birch | 2008 | Newmarket, NB | CAN | 45.8076 | −66.96825 | 141 |
| Betula populifolia | Gray birch | 2008 | Newmarket, NB | CAN | 45.83486 | −66.96272 | 125 |
| Betula populifolia | Gray birch | 1999 | Bai-du-vin, NB | CAN | 47.03333 | −65.16666 | 5 |
| Alnus viridis subsp. crispa | Green alder | 2002 | West Quaco, NB | CAN | 45.33 | −65.53 | 65 |
| Alnus viridis subsp. crispa | Green alder | 1999 | Lower Prince William, NB | CAN | 45.87 | −67 | 20 |
| Alnus incana subsp. rugosa | Speckled alder | 1983 | Enmore, PEI | CAN | 46.58 | −64.05 | 10 |
| Alnus incana subsp. rugosa | Speckled alder | 1983 | Vallyfield, PEI | CAN | 46.13 | −62.72 | 45 |
| Alnus incana subsp. rugosa | Speckled alder | 1983 | Shediac, NB | CAN | 46.23 | −64.6 | 15 |
Table 2.
2022 soil properties for three experimental sites. Sites with different letters are significantly different at p = 0.050, (n = 96).
Table 2.
2022 soil properties for three experimental sites. Sites with different letters are significantly different at p = 0.050, (n = 96).
| ID | Organic Matter (%) | Total Nitrogen (%) | Carbon (%) | C:N Ratio | pH | Phosphorus (meq/100 g) | Potassium (meq/100 g) |
| Site 1 | 1.27 ± 0.91 a | 0.16 ± 0.03 a | 4.33 ± 2.15 a | 26.18 ± 9.14 b | 4.83 ± 0.11 b | 3.71 ± 1.91 a | 0.14 ± 0.08 a |
| Site 2 | 0.61 ± 0.33 b | 0.11 ± 0.02 b | 3.21 ± 1.61 b | 29.26 ± 14.13 b | 4.85 ± 0.13 ab | 2.54 ± 1.24 b | 0.13 ± 0.07 a |
| Site 3 | 0.63 ± 0.27 b | 0.08 ± 0.01 c | 4.65 ± 1.58 a | 60.54 ± 19.55 a | 4.92 ± 0.16 a | 3.73 ± 1.47 a | 0.11 ± 0.06 a |
| ID | Calcium (meq/100 g) | Magnesium (ppm) | Clay (%) | Silt (%) | Sand (%) | Rocks (%) | Average Depth (cm) |
| Site 1 | 0.34 ± 0.31 b | 0.18 ± 0.11 b | 16.19 ± 2.74 a | 42.38 ± 6.27 a | 41.66 ± 8.42 b | 31.75 ± 15.59 b | 31.93 ± 12.18 a |
| Site 2 | 0.94 ± 0.86 a | 0.35 ± 0.23 b | 12.97 ± 4.57 b | 34.22 ± 8.28 b | 52.75 ± 12.32 a | 39.88 ± 15.99 a | 11.64 ± 7.27 b |
| Site 3 | 1.73 ± 2.24 a | 0.66 ± 0.85 a | 12.09 ± 4.3 b | 28.88 ± 7.94 c | 59.16 ± 11.95 a | 50.06 ± 19.01 a | 14.94 ± 9.78 b |
Table 3.
Impacts of site-preparation treatments, species, and site effects and interactions on first-year growth. ANOVA table including degrees of freedom (df), mean square values (MS), variance components (VC), and p-values. p-values < 0.05 are in bold print. Source of variation abbreviations are Meri-Crusher (MC), straw (S), and coarse woody debris (CWD).
| First-Year Growth | ||||
|---|---|---|---|---|
| Source of Variation | df | MS | VC (%) | p-Value |
| MC | 1 | 2229.036 | 1.8 | <0.001 |
| S | 1 | 11,329.324 | 9.1 | <0.001 |
| CWD | 1 | 3766.011 | 3.0 | <0.001 |
| SITE | 2 | 2312.886 | 3.7 | <0.001 |
| SPECIES | 3 | 2616.067 | 6.3 | <0.001 |
| BLOCK(SITE) | 9 | 461.287 | 3.3 | <0.001 |
| S × MC | 1 | 124.613 | 0.1 | 0.151 |
| CWD × MC | 1 | 27.561 | 0.0 | 0.499 |
| SITE × MC | 2 | 840.471 | 1.3 | <0.001 |
| SPECIES × MC | 3 | 37.453 | 0.1 | 0.602 |
| CWD × S | 1 | 0.012 | 0.0 | 0.989 |
| SPECIES × S | 3 | 504.543 | 1.2 | <0.001 |
| SITE × S | 2 | 29.887 | 0.0 | 0.610 |
| SPECIES × CWD | 3 | 217.799 | 0.5 | 0.013 |
| SITE × CWD | 2 | 214.289 | 0.3 | 0.029 |
| SITE × SPECIES | 6 | 76.581 | 0.4 | 0.269 |
| CWD × S × MC | 1 | 11.183 | 0.0 | 0.667 |
| SPECIES × S × MC | 3 | 47.021 | 0.1 | 0.506 |
| SITE × S × MC | 2 | 151.289 | 0.2 | 0.082 |
| SPECIES × CWD × MC | 3 | 78.941 | 0.2 | 0.271 |
| SITE × CWD × MC | 2 | 195.077 | 0.3 | 0.040 |
| SITE × SPECIES × MC | 6 | 42.277 | 0.2 | 0.650 |
| SPECIES × CWD × S | 3 | 100.517 | 0.2 | 0.173 |
| SITE × CWD × S | 2 | 740.767 | 1.2 | <0.001 |
| SITE × SPECIES × S | 6 | 143.817 | 0.7 | 0.037 |
| SITE × SPECIES × CWD | 6 | 63.679 | 0.3 | 0.388 |
| Error | 1347 | 60.386 | 65.2 | |
| R2 | 0.59 | |||
Table 4.
Impacts of site-preparation treatments, species, and site effects and interactions on second-year growth. ANOVA table including degrees of freedom (df), mean square values (MS), variance components (VC), and p-values. p-values < 0.05 are in bold print. Source of variation abbreviations are Meri-Crusher (MC), straw (S), and coarse woody debris (CWD).
| Second-Year Growth | ||||
|---|---|---|---|---|
| Source of Variation | df | MS | VC (%) | p-Value |
| MC | 1 | 7523.429 | 1.4 | <0.001 |
| S | 1 | 42,715.569 | 8.2 | <0.001 |
| CWD | 1 | 38,554.355 | 7.4 | <0.001 |
| SITE | 2 | 4746.407 | 1.8 | <0.001 |
| SPECIES | 3 | 58,212.778 | 33.5 | <0.001 |
| BLOCK(SITE) | 9 | 439.142 | 0.8 | 0.012 |
| S × MC | 1 | 33.568 | 0.0 | 0.671 |
| CWD × MC | 1 | 477.750 | 0.1 | 0.109 |
| SITE × MC | 2 | 495.616 | 0.2 | 0.069 |
| SPECIES × MC | 3 | 582.258 | 0.3 | 0.025 |
| CWD × S | 1 | 39.746 | 0.0 | 0.643 |
| SPECIES × S | 3 | 1420.096 | 0.8 | <0.001 |
| SITE × S | 2 | 345.167 | 0.1 | 0.156 |
| SPECIES × CWD | 3 | 3966.841 | 2.3 | <0.001 |
| SITE × CWD | 2 | 620.287 | 0.2 | 0.036 |
| SITE × SPECIES | 6 | 453.808 | 0.5 | 0.023 |
| CWD × S × MC | 1 | 55.890 | 0.0 | 0.583 |
| SPECIES × S × MC | 3 | 504.243 | 0.3 | 0.043 |
| SITE × S × MC | 2 | 28.388 | 0.0 | 0.858 |
| SPECIES × CWD × MC | 3 | 36.562 | 0.0 | 0.898 |
| SITE × CWD × MC | 2 | 279.602 | 0.1 | 0.222 |
| SITE × SPECIES × MC | 6 | 292.118 | 0.3 | 0.151 |
| SPECIES × CWD × S | 3 | 939.252 | 0.5 | 0.002 |
| SITE × CWD × S | 2 | 583.284 | 0.2 | 0.043 |
| SITE × SPECIES × S | 6 | 183.842 | 0.2 | 0.490 |
| SITE × SPECIES × CWD | 6 | 31.091 | 0.0 | 0.985 |
| Error | 1140 | 185.361 | 40.5 | |
| R2 | 0.80 | |||
Table 5.
Impacts of site-preparation treatments, species, and site effects and interactions on stem number. ANOVA table including degrees of freedom (df), mean square values (MS), variance components (VC), and p-values. p-values < 0.05 are in bold print. Source of variation abbreviations are Meri-Crusher (MC), straw (S), and coarse woody debris (CWD).
| Stem Number * | ||||
|---|---|---|---|---|
| Source of Variation | df | MS | VC (%) | p-Value |
| MC | 1 | 1.078 | 0.0 | 0.333 |
| S | 1 | 19.094 | 0.7 | <0.001 |
| CWD | 1 | 12.409 | 0.5 | 0.001 |
| SITE | 2 | 0.571 | 0.0 | 0.608 |
| SPECIES | 3 | 365.217 | 42.0 | <0.001 |
| BLOCK(SITE) | 9 | 1.184 | 0.4 | 0.413 |
| S × MC | 1 | <0.001 | 0.0 | 0.990 |
| CWD × MC | 1 | 11.625 | 0.4 | 0.002 |
| SITE × MC | 2 | 1.416 | 0.1 | 0.292 |
| SPECIES × MC | 3 | 0.210 | 0.0 | 0.908 |
| CWD × S | 1 | 6.506 | 0.2 | 0.018 |
| SPECIES × S | 3 | 10.181 | 1.2 | <0.001 |
| SITE × S | 2 | 0.596 | 0.0 | 0.596 |
| SPECIES × CWD | 3 | 6.382 | 0.7 | 0.001 |
| SITE × CWD | 2 | 0.666 | 0.1 | 0.561 |
| SITE × SPECIES | 6 | 0.334 | 0.1 | 0.942 |
| CWD × S × MC | 1 | 1.285 | 0.0 | 0.291 |
| SPECIES × S × MC | 3 | 0.615 | 0.1 | 0.658 |
| SITE × S × MC | 2 | 5.712 | 0.4 | 0.007 |
| SPECIES × CWD × MC | 3 | 8.182 | 0.9 | <0.001 |
| SITE × CWD × MC | 2 | 3.824 | 0.3 | 0.036 |
| SITE × SPECIES × MC | 6 | 1.118 | 0.3 | 0.442 |
| SPECIES × CWD × S | 3 | 5.314 | 0.6 | 0.003 |
| SITE × CWD × S | 2 | 2.841 | 0.2 | 0.085 |
| SITE × SPECIES × CWD | 6 | 0.504 | 0.1 | 0.854 |
| SITE × SPECIES × S | 6 | 0.904 | 0.2 | 0.620 |
| Error | 1140 | 1.149 | 50.2 | |
| R2 | 0.80 | |||
Table 6.
Impacts of site-preparation treatments, species, and site effects and interactions on stem dry mass. ANOVA table including degrees of freedom (df), mean square values (MS), variance components (VC), and p-values. p-values < 0.05 are in bold print. Source of variation abbreviations are Meri-Crusher (MC), straw (S), and coarse woody debris (CWD).
| Stem Dry Mass | ||||
|---|---|---|---|---|
| Source of Variation | df | MS | VC (%) | p-Value |
| MC | 1 | 6402.516 | 1.3 | <0.001 |
| S | 1 | 41,532.943 | 8.6 | <0.001 |
| CWD | 1 | 22,465.595 | 4.7 | <0.001 |
| SITE | 2 | 2758.520 | 1.1 | 0.003 |
| SPECIES | 3 | 58,811.420 | 36.6 | <0.001 |
| BLOCK(SITE) | 9 | 1185.972 | 2.2 | 0.007 |
| S × MC | 1 | 1054.536 | 0.2 | 0.130 |
| CWD × MC | 1 | 76.506 | 0.0 | 0.683 |
| SITE × MC | 2 | 975.820 | 0.4 | 0.120 |
| SPECIES × MC | 3 | 1309.781 | 0.8 | 0.037 |
| CWD × S | 1 | 447.437 | 0.1 | 0.323 |
| SPECIES × S | 3 | 10,179.717 | 6.3 | <0.001 |
| SITE × S | 2 | 1278.509 | 0.5 | 0.063 |
| SPECIES × CWD | 3 | 7142.417 | 4.4 | <0.001 |
| SITE × CWD | 2 | 50.165 | 0.0 | 0.896 |
| SITE × SPECIES | 6 | 780.715 | 1.0 | 0.119 |
| CWD × S × MC | 1 | 23.304 | 0.0 | 0.822 |
| SPECIES × S × MC | 3 | 600.204 | 0.4 | 0.270 |
| SITE × S × MC | 2 | 152.089 | 0.1 | 0.717 |
| SPECIES × CWD × MC | 3 | 84.651 | 0.1 | 0.906 |
| SITE × CWD × MC | 2 | 28.424 | 0.0 | 0.940 |
| SITE × SPECIES × MC | 6 | 1757.219 | 2.2 | 0.001 |
| SPECIES × CWD × S | 3 | 170.518 | 0.1 | 0.773 |
| SITE × CWD × S | 2 | 435.551 | 0.2 | 0.387 |
| SITE × SPECIES × CWD | 6 | 141.620 | 0.2 | 0.932 |
| SITE × SPECIES × S | 6 | 937.691 | 1.2 | 0.180 |
| Error | 288 | 457.215 | 27.3 | |
| R2 | 0.74 | |||