Evaluation and Error Analysis of Multi-Source Precipitation Datasets during Summer over the Tibetan Plateau
Figure 1.
Geographic locations of the 247 CMA meteorological stations (133 original stations and 114 new stations added post-2016) and 10 rain gauge stations across the TP.
Figure 1.
Geographic locations of the 247 CMA meteorological stations (133 original stations and 114 new stations added post-2016) and 10 rain gauge stations across the TP.
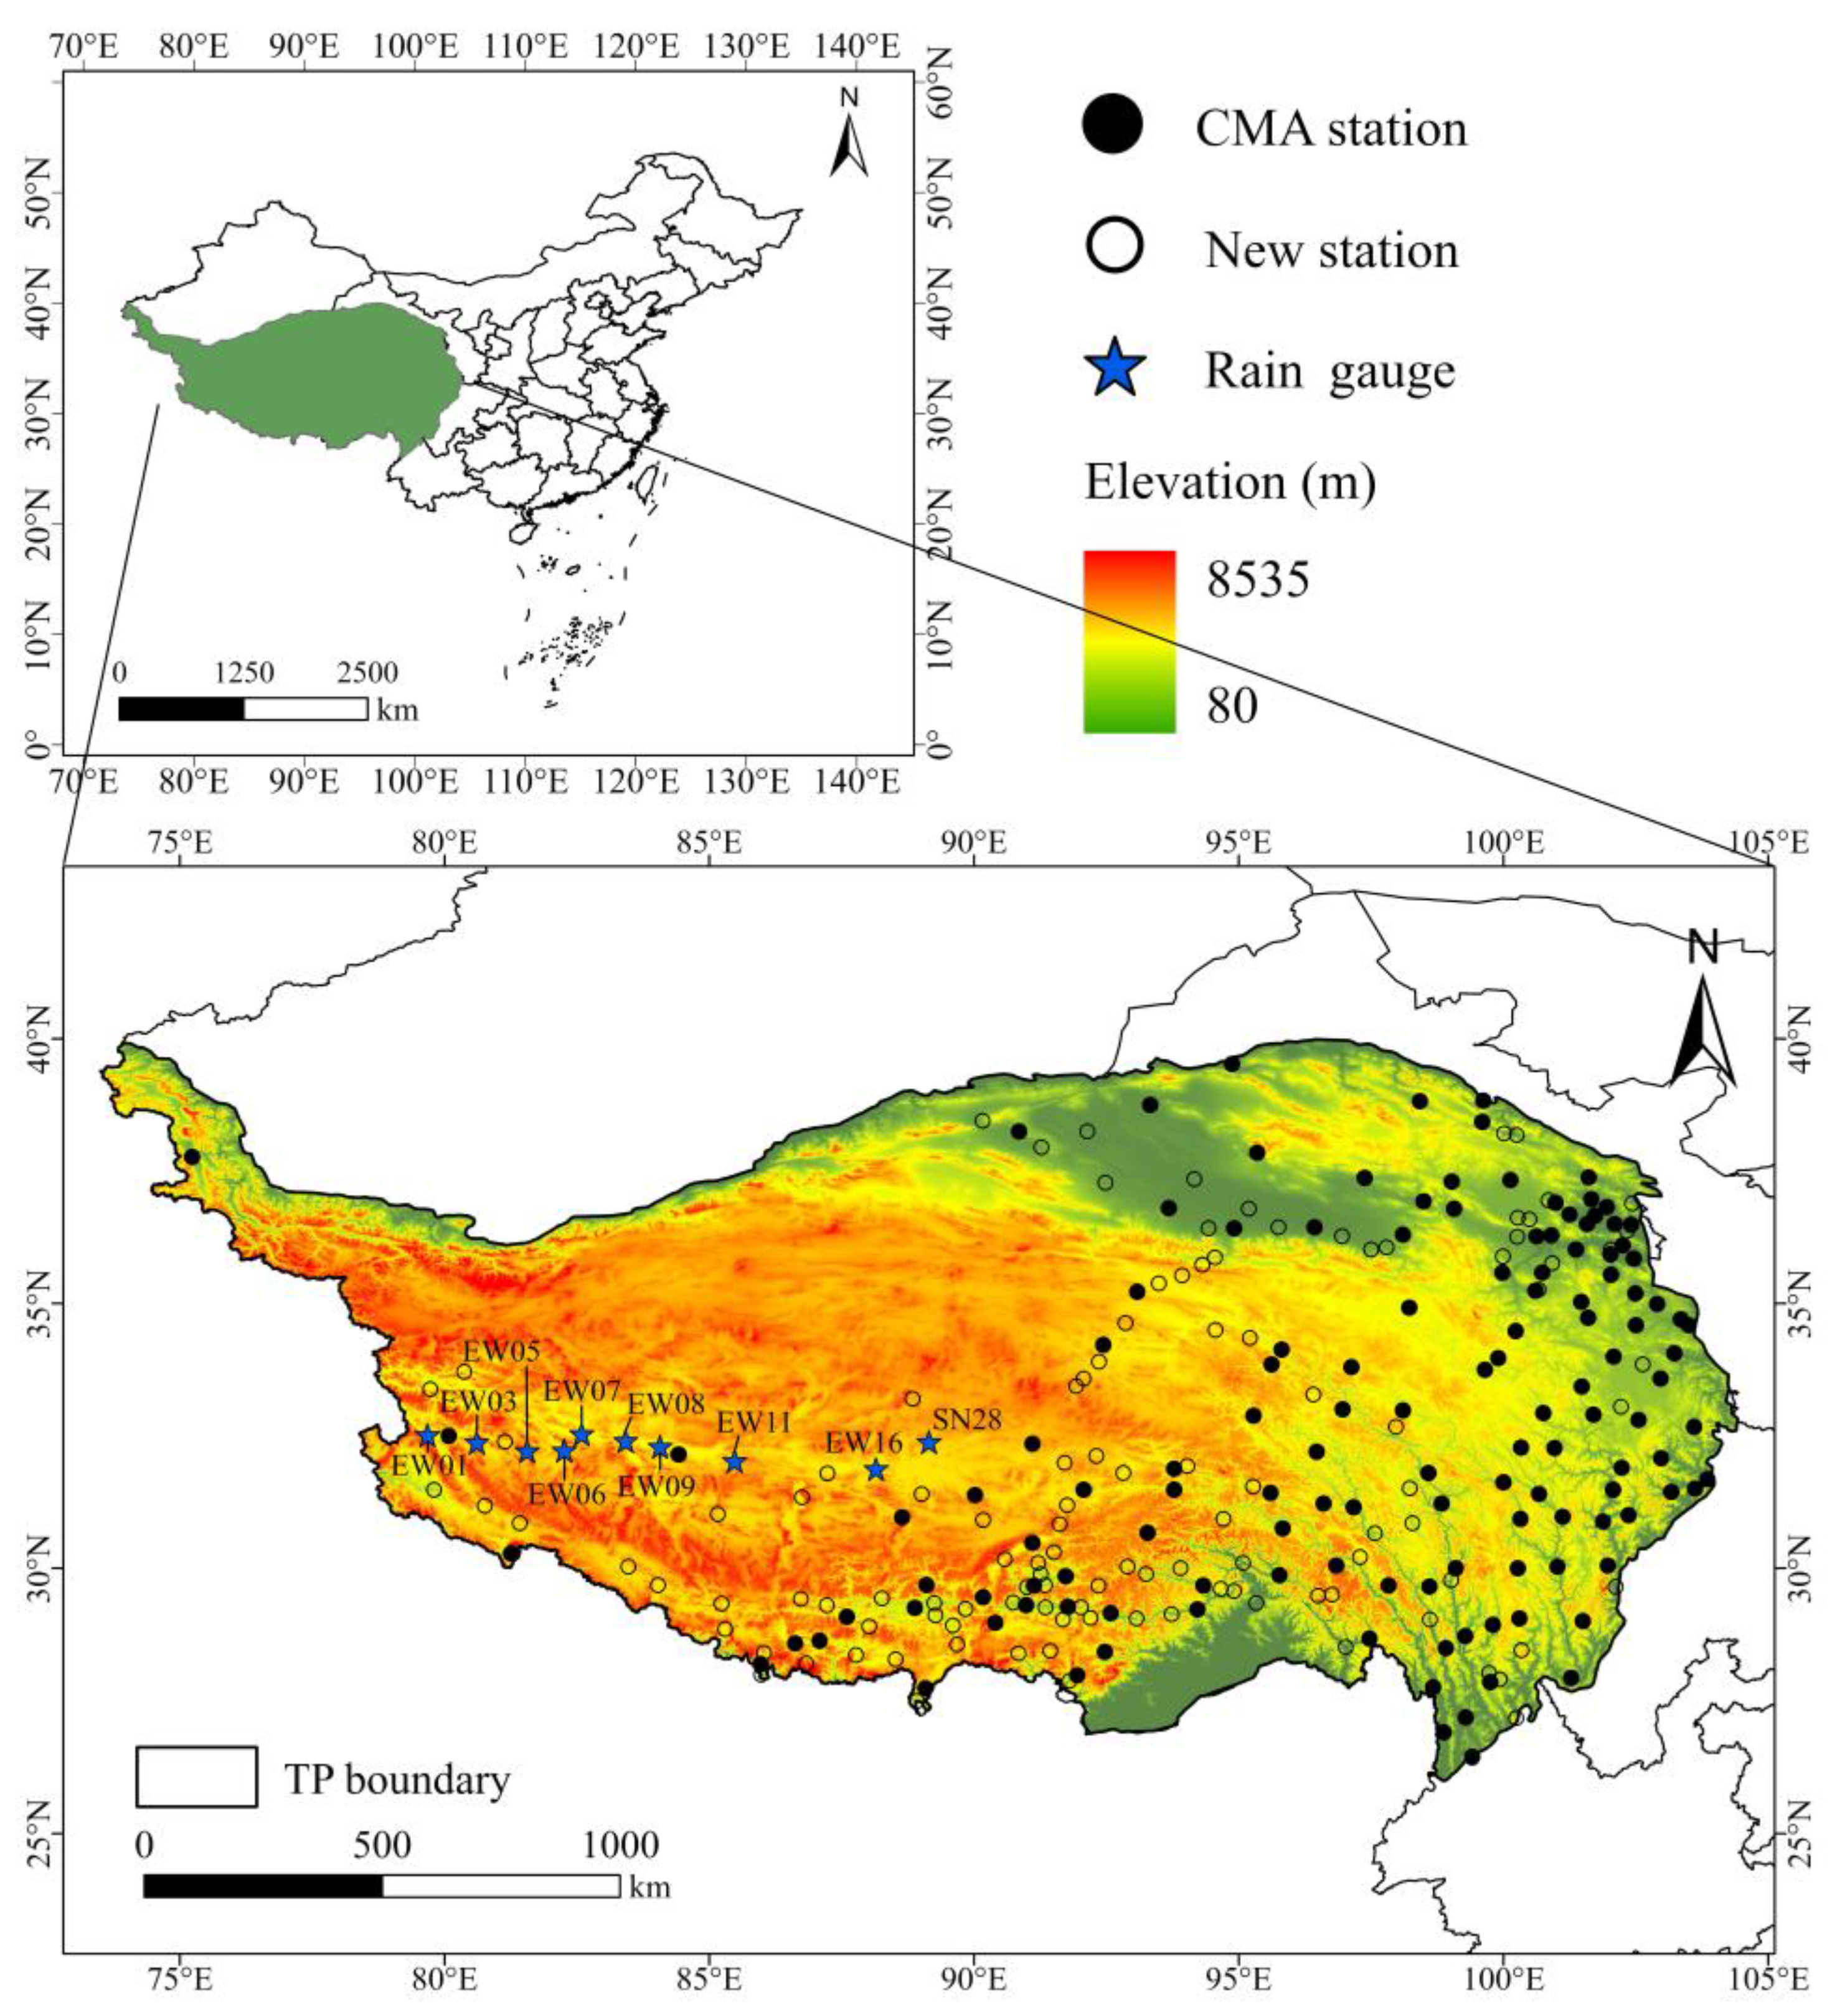
Figure 2.
Research flowchart.
Figure 2.
Research flowchart.
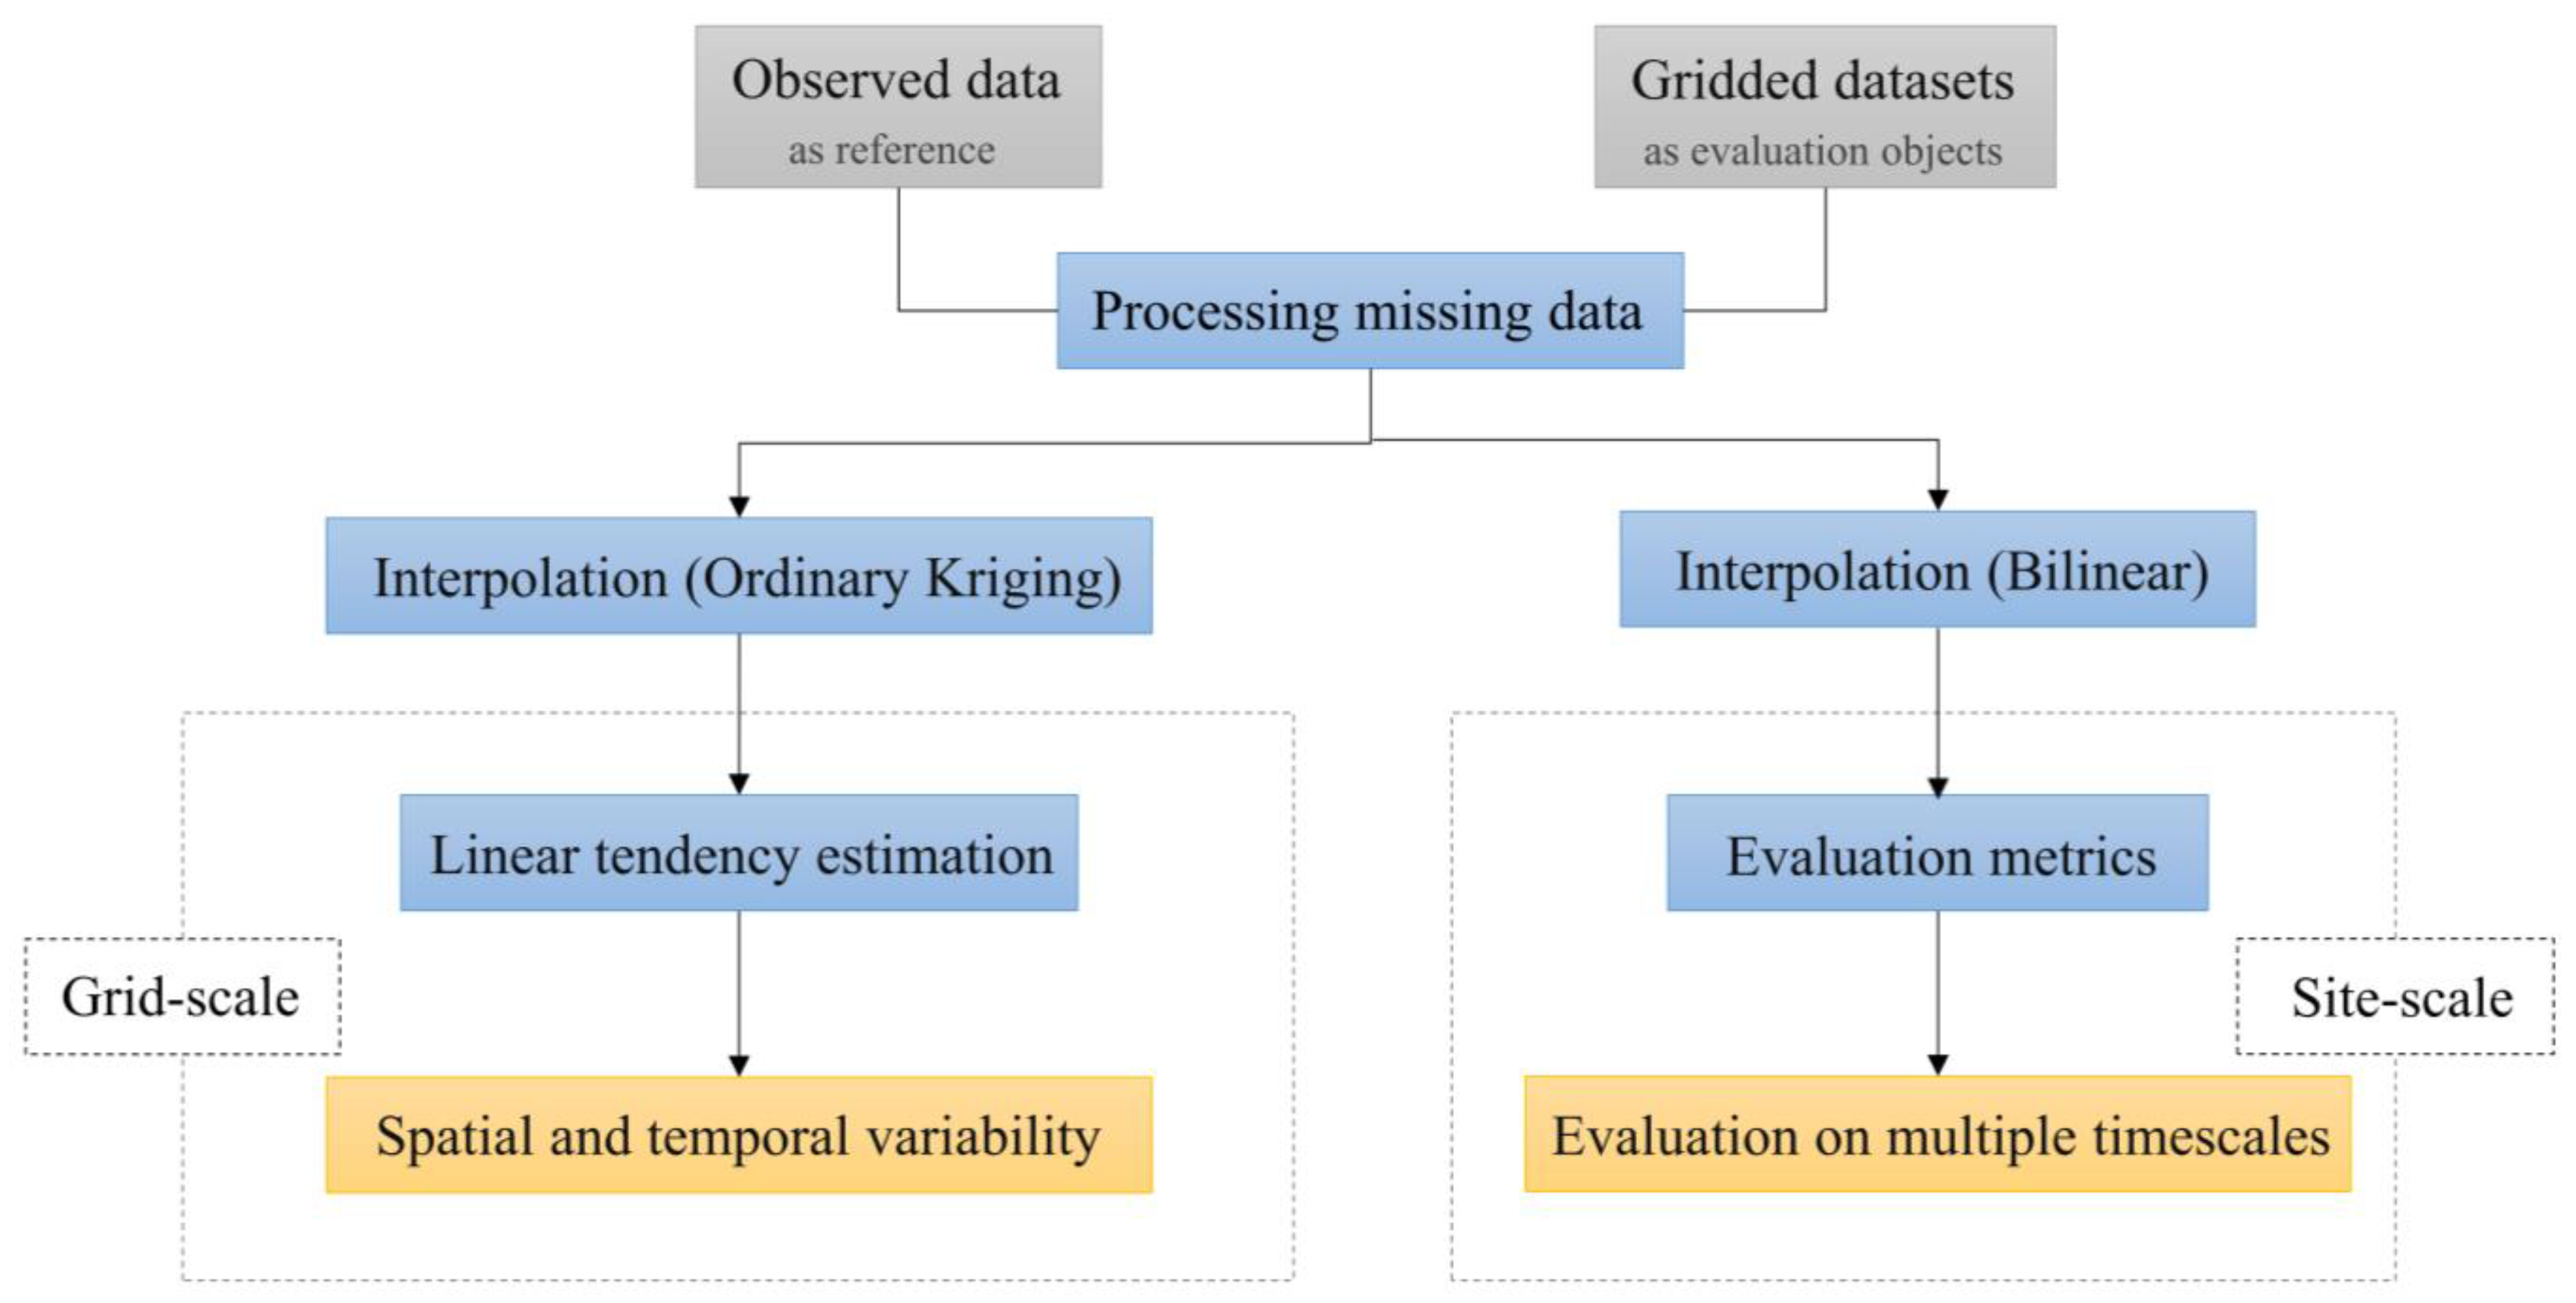
Figure 3.
Spatial pattern of mean annual summer precipitation based on the (a) 133 station observations, (b) CMFD, (c) ERA5-Land, and (d) IMERG during 2000–2018 on the TP.
Figure 3.
Spatial pattern of mean annual summer precipitation based on the (a) 133 station observations, (b) CMFD, (c) ERA5-Land, and (d) IMERG during 2000–2018 on the TP.
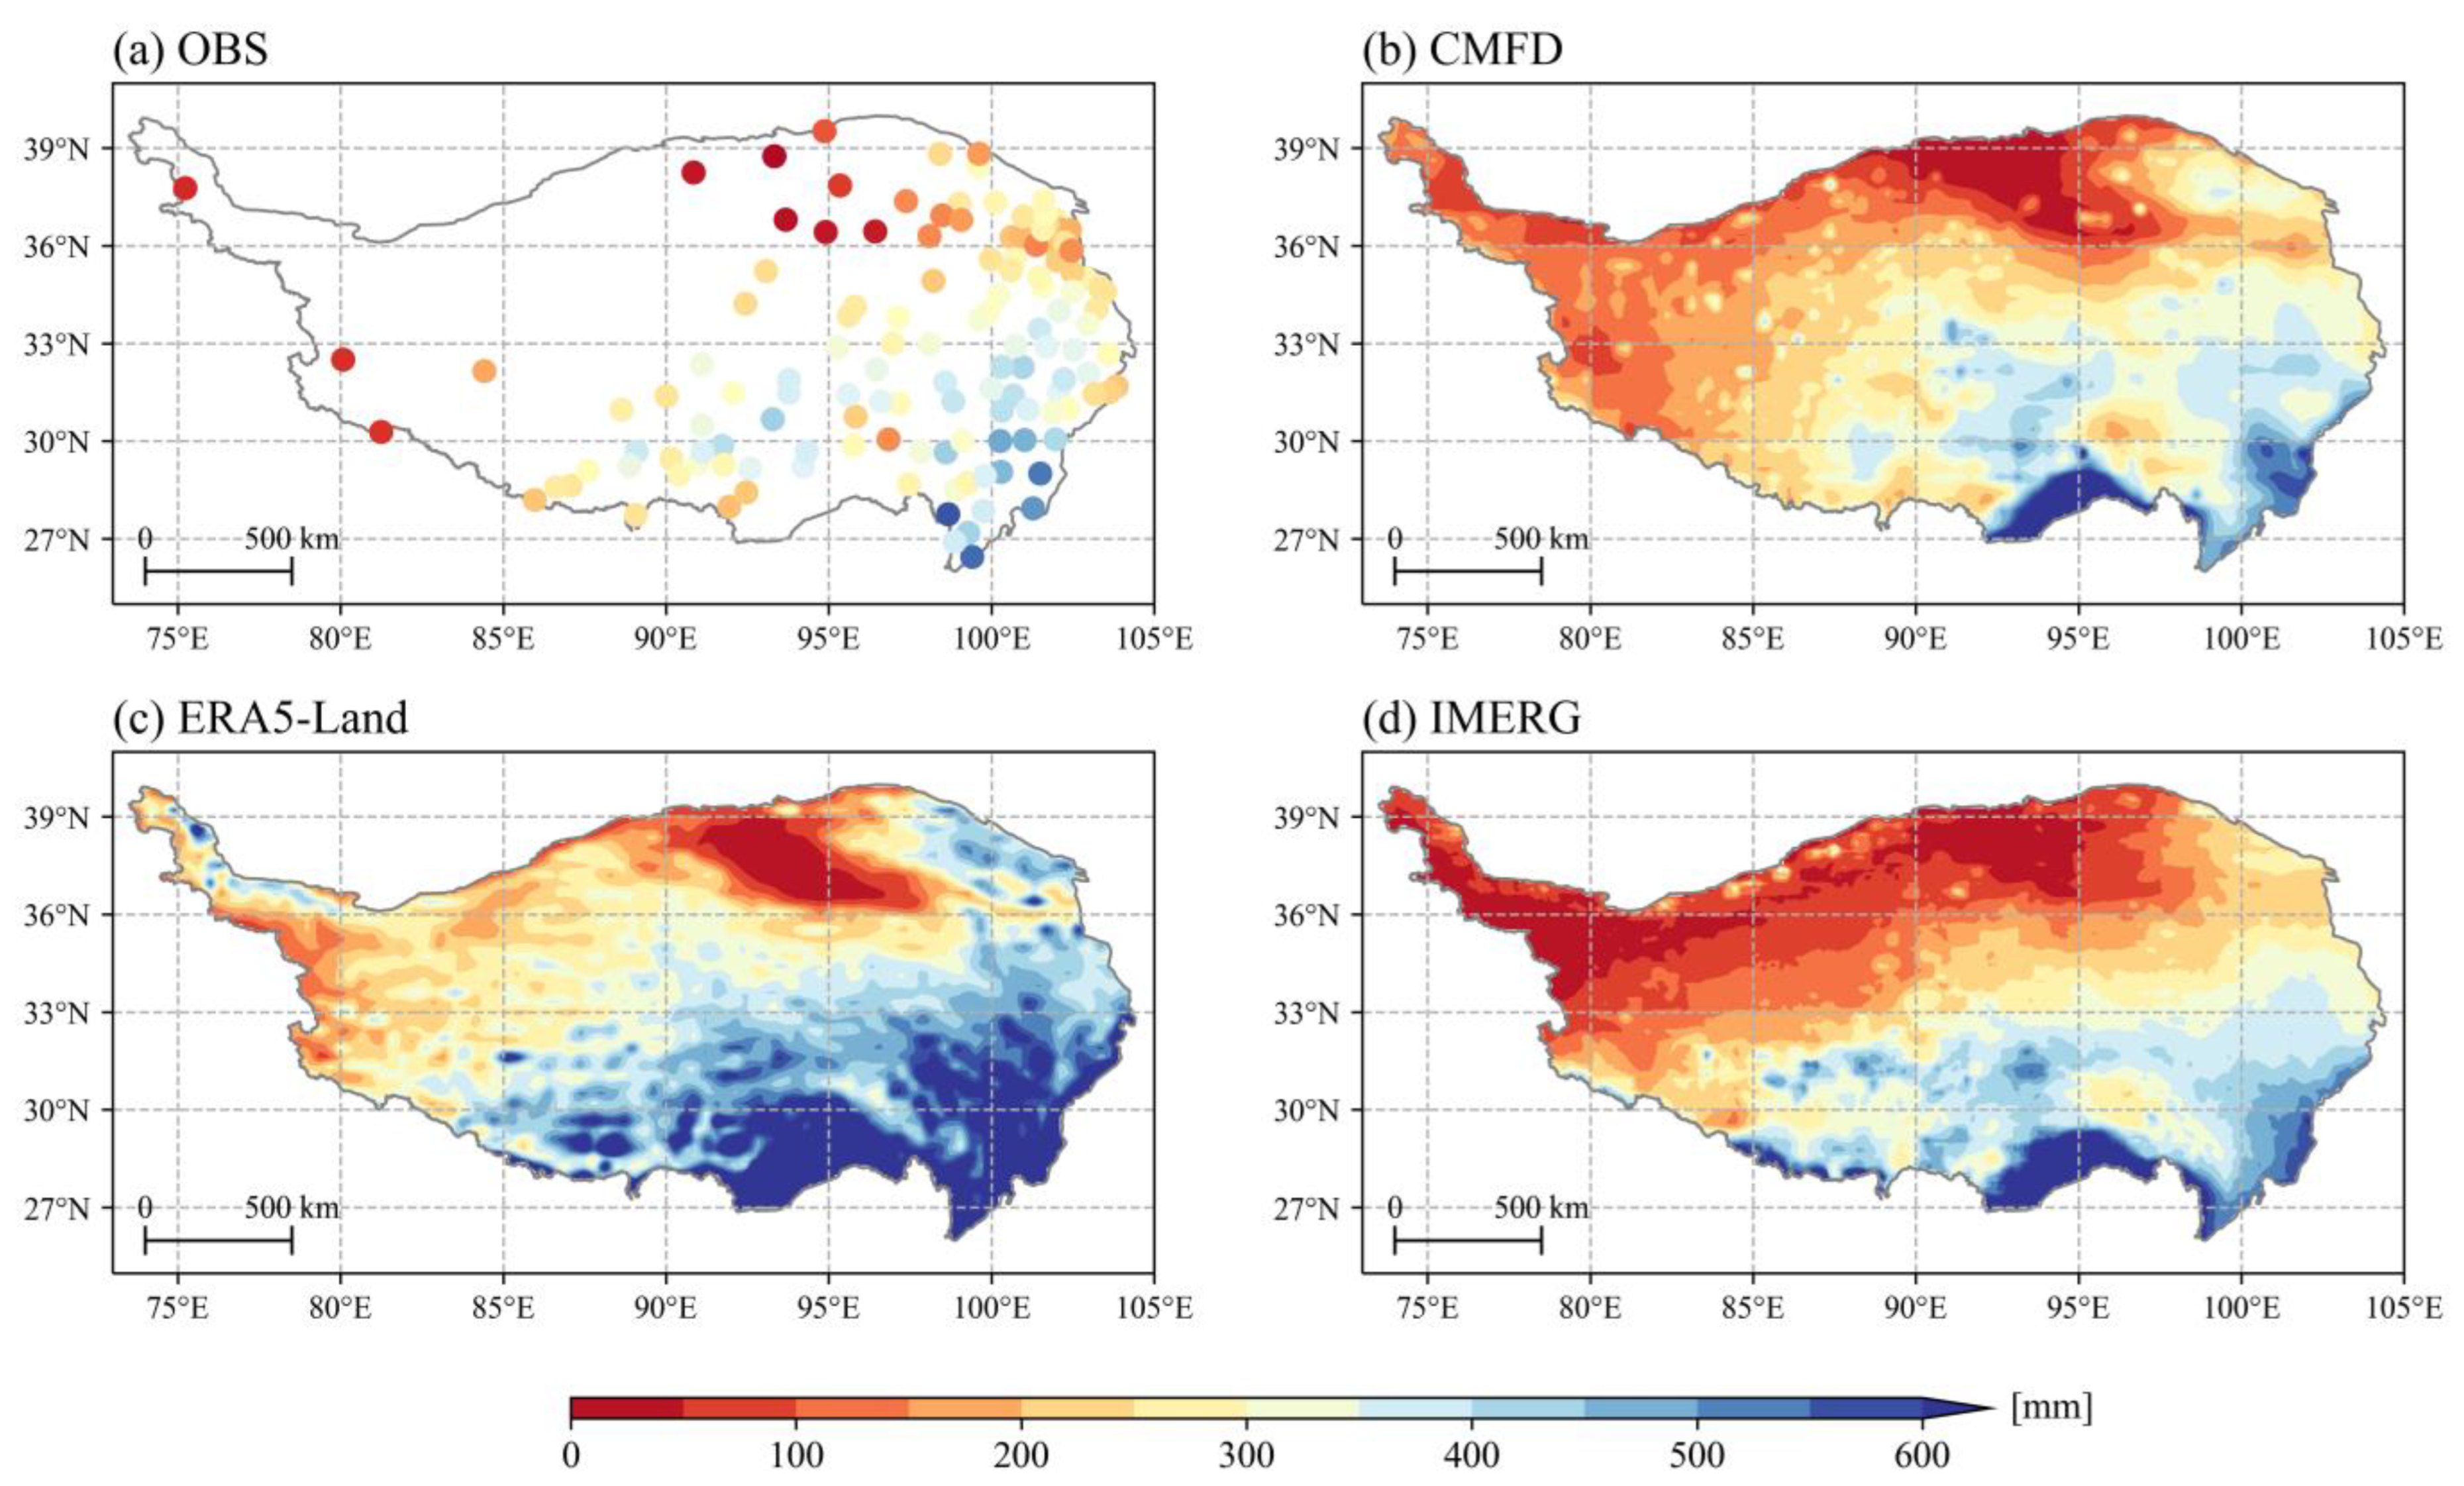
Figure 4.
Spatial pattern of the difference between the (a) CMFD, (b) ERA5-Land, and (c) IMERG gridded precipitation products and the observed precipitation during the summers of 2000–2018 on the TP.
Figure 4.
Spatial pattern of the difference between the (a) CMFD, (b) ERA5-Land, and (c) IMERG gridded precipitation products and the observed precipitation during the summers of 2000–2018 on the TP.
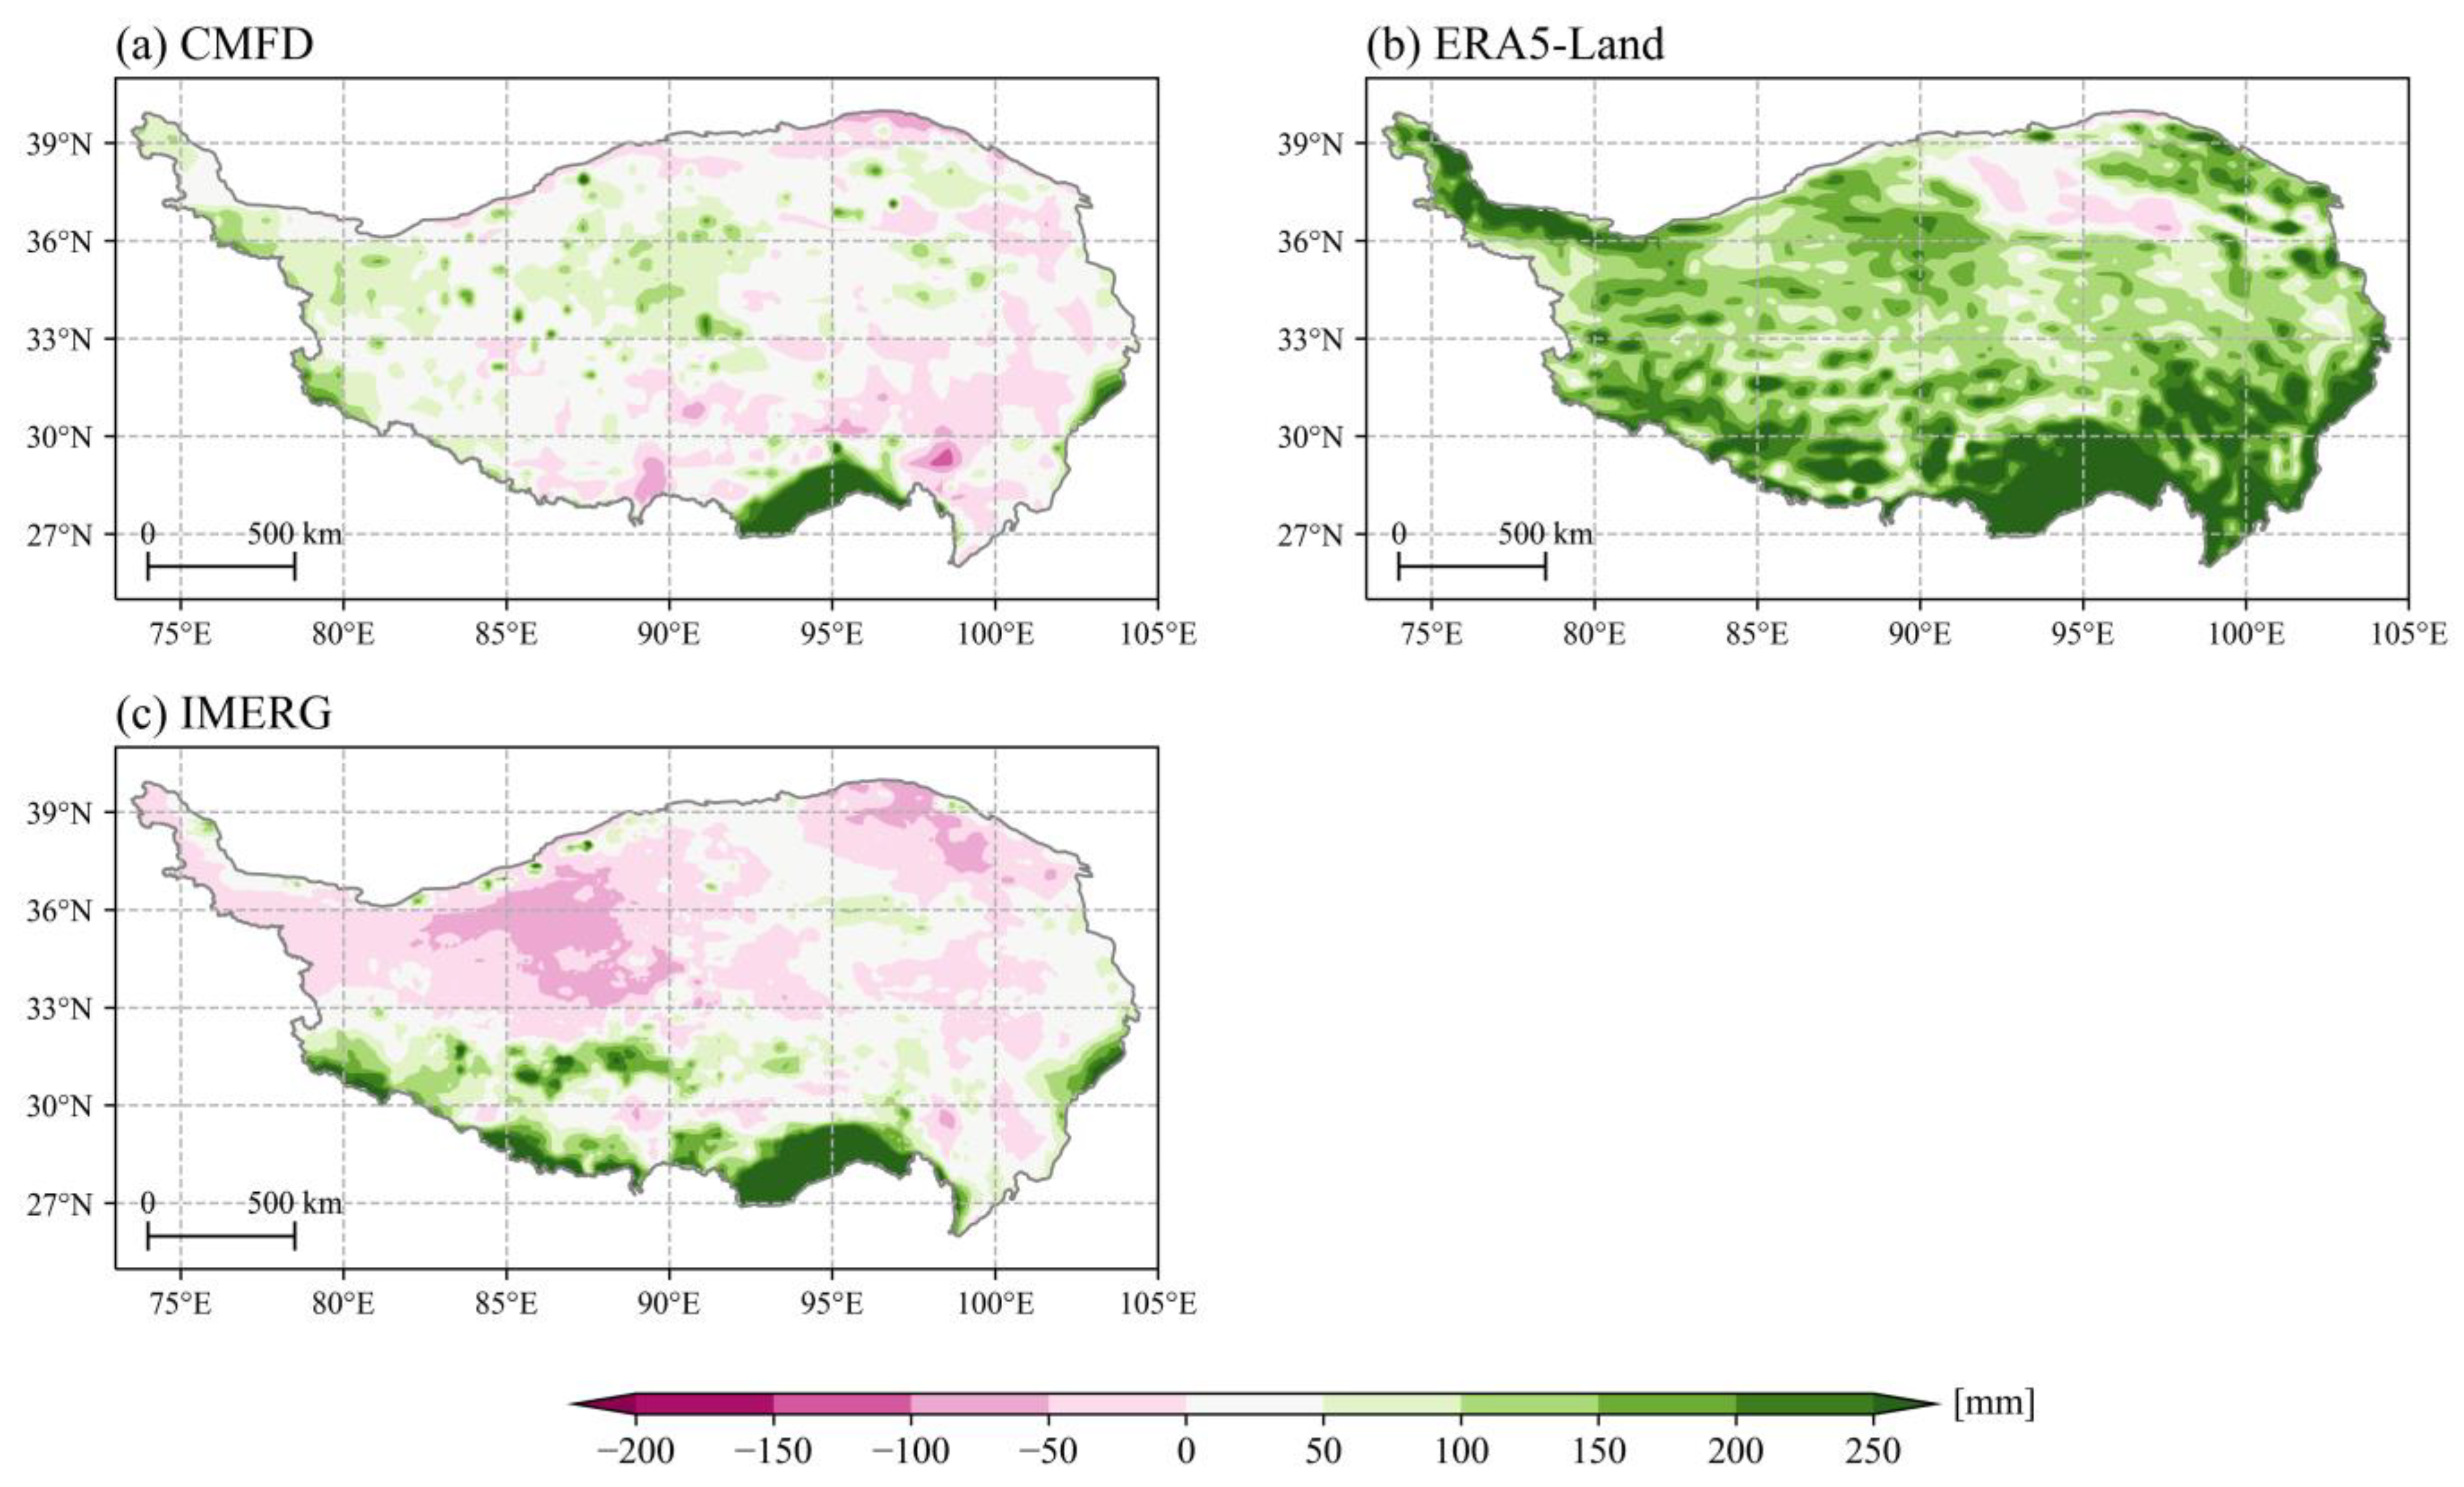
Figure 5.
Spatial pattern of summer precipitation trends based on the (a) interpolation of 133 station observations, (b) CMFD, (c) ERA5-Land, and (d) IMERG during 2000–2018 on the TP (the significant values at 95 % confidence level are represented by black dots).
Figure 5.
Spatial pattern of summer precipitation trends based on the (a) interpolation of 133 station observations, (b) CMFD, (c) ERA5-Land, and (d) IMERG during 2000–2018 on the TP (the significant values at 95 % confidence level are represented by black dots).
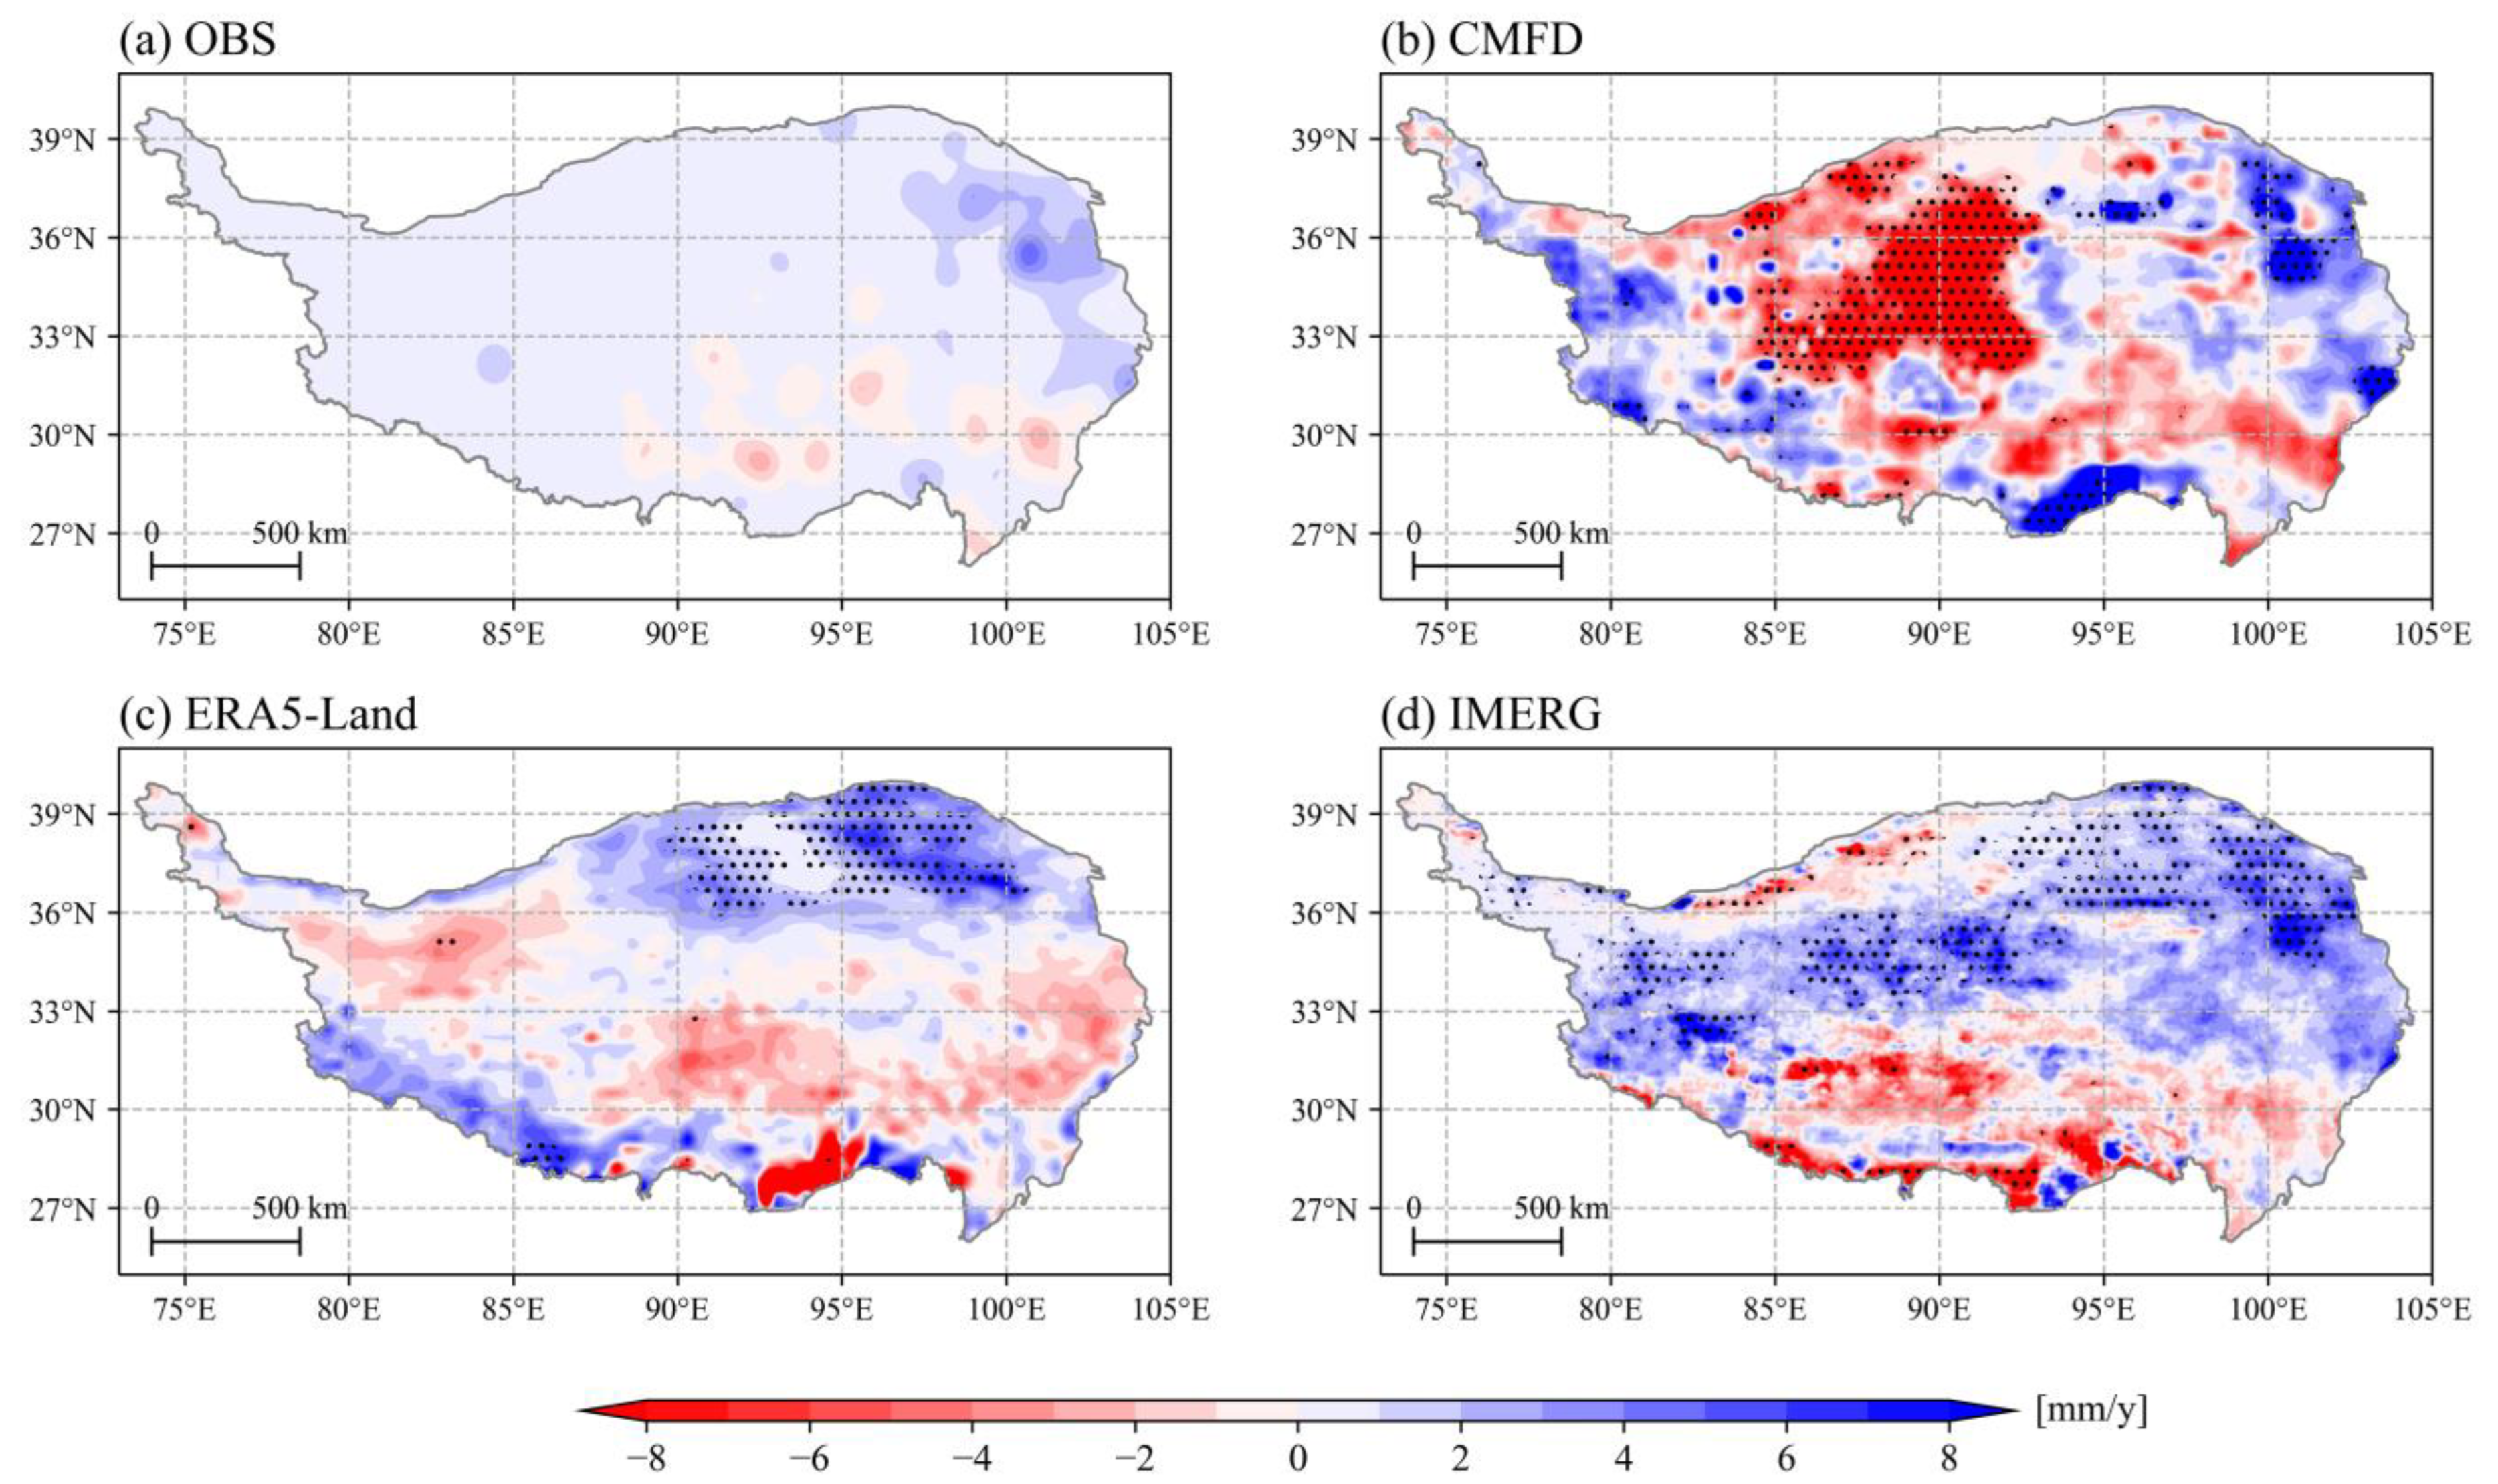
Figure 6.
Temporal pattern of the regional mean annual summer precipitation during 2000–2018 on the TP (the CMFD, ERA5-Land, and IMERG data were all interpolated to the original station locations and then the mean annual values were taken for all 133 stations).
Figure 6.
Temporal pattern of the regional mean annual summer precipitation during 2000–2018 on the TP (the CMFD, ERA5-Land, and IMERG data were all interpolated to the original station locations and then the mean annual values were taken for all 133 stations).
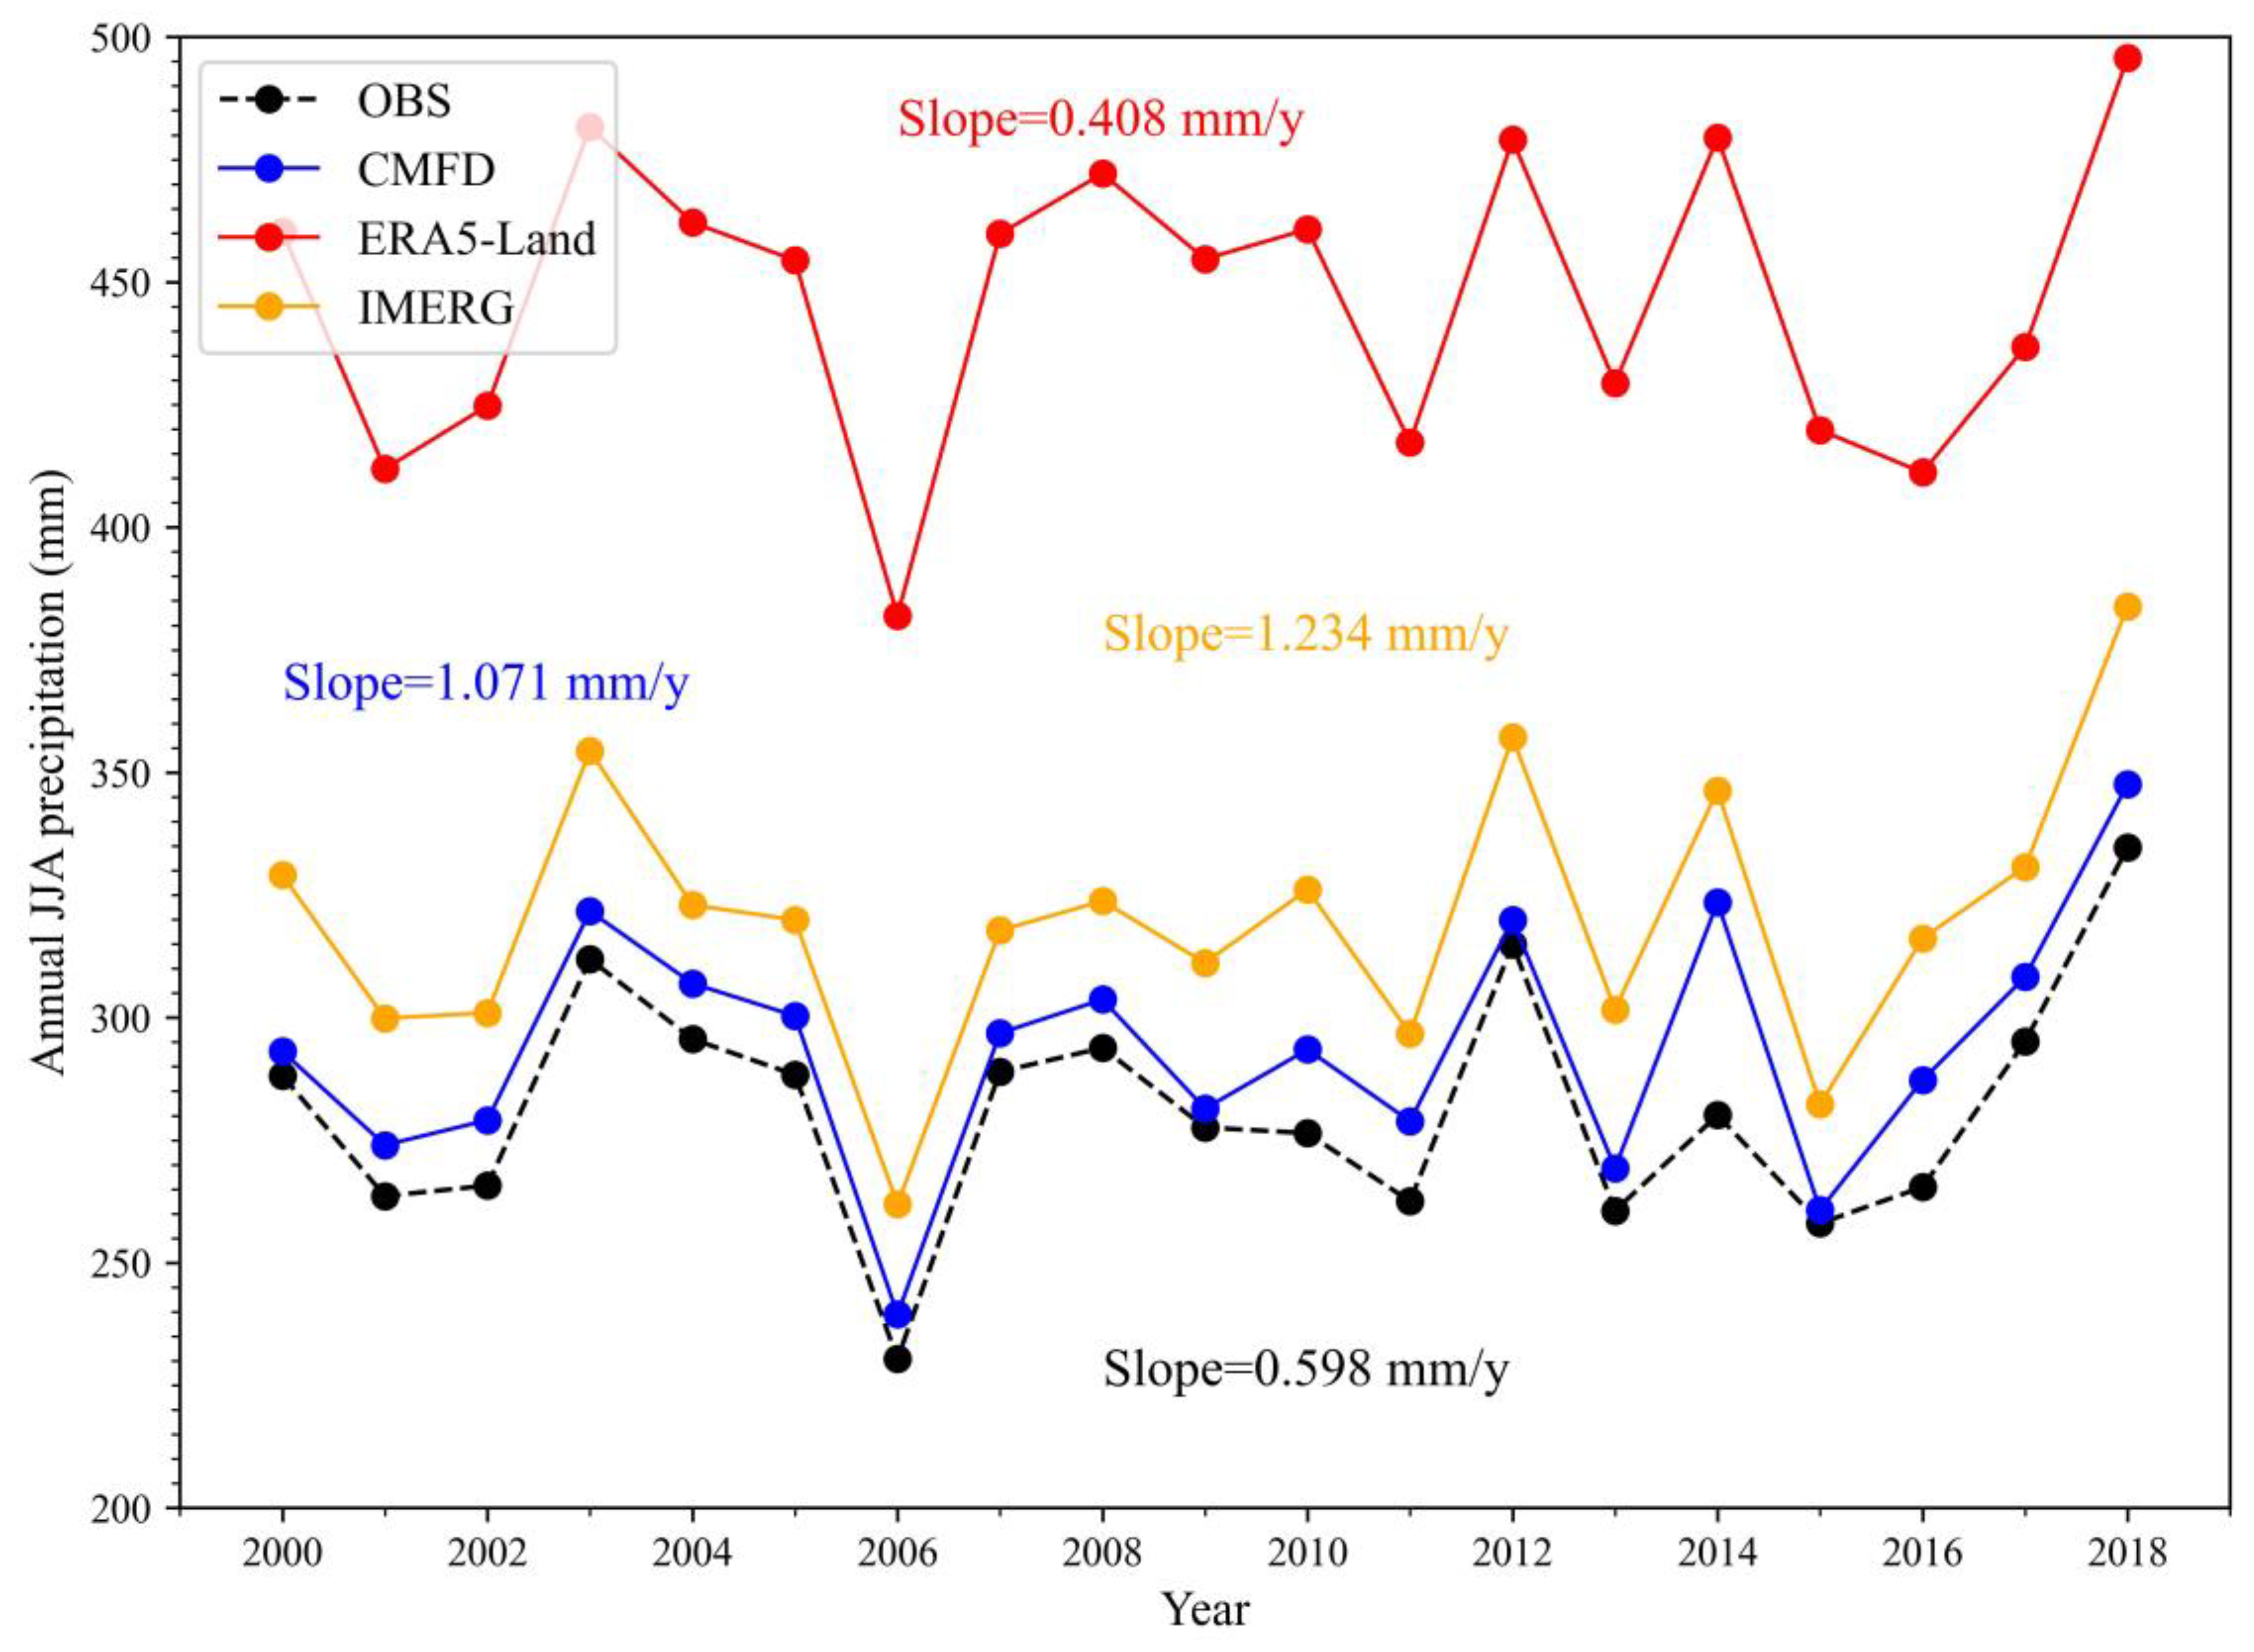
Figure 7.
Scatter plots of the annual summer precipitation for the (a) CMFD, (b) ERA5-Land, and (c) IMERG on the TP.
Figure 7.
Scatter plots of the annual summer precipitation for the (a) CMFD, (b) ERA5-Land, and (c) IMERG on the TP.
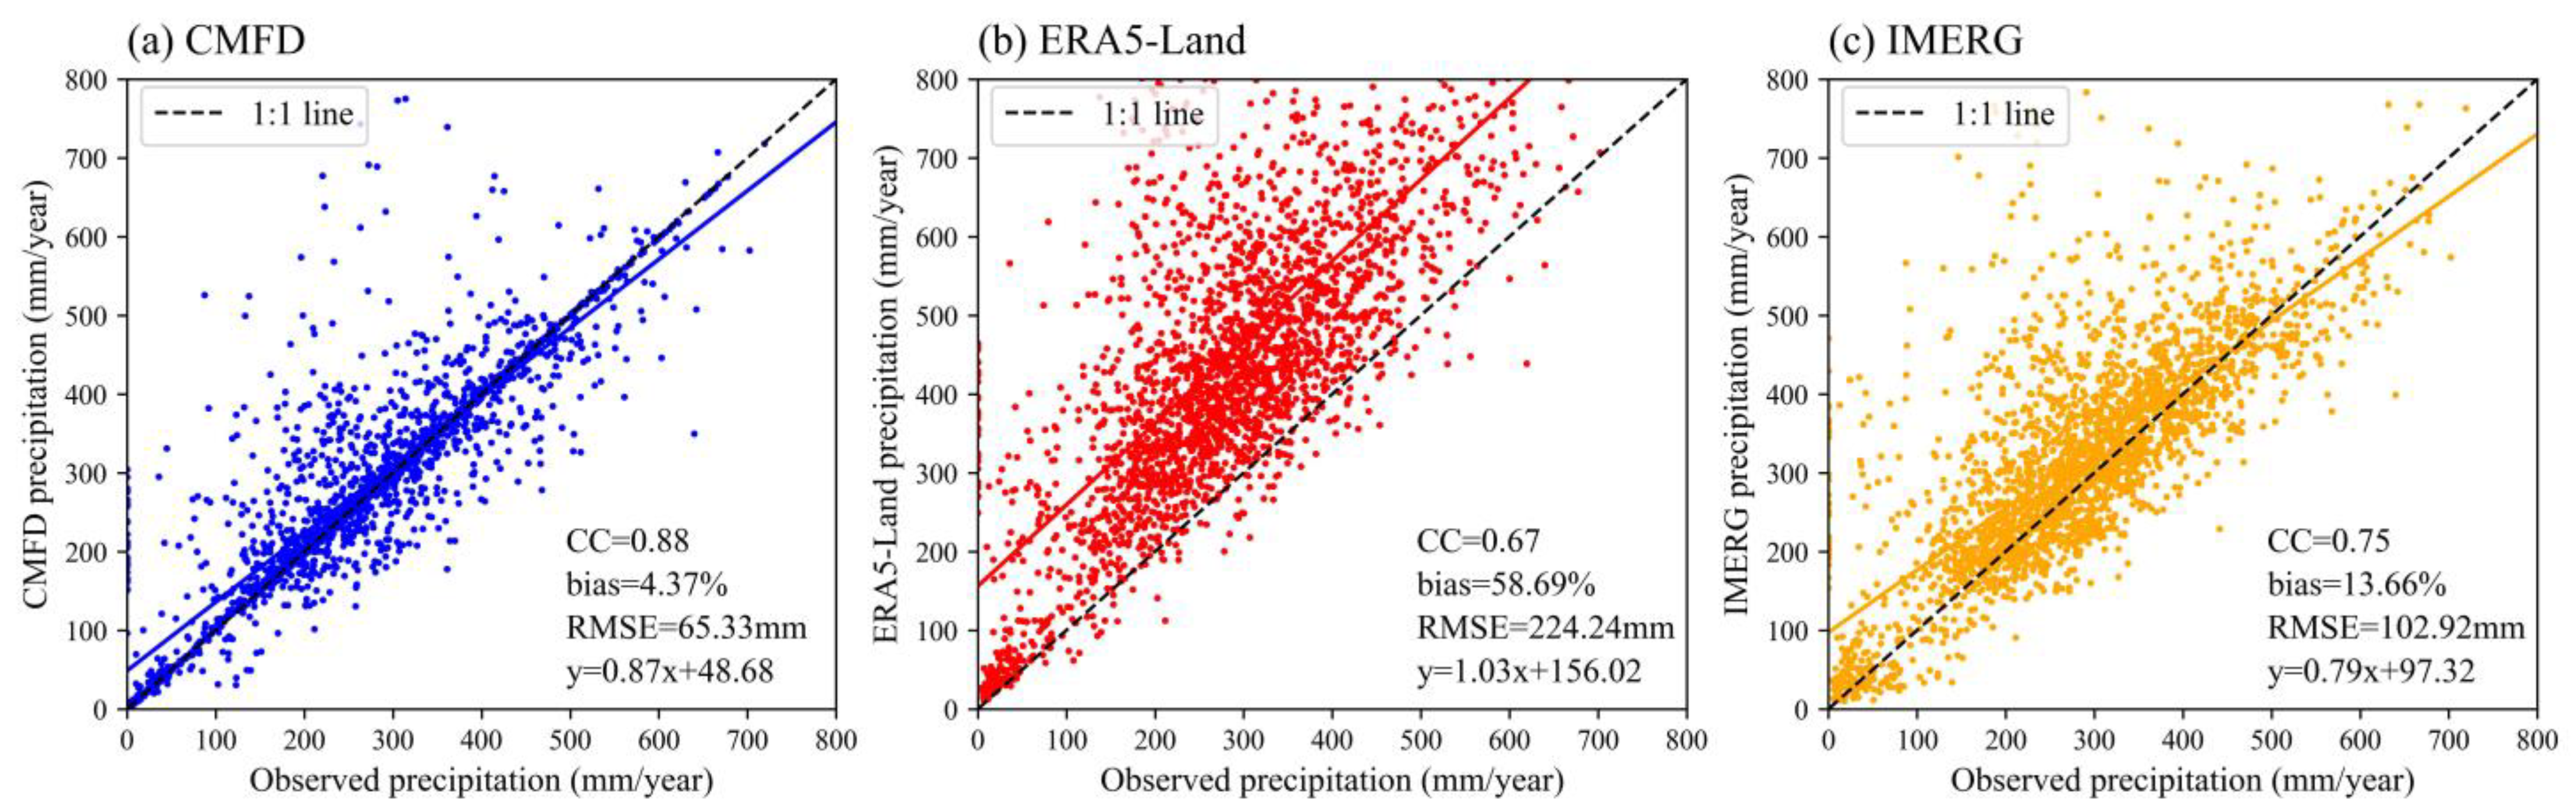
Figure 8.
Taylor diagram of high-resolution precipitation datasets for the summer months.
Figure 8.
Taylor diagram of high-resolution precipitation datasets for the summer months.
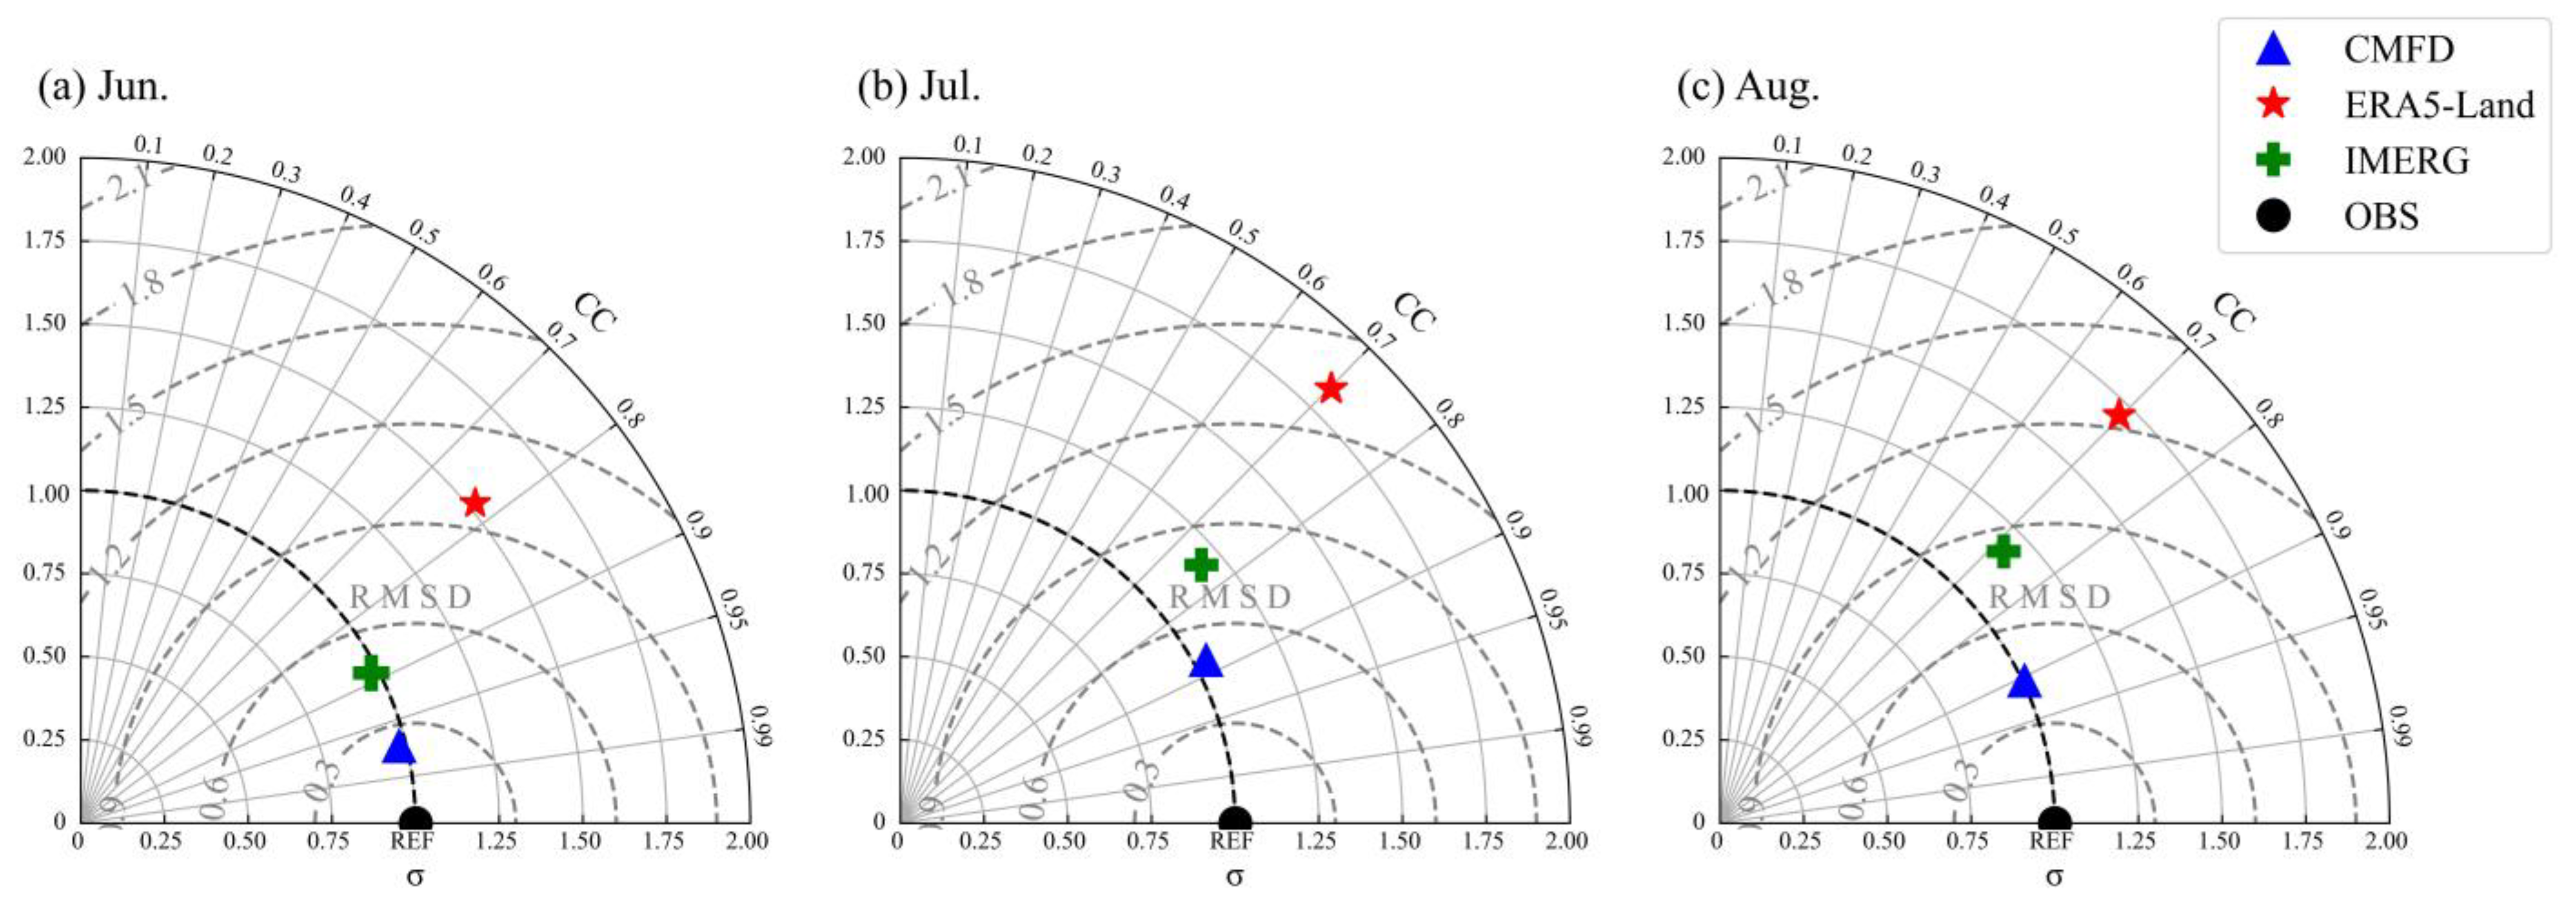
Figure 9.
Box plots of the (a) CC, (b) bias, (c) RMSE, (d) POD, (e) FAR, and (f) CSI for the CMFD, ERA5-Land, and IMERG for the summer daily scale precipitation during 2000–2018 on the TP. The black dashed line is the median value, and the red solid line is the mean value (the yellow color represents the interquartile range, the black circles represent outliers).
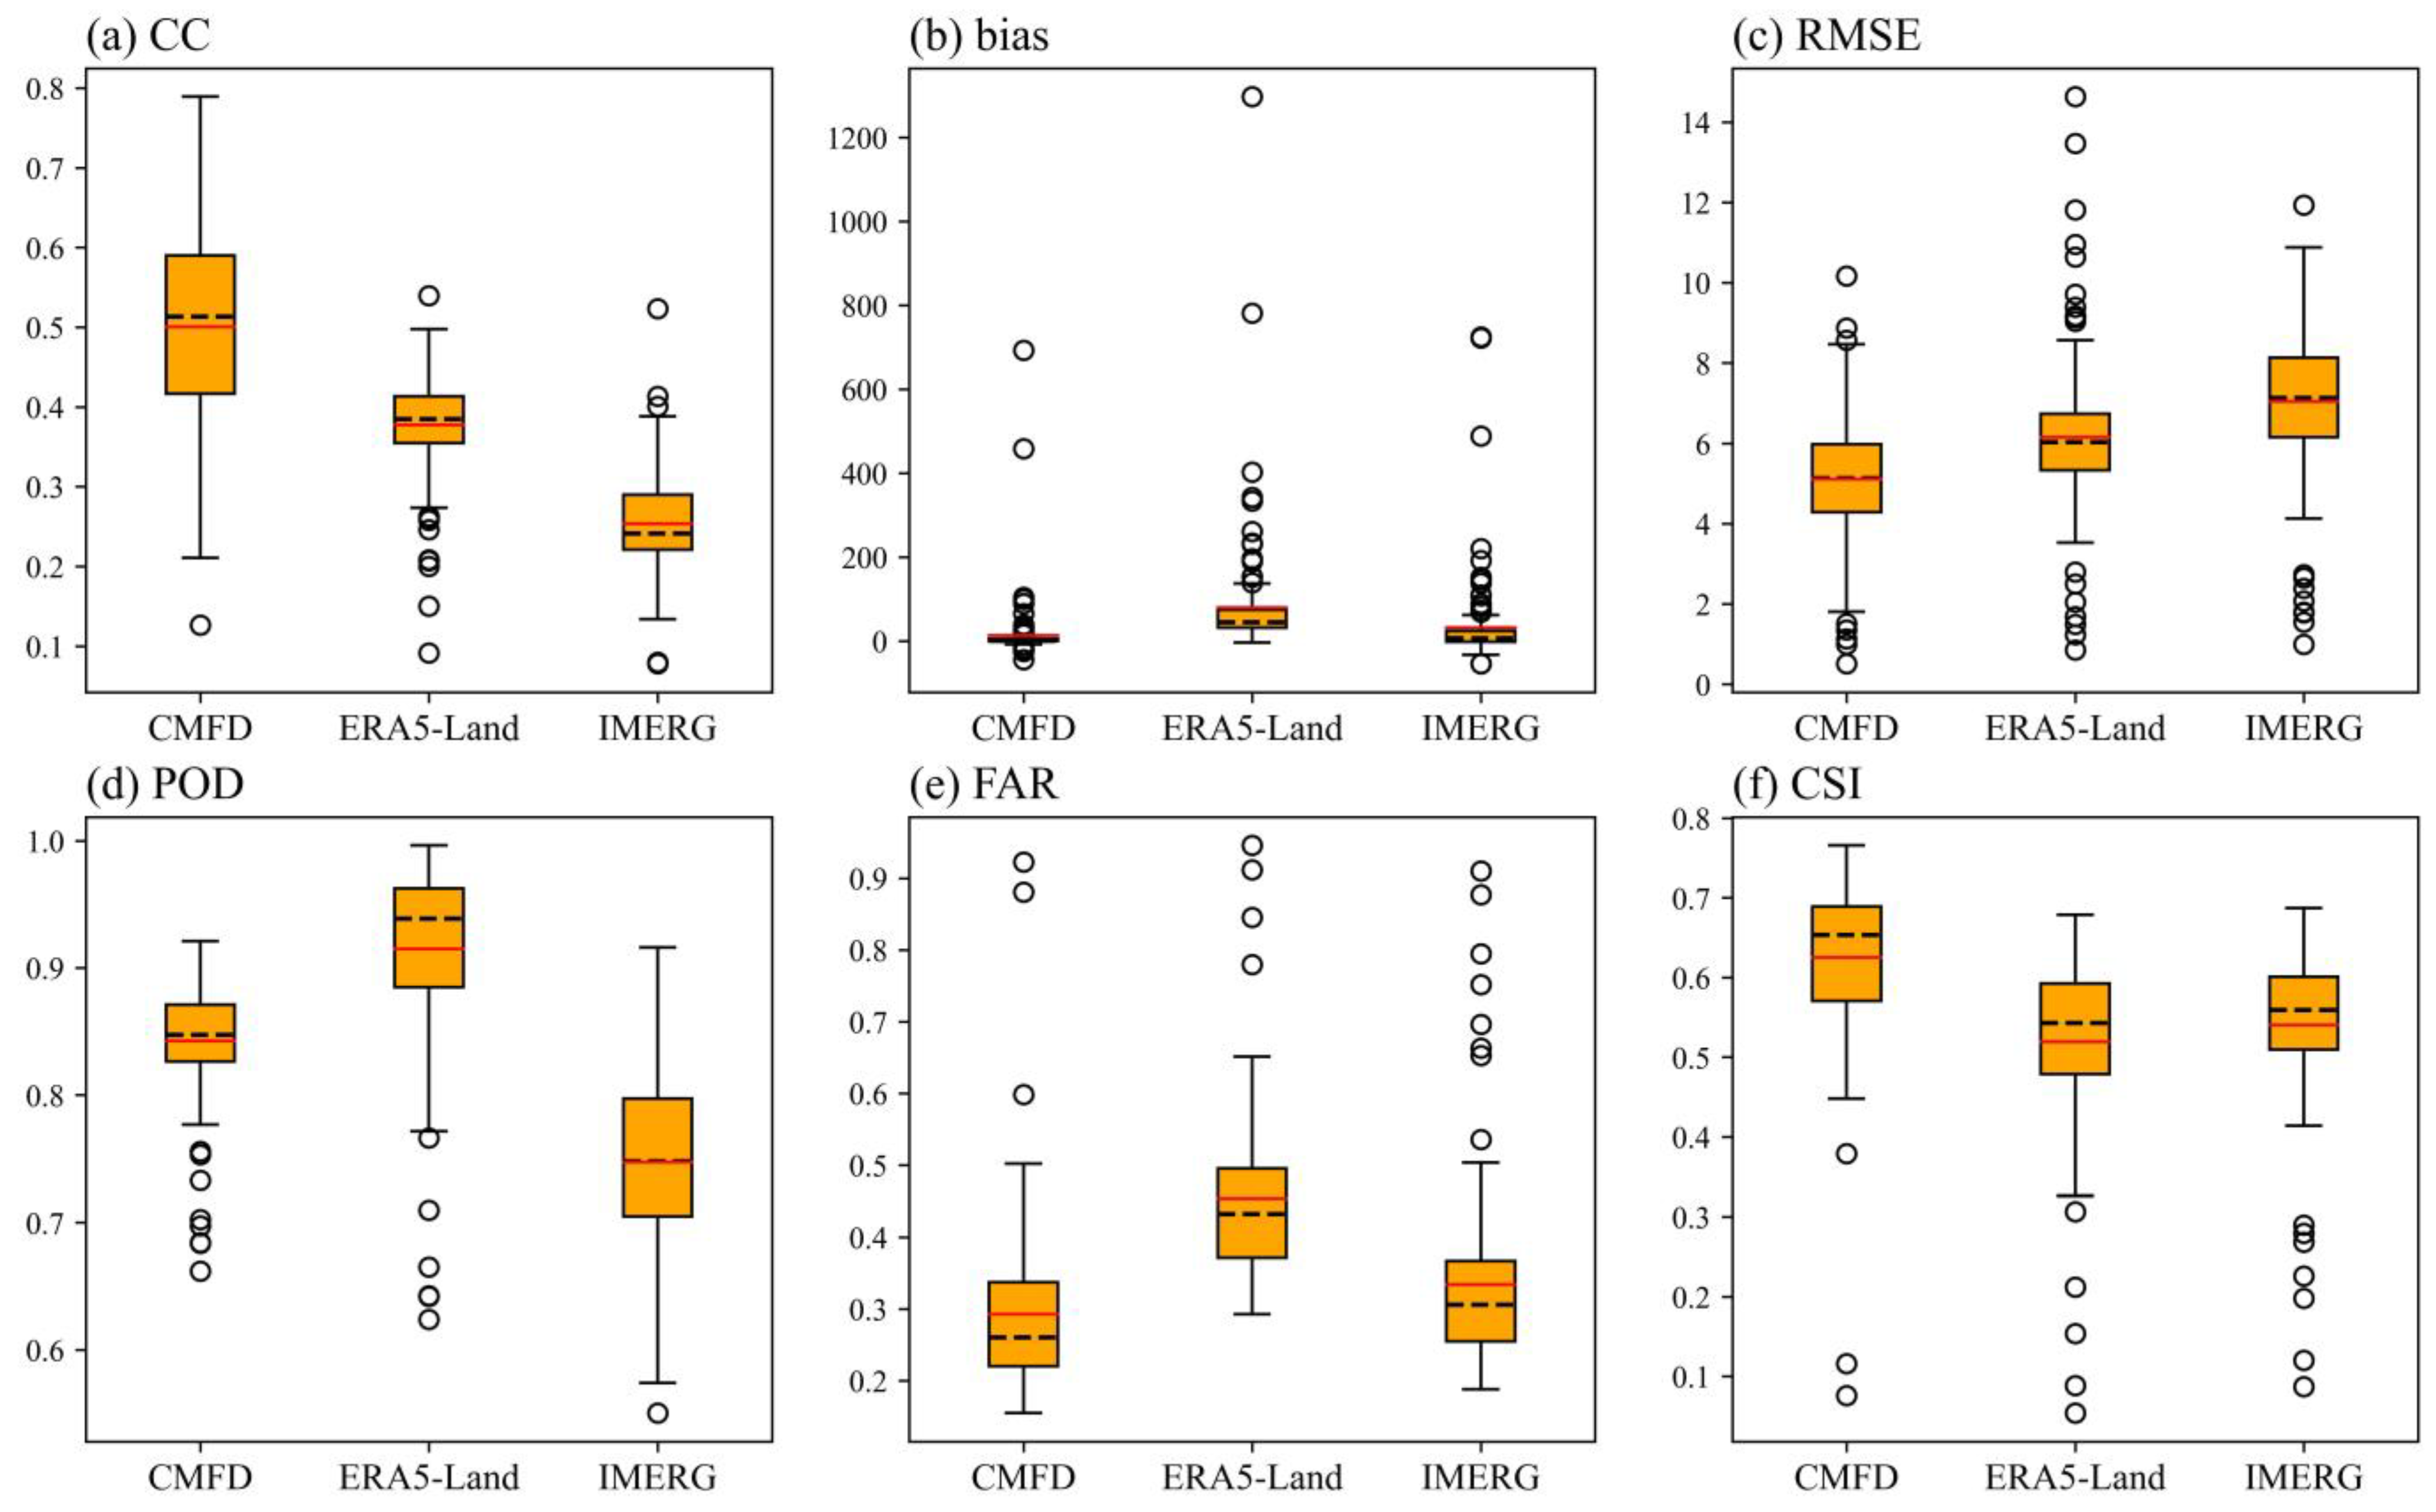
Figure 10.
Spatial patterns of (a–c) POD, (d–f) FAR, and (g–i) CSI for the CMFD, ERA5-Land, and IMERG at a daily scale in the summers of 2000–2018 on the TP, with reference to the original 133 stations.
Figure 10.
Spatial patterns of (a–c) POD, (d–f) FAR, and (g–i) CSI for the CMFD, ERA5-Land, and IMERG at a daily scale in the summers of 2000–2018 on the TP, with reference to the original 133 stations.
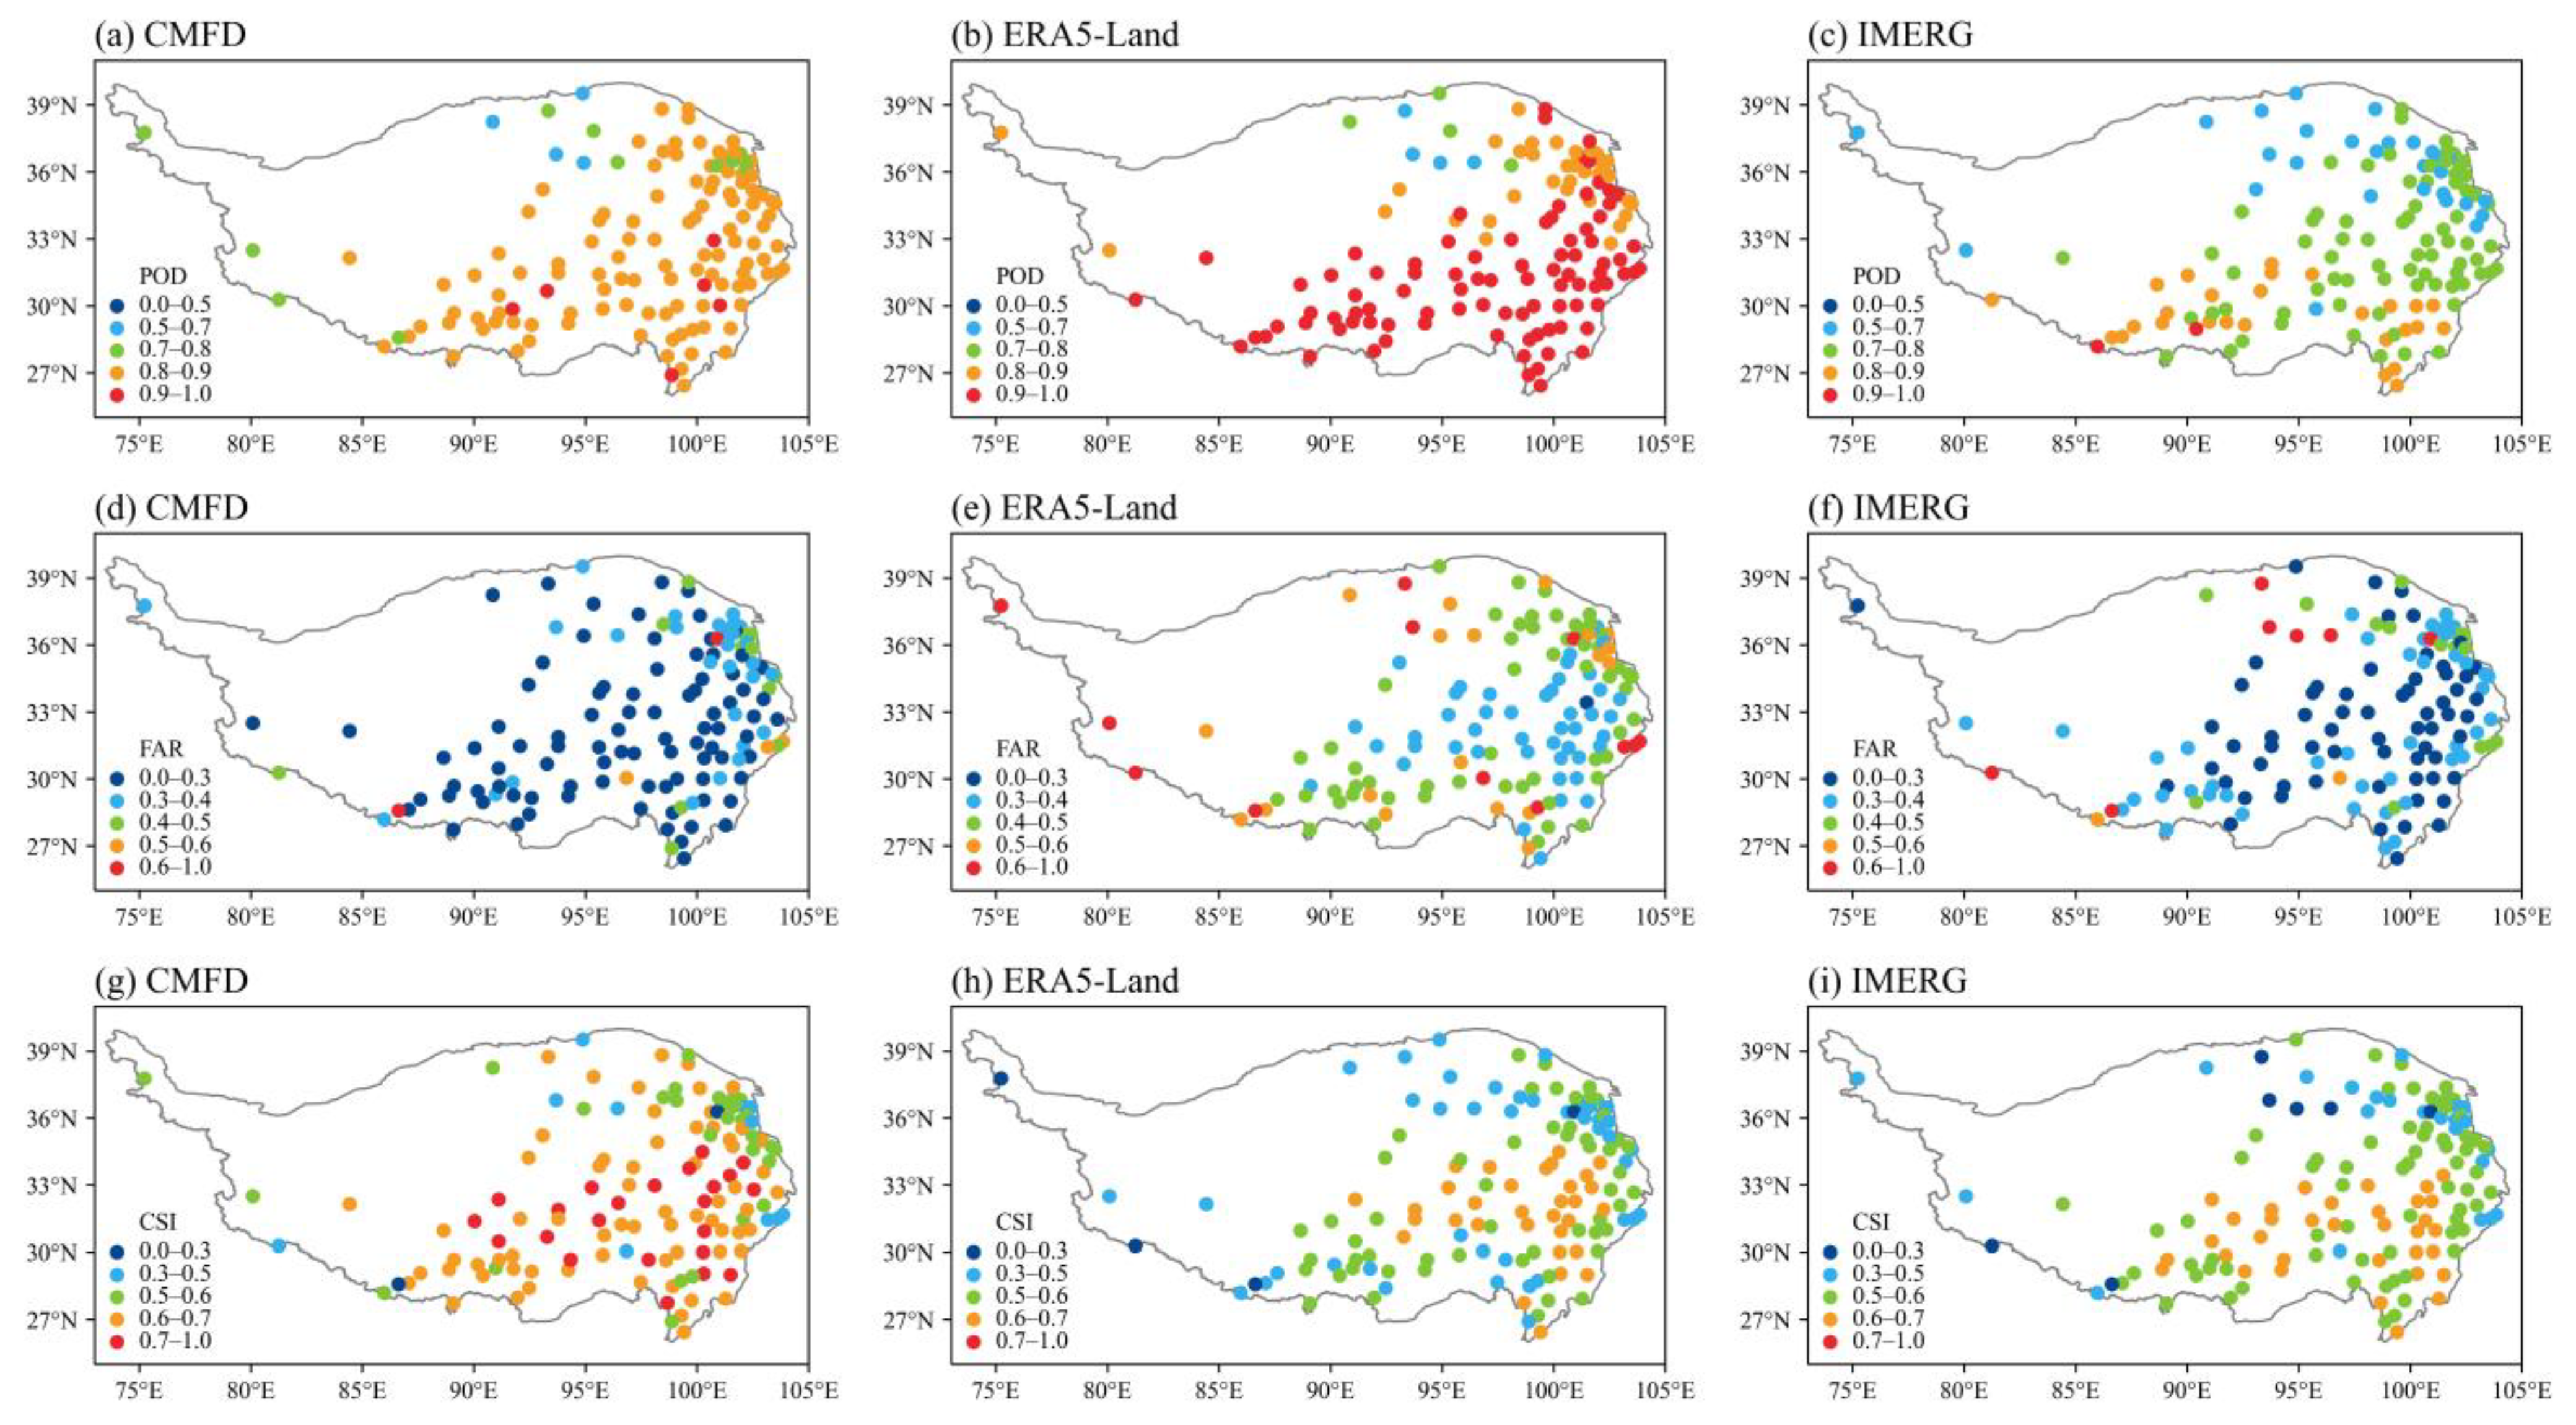
Figure 11.
Spatial patterns of the (a–c) CC, (d–f) bias, and (g–i) RMSE for the CMFD, ERA5-Land, and IMERG at a daily scale in the summers of 2016–2018 on the TP, with reference to the additional 114 stations.
Figure 11.
Spatial patterns of the (a–c) CC, (d–f) bias, and (g–i) RMSE for the CMFD, ERA5-Land, and IMERG at a daily scale in the summers of 2016–2018 on the TP, with reference to the additional 114 stations.
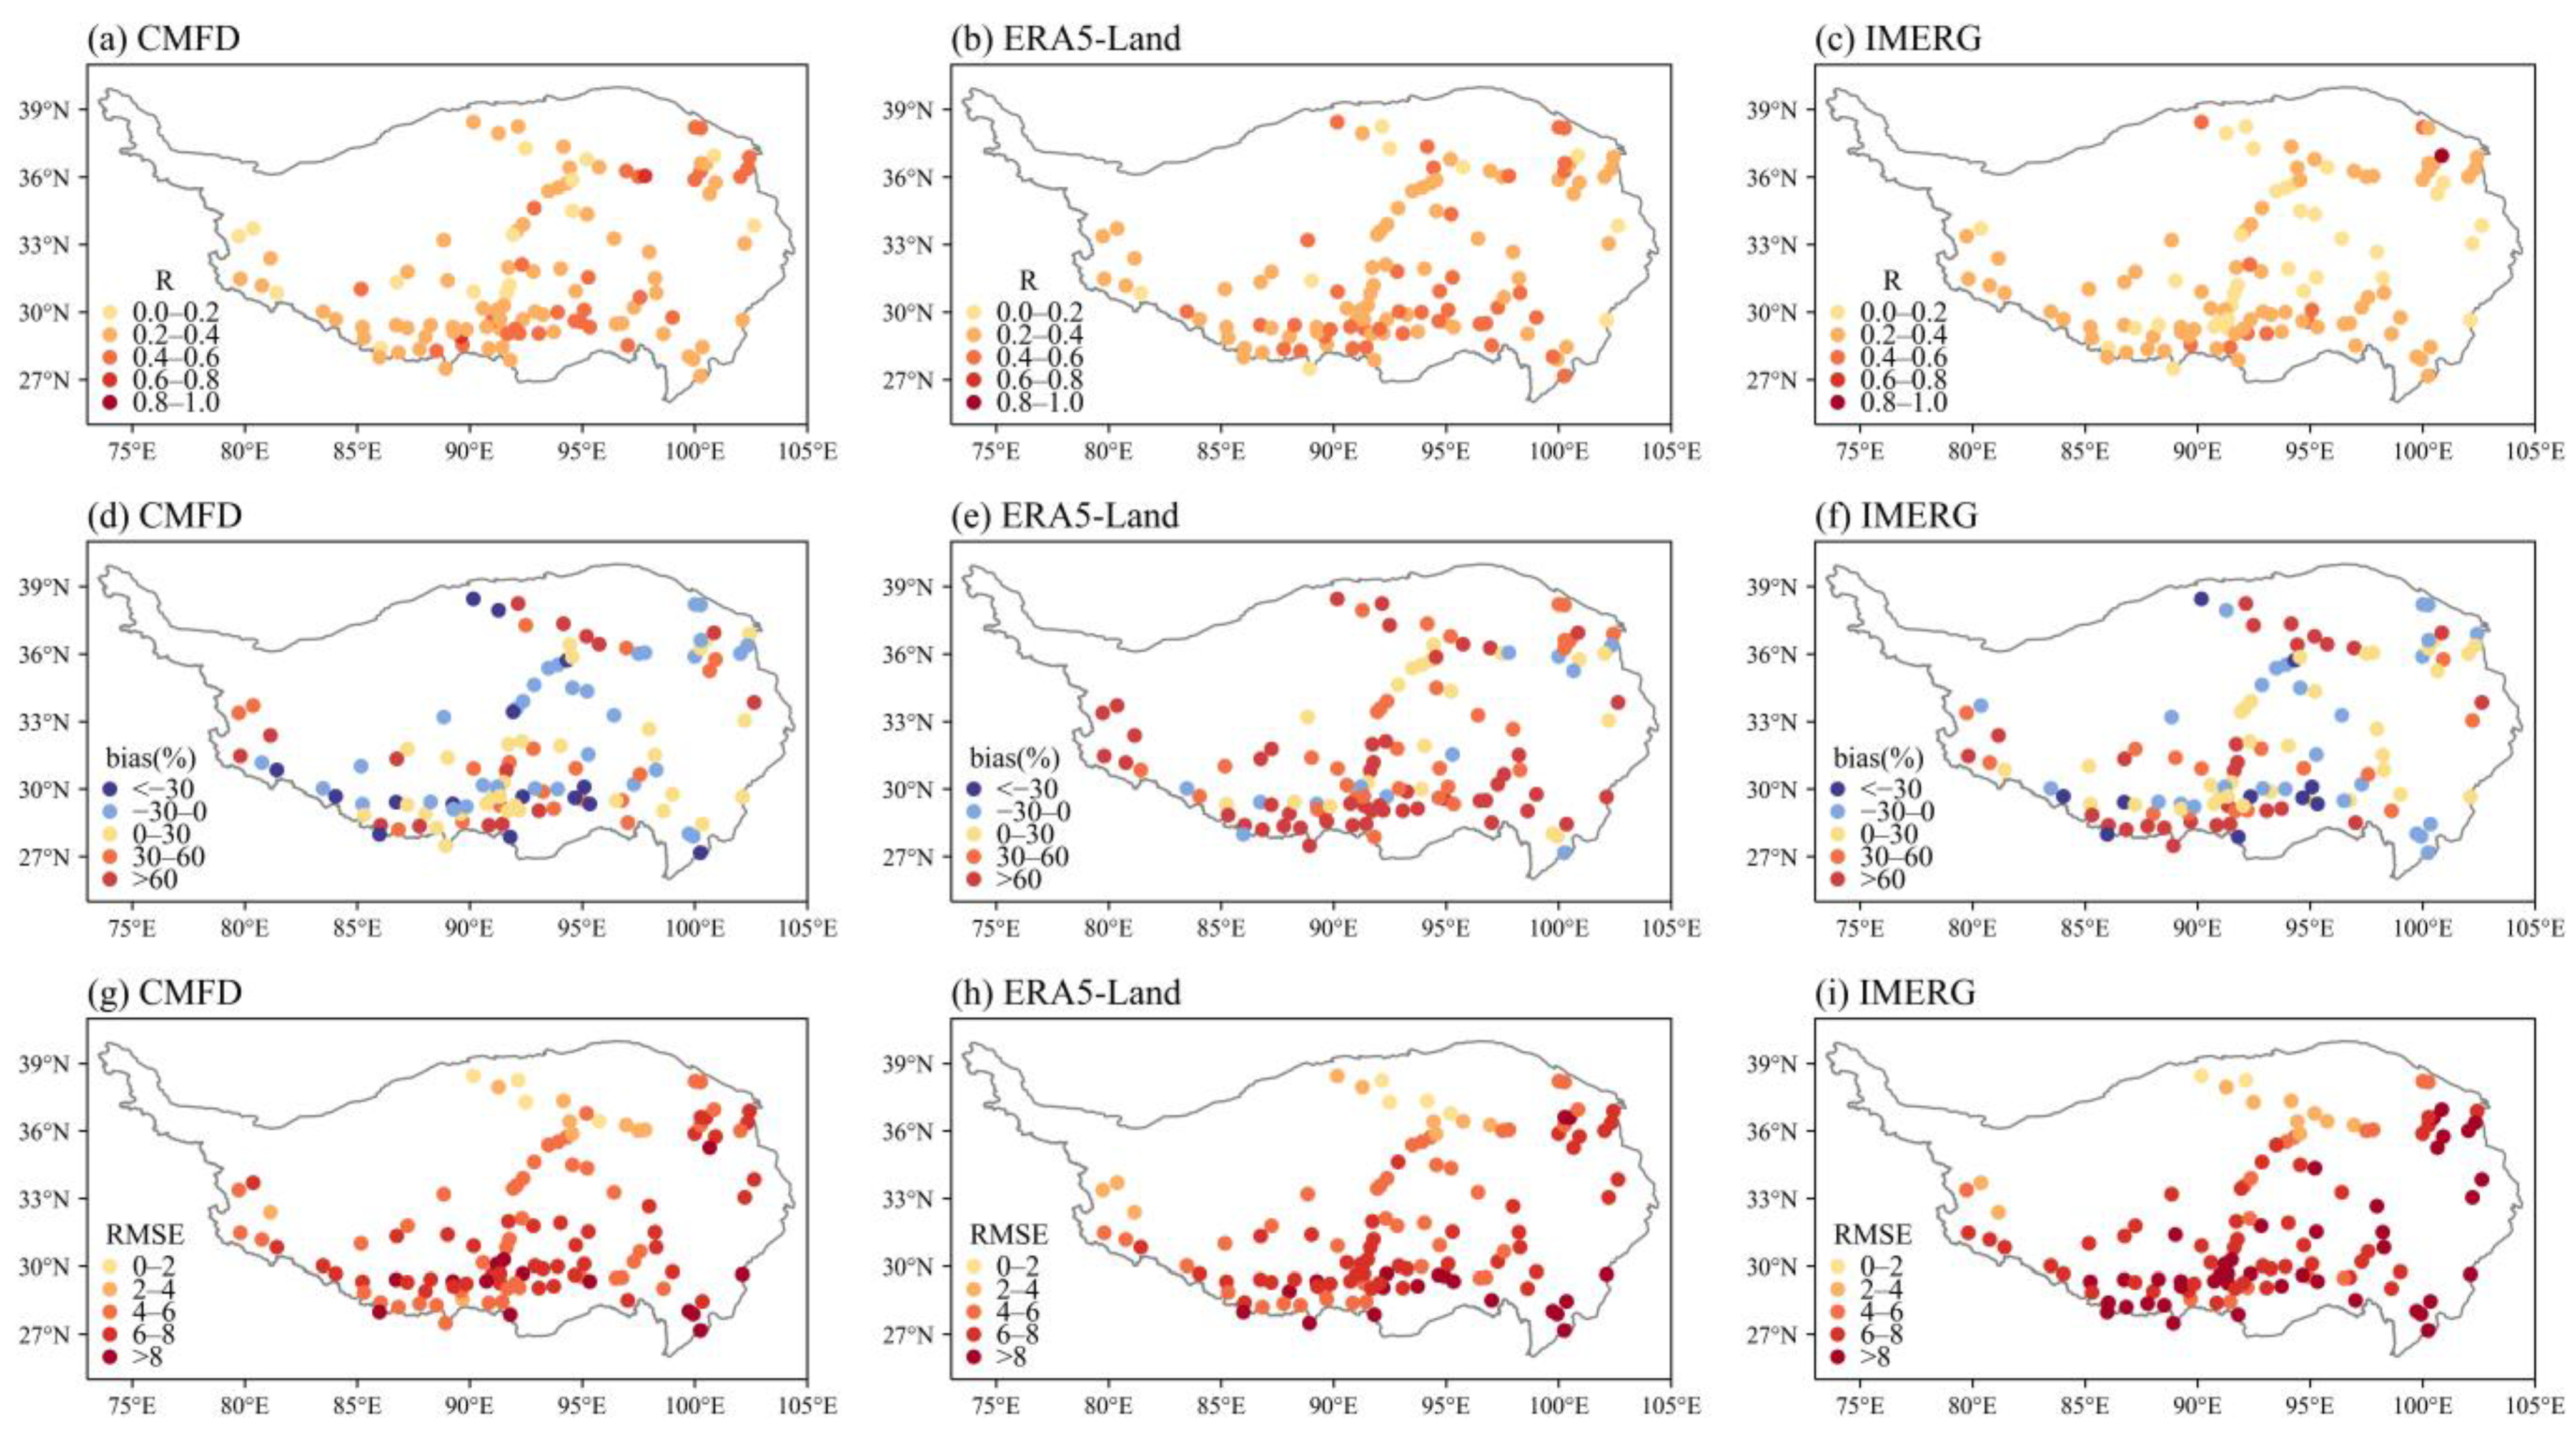
Figure 12.
Spatial patterns of (a–c) POD, (d–f) FAR, and (g–i) CSI for the CMFD, ERA5-Land, and IMERG at a daily scale in the summers of 2016–2018 on the TP, with reference to the additional 114 stations.
Figure 12.
Spatial patterns of (a–c) POD, (d–f) FAR, and (g–i) CSI for the CMFD, ERA5-Land, and IMERG at a daily scale in the summers of 2016–2018 on the TP, with reference to the additional 114 stations.
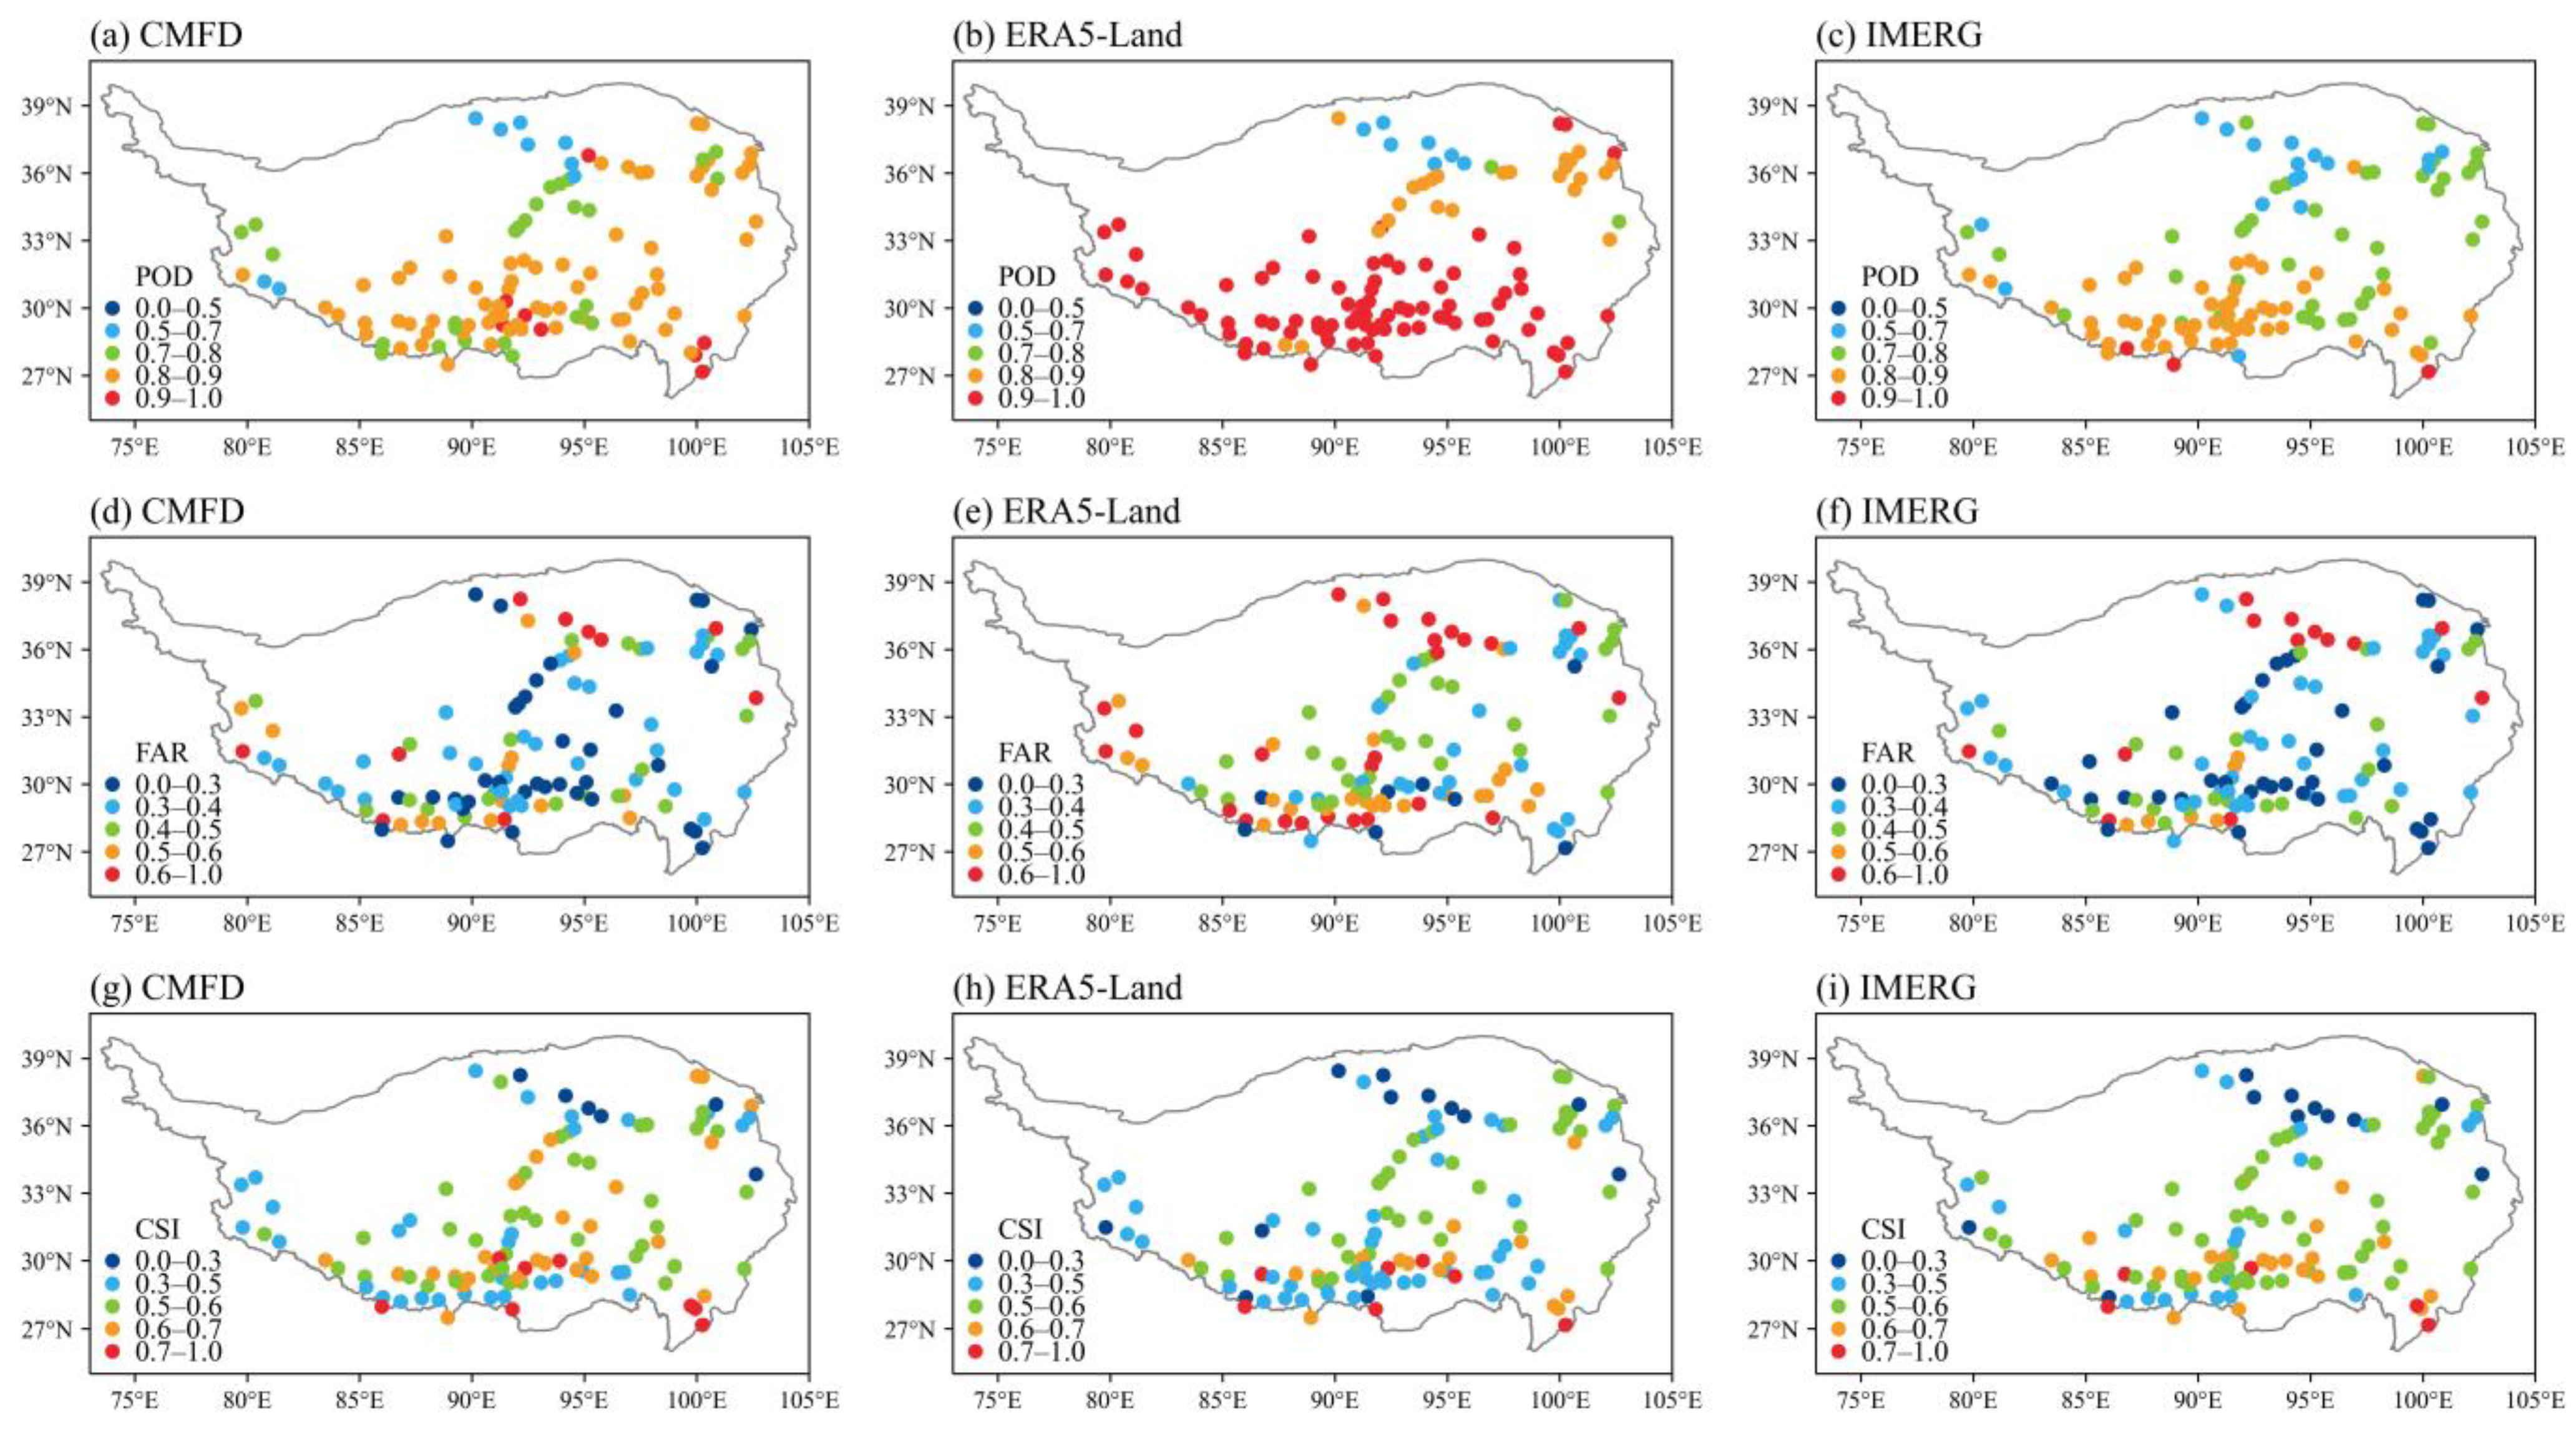
Table 1.
Evaluation metrics for the high-resolution precipitation datasets.
Table 1.
Evaluation metrics for the high-resolution precipitation datasets.
| Evaluation Metric | Formula 1 | Perfect Value |
|---|---|---|
| Correlation coefficient (CC) | 1 | |
| Relative bias (bias) | 0 | |
| Root-mean-square error (RMSE) | 0 | |
| Probability of detection (POD) | 1 | |
| False alarm ratio (FAR) | 0 | |
| Critical success index (CSI) | 1 |
Table 2.
Evaluation metrics of high-resolution precipitation datasets for summer months from 2000 to 2018.
Table 2.
Evaluation metrics of high-resolution precipitation datasets for summer months from 2000 to 2018.
| Month | Evaluation Metric | CMFD | ERA5-Land | IMERG |
|---|---|---|---|---|
| Jun. | CC | 0.932 | 0.692 | 0.846 |
| Bias (%) | 2.375 | 56.006 | 8.113 | |
| RMSE (mm/month) | 19.921 | 71.310 | 30.099 | |
| Jul. | CC | 0.837 | 0.624 | 0.743 |
| Bias (%) | 4.996 | 58.462 | 15.523 | |
| RMSE (mm/month) | 34.519 | 90.711 | 46.040 | |
| Aug. | CC | 0.868 | 0.633 | 0.736 |
| Bias (%) | 5.494 | 61.442 | 16.676 | |
| RMSE (mm/month) | 28.488 | 80.821 | 43.258 |
Table 3.
Differences between the gridded precipitation datasets used in this study with their parameters.
Table 3.
Differences between the gridded precipitation datasets used in this study with their parameters.
| Dataset | Spatio-Temporal Resolution | Temporal Coverage | Spatial Coverage | Addition |
|---|---|---|---|---|
| CMFD | 0.1°, 3 h | 1979 to 2018 | China | release latency, CMA station calibration |
| ERA5-Land | 0.1°, 1 h | 1950 to present | Global land | release latency, GPCC calibration |
| IMERG | 0.1°, 0.5 h | 2000 to 2021 | 60°N-S | release latency, NCEP Stage IV calibration |
Table 4.
Precipitation estimations at gauge stations on the Qiangtang Plateau during the summer of 2018 from the three gridded datasets.
Table 4.
Precipitation estimations at gauge stations on the Qiangtang Plateau during the summer of 2018 from the three gridded datasets.
| Station | Latitude (°E) | Longitude (°N) | OBS (mm) | CMFD (mm) | ERA5-Land (mm) | IMERG (mm) |
|---|---|---|---|---|---|---|
| EW01 | 32.51 | 79.68 | 88.6 | 95.4 | 286.1 | 139.6 |
| EW03 | 32.37 | 80.61 | 99.6 | 93.5 | 246.3 | 177.3 |
| EW05 | 32.21 | 81.56 | 181.2 | 211.4 | 332.3 | 200.2 |
| EW06 | 32.22 | 82.26 | 163.6 | 233.7 | 232.0 | 321.7 |
| EW07 | 32.53 | 82.59 | 114.2 | 247.2 | 250.0 | 400.6 |
| EW08 | 32.4 | 83.42 | 173.4 | 252.8 | 330.2 | 346.5 |
| EW09 | 32.29 | 84.07 | 166.0 | 196.3 | 286.8 | 237.1 |
| EW11 | 32.02 | 85.48 | 250.8 | 203.4 | 281.9 | 376.0 |
| EW16 | 31.87 | 88.15 | 296.8 | 283.3 | 457.3 | 436.9 |
| SN28 | 32.38 | 89.15 | 312.0 | 289.5 | 371.5 | 332.5 |