Exploration of a Rural Street Environment: The Difference in Sight between Villagers and Tourists
1. Introduction
Streets are the generator of social life and an important part of improving the quality of a living environment. In the ‘aesthetics of street’, Yoshinobu Ashihara put forward that ‘Street is a part of life’ [1]. In ‘The Death and Life of America’s Big Cities’, Chapter 2, Section 8, Jane Jacobs also discussed how to improve street safety through resident interaction and create a good street environment to attract original residents to move back [2]. The same is true in the countryside. Streets are a space for people to talk and live. Residents are organized together through street activities to form characteristic human settlements. Analyzing people’s attention to the rural street landscape is conducive to focusing on the prominent contradictions in the transformation of rural human settlements and building beautiful villages [3].
1.1. The Richness of Research Objects
The research on street environments is extensive, but most of it focuses on urban streets, and there are few studies on rural streets. China’s rural areas are a severely affected area with serious aging and lack of control over landscape and style. Relevant research is urgently needed to help them improve and develop [4]. In addition, most of the research on street environments only stems from a certain social group. From the perspective of children, Guo found that there was a significant positive correlation between the flow of people and vehicles in the open community and the number of children’s individual and peer activities [5]; Doi pays attention to the safety of the elderly crossing the street and puts forward suggestions on the integrated and inclusive design of roads, urban environment and land-use design, and community design [6]; through big data and research, Bai found that the green space in the streets of a university campus is positively correlated with the active travel of college students [7].
1.2. Diversification of Research Content
The study of the height-to-width ratio of streets by Yoshinobu Kitahara has allowed people to start quantifying proportions to explore the beauty of street design [1]. However, the beauty of a street is complex and inherently cognitive. The Kaplan couple proposed four parameters of ‘consistency, complexity, clarity and mystery’ to explore people’s perceptions of street preference and discussed the relationship between the interface complexity of streets and preference. In order to more concretely study the influence of building volume, proportions, and virtual–real relationships on preference on both sides of the street, Ye Han studied the facades of street buildings [8]. Nassar’s team studied the influence of ‘surprise’ and ‘surprise’ on preferences at the block scale and demonstrated the importance of natural elements [9]. With the enrichment of street space, greening elements have become an important part of the street environment. Xu Leiqing explored the significance of improving the quality of commercial pedestrian streets from the aspects of building facades, greening, infrastructure, and spatial scale [10] and carried out related research on ‘healing streets’ in subsequent research [11]. Chen Zheng explored the influence of the density of street elements and personal emotional participation on street attraction through semantic segmentation technology [12].
1.3. Realization of Experimental Environment
Through a literature search, it has been found that most of the previous studies on spatial experience use real-life photos [13,14], real-life videos [15,16], and VR virtual environments as stimulus materials [17,18]. The research on the use of the real environment as a stimulus material in the street environment is being enriched, showing a trend towards authenticity in experimental stimulations [19,20,21]. In order to explore the real feelings of subjects on the dynamic changes in the environment in the street-environment space, two-dimensional pictures and the virtual environment without the state of walking are not enough to achieve a real reduction, and the collected data are often limited to the study of a single element, while real-scene research also means more detailed and greater data analysis and processing.
As mentioned above, the lack of attention to rural streets and the gradual enrichment of street cognition research have enabled us to conduct this research on the basis of previous studies. At the same time, the differences in feelings about the streets between different groups of tourists and aborigines are studied. In terms of research content, the group differences between villagers and tourists are explored on the basis of street attraction; in the experimental environment, a rural street scene was used as the stimulus material, and eye-tracking technology was used to analyze the visual response of the subjects to the stimulation of the elements of the street environment. On the basis of the confirmation of cognitive discipline, the rural street elements were analyzed through line-of-sight data and visual behavior. And dynamic tracking was used to analyze the causes of differences and propose design methods for street optimization [22]. Therefore, the purpose of this study is to explore the feasibility of the experimental method of exploring rural streets in a real way and to pay attention to the differences in sight of the different social groups of indigenous villagers and foreign tourists in a rural street environment, and finally, we hope to achieve the purpose of optimizing the rural street environment and attracting foreign tourists.
2. Materials and Methods
This study focuses on exploring the cognition of villagers and tourists in real rural streets. The experiment restores a free observation state to the subjects’ street walking and quantifies the subjects’ attention. This research adopts the method of deep systematic mining of small samples, puts depth analysis in the first place, reduces the selection of sample size, and aims to conduct an exploratory study with a rural street landscape as the landmark [23,24]. We explore the eye-movement data of local villagers and foreign tourists in the state of free walking in rural streetscapes, whether there are differences in the factors of attention of villagers and tourists to the street environment, and the visual behavior differences between villagers and tourists in different street interfaces.
2.1. Materials
2.2. Stimulus Selection
Analysis of the current situation of streetscape is as follows: Nanlizhuang Village, Handan City, Hebei Province, was selected as the experimental site. Nanlizhuang Village has a significant aging population and hollowing out. A survey showed that the permanent population (non-registered population) was less than 200 people, which is a typical village that focuses on the current rural problems in China. In the previous three years, the village environment was renovated, and road hardening, flower bed beautification, public toilet upgrades, infrastructure upgrades, and lighting renovations were completed. Through 11 days of field research in the village, observation of villagers’ behavior and in-depth interviews, the main street paths and spatial nodes of villagers’ activities in Nanlizhuang Village were sorted out, and the experimental path was designed, as shown in Figure 2 (moving from the village square along the campus road to enter the village committee and continue along Xingwang Street to the east of the village and to the north of the village).
2.3. Procedure
Because most of the residents had different degrees of presbyopia, hearing loss, and limited mobility, only 5 villagers who met the experimental requirements were finally selected from the 40 villagers (having naked or corrected visual acuity of more than 1.0, no visual defects or eye diseases such as color blindness and weakness, normal hearing, and unlimited walking activity). In addition, five first-time visitors to the venue were recruited. The experimental process of each tester included 5 min of instrument calibration, a total of 15 min of eye-movement data capture on the path, and 10 min of in-depth interviews. The experimental route and main spatial nodes are shown in Figure 2. The experimental process is shown in Figure 3. The basic information of the subjects was recorded at the starting point, and the eye-movement equipment was worn and calibrated. The subjects were free to observe along the designed route according to the walking speed of their living state, and the experiment was carried out in the walking state. In the course of the experiment, recording equipment was used in order to tap into the internal causes of eye-movement data changes. Finally, in-depth interviews were conducted with the subjects.
3. Analysis
Since the collected eye-movement data were real-world, dynamic data, the amount of data was huge (18 min of real-world data for each participant, with one data label per millisecond). Combined with the data analysis method, four local villagers (age 50 ± 20, male-to-female ratio 1:1) and four foreign tourists (27 ± 3, male-to-female ratio 1:1) with good data were retained for data analysis. The analysis process included four parts: difference analysis of eye-movement data, analysis of road design elements and visual behavior analysis, interviews, and event analysis, as shown in Figure 4.
3.1. Analysis of Fixation Duration
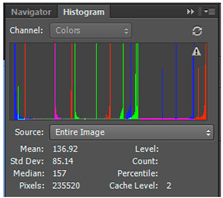
The data processing and statistical analysis of villagers and tourists in the experimental scene [25] focused on fixation duration (ms). According to previous studies, it was found that the information received by the eyes had cognitive significance when the data were ≥150 ms. When the fixation data exceeded 900 ms, the general interpretation function had not been established [26,27,28], so eigenvalue data between 150 and 900 ms were selected for analysis.
A t-test analysis was performed on the data with a mid-length fixation duration (150–900 ms) that were extracted by villagers and tourists in the overall scene and the segmented scene. Because the data distribution did not conform to the normal distribution, nonparametric rank-sum test analysis was used to analyze the cognition of villagers and tourists. At the same time, the step-frequency and saccade data of villagers and tourists were counted.
3.2. Analysis of Road Design Elements
In order to explore which street elements caused the difference, we randomly selected five nodes in each participant’s experiment. According to their eye-movement heat map and gaze trajectory, we counted the elements of concern regarding eye movement in a total of 40 nodes of eight participants, including greening, building facades, doors and windows, low walls, sky, ground, and seven other elements. Through semantic segmentation, the correlations between seven types of road elements and fixation duration data were analyzed.
Factor statistical analysis was conducted as follows: Using the I-VT algorithm supported by aSeeStudio 0.3.35.3 software, the unclassified data were filtered out from the collected data to obtain the correct fixation point. The distribution of the subjects’ fixation points was observed by visual eye-movement heat maps and fixation trajectory maps.
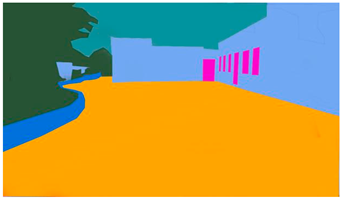
Semantic segmentation analysis was conducted as follows: Because the accuracy of the available automatic semantic segmentation methods could not meet the experimental requirements, the collected image data were all outdoor images from the perspective of mobile devices, including factors such as element overlap, solar halos, shadows, and complex color distribution. In this study, artificial semantic segmentation was used to semantically segment 40 elements of the eye-movement image data of the eight subjects. We imported the images into Adobe Photoshop to identify the streetscape elements in the photos, including roads, sky, vegetation, sidewalks, doors, windows, walls, and more. As shown in Table 1, the ratio of the pixel area of the selected element’s selection area to the pixel area of the entire image was calculated, and this indicator was named the FP (proportion of factors) value.
The correlation between the FP value of each street element and the fixation duration eigenvalue data of the corresponding sampling point was analyzed. When the p-value was >0.4 [29], there was a correlation between the two; with p > 0.4, it meant a strong correlation.
3.3. Dynamic Analysis of Visual Behavior Spaces
Gaze analysis often requires targeted analysis of gaze-behavior data in specific areas. The AOI (Area of Interest) [30] function can divide the gaze area into different blocks and count the eye-movement indicators in the block. Custom (dynamic) AOI statistics summarize the data in the region by drawing the region itself.
On the experimental path, there were three types of street spaces: semi-enclosed, enclosed, and open, based on the different enclosure relationships between architecture and green environments on the street interface. In this part, 40 s of dynamic tracking data were selected for each participant in the three street interfaces, and the experimental data were analyzed frame by frame by manual annotation. Combined with the video of behaviors, eye rotations were reviewed to analyze the eye behavior of the subjects. Through the data processing method of dynamic AOI, the interference of the changing visual area on the fixation duration of the data in the dynamic process was solved to a certain extent, so as to obtain gaze-behavior data in the three views of the left view, the ground, and the right view, Figure 5.
Through the analysis of custom AOI and key frame settings in the three types of street interfaces, Figure 6, the differences in factor attention in the visual behavior of villagers and tourists were analyzed. The indicators of the study included fixation number, fixation count, first fixation duration, total fixation duration, average fixation duration, total stay duration, and average stay duration.
In addition, some researchers have introduced the ‘information density’ index in related research to quantitatively analyze the efficiency of people’s attention to different elements in the street interface [12,16,31]. In this study, combined with the actual situation of the experiment, the index of line-of-sight magnetism is introduced to describe the degree of attraction of line of sight in different visual planes. The specific formula is as follows:
In the formula, represents the line-of-sight magnetism of the left visual surface; represents the maximum fixation duration (ms) of the left visual surface;
represents the total stay time of the left visual surface (ms); denotes the number of fixations in the left view;
denotes the total number of fixations in the current three views. Among them, the value range of is 0~100%, and the larger the value, the higher the attraction of the current view.
4. Results
4.1. Statistical Results of Eye-Movement Characteristic Values
A non-parametric rank-sum test analysis was used to test the t-tests of the eigenvalue data of villagers and tourists. As shown in Figure 7, there were significant differences in the results; that is, in the whole process of the experiment, there were significant differences in gaze-duration data between the villager group and the tourist group.
The data were further divided according to the street nodes, and a t-test was performed in each scene. The data test results showed that there were significant differences in the distribution of fixation duration eigenvalues between local villagers and tourists, as shown in Figure 7, Figure 8 and Figure 9 and Table 2; that is, there were group differences between villagers and tourists in visual attention, and the collected data had the significance of further analysis. Moreover, the overall data of tourists in the data were greater than those of villagers, with higher gaze behavior. In addition, villagers’ step frequency (route distance of 1078 m/experiment time per subject, with deceleration to the north of village east bridge at the village mouth) was significantly higher than that of the tourist group. The reason is that the villagers were very familiar with the rural street-scene environment, and the tourist group was more interested in fresh scenes.
4.2. Semantic Segmentation Results of Street Elements
The statistical results of the road elements of eye movement are shown in Table 3. The results showed that: Overall, the subjects’ attention to greening was the highest (65%), followed by the building facades (52.5%) and the ground (20%). The villagers’ attention to the elements of rural streets was 70% to greening, 35% to the ground, and 10% to the sky, and for tourists, it was 60% to greening, 50% to building facades, and 10% to low walls; from the perspective of the degree of difference, tourists pay more attention to artificial elements such as building facades and low walls than villagers do, and villagers pay more attention to natural elements such as greening, ground, and sky than tourists do.
Matthis et al. verified the instinctive observation of the ground in free walking with eye-movement equipment [32], and Gurtner et al. verified the difference between the temporal fixation dynamics in visual representation and the temporal fixation dynamics in perception through data [33]. Therefore, the attention of villagers and tourists to the ground was affected by the walking instinct, and the ground elements had a high frequency of occurrence. The frequency of ground elements in the villagers’ samples was much higher than that of tourists (>30%), reflecting the villagers’ low desire to explore the street environment, spending more time walking with their heads down and paying less attention to both sides of the street.
The fixation duration of environmental elements is affected to a considerable extent by their area in the visual interface [16]. In this study, the visual areas of 40 sample points were obtained by semantic segmentation (as shown in Table 1), and Pearson correlation analysis was performed with the fixation duration data of the corresponding samples. The data showed that in the 40 samples collected, there was a significant positive correlation between the fixation duration and the visual rate of greenery (greenery: p = 0.71116), and there was a significant negative correlation with the ground (ground: p = −0.5658). There was no significant correlation between other factors, as shown in Figure 10 and Table 4.
Both villagers and tourists showed attention to greening. The correlation between the experimental data and the view rate of greenery was significantly negatively correlated with the ratio of ground elements, reflecting the difference between people’s instinctive viewing and intentional attention. Although the frequency and visual ratio of greening and ground elements in the field of vision were very high, the fixation point stayed longer on greening than on the ground. In the street, such analysis methods can be used to capture effective environmental elements for design improvement.
4.3. Results of Street Interface Differences
Through 40 s AOI dynamic tracking and frame-by-frame image observation, two subjects who were seriously disturbed at the enclosure interface were excluded. The results of the number of fixations, the time of sight stay, the maximum fixation duration, and the magnetic calculation of the line of sight of the villager group and the tourist group were sorted out, as shown in Table 5 below.
In the closed interface, the villager group paid more attention to the right side of the face than the tourist group. According to their turning behavior and gaze hotspot maps, it was found that the attraction source was the green plants in the flower bed. The tourist group paid more attention to the style of the residential gate on the left side of the view; however, on the whole, the green plants on the right side of the flower bed were close in attractiveness to the two groups of subjects. The reason for the difference between the two groups is that the residential gate had greater attractiveness to the visitors.
In the semi-closed interface, the villager group paid more attention to the enclosed side; the tourist group paid more attention to the side of the natural forest land and had the behaviors of active approaching and continuous turning. On the whole, the attraction of the right wall enclosure to the two groups of subjects was similar. The reason for the difference was that the natural forest land and the continuous enclosure of the characteristic low wall attracted more tourists’ attention.
In the open interface, when the natural landscape on both sides was highly consistent, villagers were more attracted by the right side of the visual surface, and tourists were more attracted by the left side of the visual surface; in the open interface, the number of fixations, the time of staying in sight, and the maximum fixation time of the two groups of subjects increased significantly, Figure 11.
From the data on natural surfaces and artificial interfaces, the former had higher fixation behavior, Table 6. From the overall average data, in rural streets, tourists had higher fixation times, longer stay times, longer maximum fixation times, and more attractiveness data than those of villagers. As far as the line-of-sight behavior is concerned, the villagers’ line-of-sight conversion often needed to pass through the ground connection; that is, when turning from the left side to the right side, they would first look at the ground, while the tourists’ line-of-sight conversion was more direct than the former, directly switching between the left and right sights.
The combination of street interfaces had different effects on the sight of villagers and tourists. In the closed interface, tourists paid more attention to the artificially constructed and characteristic elements. In the semi-open interface, the villagers did not pay more attention to the natural forest land because of the influence of the greening elements, but they paid more attention to the interface on the side of the street; in the open interface, both villagers and tourists had more visual exploration behavior on natural forest land and were affected by the forms of the space enclosure and greening elements. It can be seen that visual attraction is not only affected by the types of elements, but also by the combination of street interfaces.
4.4. Interview: Memories (Impressions) of the Street
At the end of the experiment, we interviewed each participant to record the scenes that the villagers thought were the most special in the path, and we had the tourists record the three most impressive photos and their feelings (See Table 7). Using text-coding analysis, interviews and video records, these were refined into impressions of the street through translation, generalization, concretization, refinement, and concatenation.
The villagers mostly talked about the three scenes of the educated youth compound, the old supply and marketing cooperatives, and the old village site, and they talked about keywords such as ‘unique’ and ‘first’. According to the information of the village committee, the educated youth compound is the only preserved building of the educated youth in the whole township, which is well preserved and still has considerable landscape value. The old supply and marketing cooperative was the first supply and marketing cooperative in the whole township, and it was also the last supply and marketing cooperative closed in the whole township. In the past, it supported the life and living of the whole village for a long time. The special features of the old village site are that the area is complete, the historical features are still preserved, the green environment is beautiful, and it is the residence of the first batch of settlers since the Ming Dynasty, which has special significance. In addition to the above three scenes, tourists paid more attention to the various styles of brick walls along the way. When the low wall constantly accompanied the path in the human field of vision and could be well combined with the green environment, in the view of tourists, the ‘low wall’ became a representative symbol that was actively close to the observation and touch.
The results show that when the environment is related to group memory, it can easily produce more emotional value. When the appropriate street elements (low walls) appear repeatedly, it deepens people’s memory and helps to shape the impression of the street.
5. Discussion
This study used real-world eye-tracking technology to analyze the cognitive differences between villagers and tourists, two different social groups, in a rural street environment. At the same time, semantic segmentation and dynamic AOI analysis were used to provide an effective means for quantitative research on spatial perception. In addition, in-depth interviews helped us understand the cognitive differences between the two groups. The conclusions of this study mainly include the following points:
-
Reasonable use of green elements for combination design is important. In natural villages, the attractiveness of green environmental factors to the line of sight has a significant advantage. The crowd will unconsciously pay more attention to the green environment without purposeful scanning. However, high-density greening environments are not as attractive as the greening that occurs in the built environment, and the perception (150–900 ms of gazing) often comes from the longer position of the line of sight. The above experimental analysis reflects that a single instance of natural greening or a single building change cannot better influence people’s eye-turning behavior. Even in the case of an interface with high visibility of greenery, the building side with spatial changes and decorative greening can also show a higher intensity of attraction to attention. For example, compared with the fully open greening environment of interface 3, in interface 2, the old buildings in the left-view jungle and the green flower beds in the right-view continuous wall were more attractive visual stimuli.
-
In the design of streets, we should not only pay attention to the use and renewal of single elements, but also pay attention to the use of rhyme and rhythm. The combination design of ‘low wall’ and ‘green plant’, with its high frequency, can easily form an iconic impression, thus forming an impression of the street. In the dynamic analysis of tourists’ sight behavior, it was found that ‘low wall’ and ‘green plant’ attracted their attention to stay at a higher frequency, and it was found in the interview that it formed the tourists’ impressions of the street. In the village-renovation activities of the village in the past three years, the way and shape of the low-wall masonry have been enriched, and a unique symbol of the street has been formed. In the design of environmental improvements, such a combination of identifiable environmental elements can be used to repeatedly appear, form clues and rhythms, and strengthen the formation of this impression. In the village renovation of other villages, we should also pay attention to the spatial impression brought by the combination of elements and improve the quality of the street environment.
-
In the in-depth interviews, the indigenous villagers had highly similar collective memories, and these collective memories existed in specific street scenes. In the design of village street environments, we should pay attention to excavating collective memory, protecting spiritual places, reshaping the landscapes of characteristic streets in the village, awakening people’s emotional cognition of street, and promoting the formation of street attraction. In addition, compared with the single interface in the first half of the whole path, ever-changing spatial combinations in village streets can attract people’s attention and arouse people’s expectations for exploration. Therefore, in the design of village streets, we should pay attention to the use of spatial nodes to create a sense of change in the interface and even design ups and downs, with paving and a climax.
The limitations of the study are as follows: Due to the limitations of the research objective and the site, although the differences of different social groups were taken into account, the number of subjects was small due to the physiological limitations of the subjects and the complexity of the experimental conditions, so it needs to be studied with a larger sample size. Secondly, in addition to the macro-differences, such as the street interface in the selected rural street scene, there were also complexities, such as the combination of other elements of the interface. This study explores the influence of green-view interfaces and wall interfaces on line-of-sight attraction, but it does not involve more diverse street elements and their combinations. Thirdly, the experiment adopts a real scene type, and the stimulation environment chosen was a real street environment. Although it highly restores people’s feelings of being in the street, it is also susceptible to accidental factors such as pedestrians and vehicles. Each participant’s line-of-sight data contained complex behavioral factors and a large amount of data. Therefore, it is necessary to study the causes of the subjects’ line-of-sight behavior in a shorter timeline and a more detailed space. This also makes the analysis more and more complex and more susceptible to individual differences. Fourthly, this study has initially found that the villagers’ local memory and the first impression of tourists are the reasons for their deeper cognitive differences. How to use design techniques to establish local memory as a unique symbol of the countryside will also become research content of the next stage.
This study focuses on exploring the feasibility of the experimental method of exploring rural streets in a real way. At the same time, it pays attention to the differences in sight of the different social groups of indigenous villagers and foreign tourists in a rural street environment and obtains design points to improve the rural street environment from the differences. It is important to build a rural street environment that enables villagers to have a sense of belonging and attracts more tourists. The results of this study can provide new ideas for rural street research, contribute to the field of rural design, and help designers better and more clearly understand people’s perception of landscape elements to guide street design. In the future, the sample data will be expanded for more in-depth research, such as exploring the differences in people’s feelings that are caused by spatial combination changes and gradually combining the research into comprehensive spatial research results.
Author Contributions
Conceptualization, H.R. and J.Z.; methodology, L.Z.; software, L.Z.; validation, H.R., J.Z. and L.Z.; formal analysis, L.Z.; investigation, H.R.; resources, H.R.; data curation, J.Z.; writing—original draft preparation, L.Z.; writing—review and editing, H.R.; visualization, L.Z. and X.W.; supervision, J.Z.; project administration, H.R.; funding acquisition, H.R. and Q.W. All authors have read and agreed to the published version of the manuscript.
Funding
This work was supported by Hebei Provincial Social Science Fund: Research on the Risk Assessment System of National Spatial Planning Based on Sudden Public Health Incidents, Project Approval Number: HB20GL055.
Institutional Review Board Statement
The study was conducted according to the guidelines of the Declaration of Helsinki and approved by the Institutional Review Bioethics Committee of Hebei Engineering University School of Medicine (protocol code: BER-YXY-2023031, approved 10 June 2023).
Informed Consent Statement
Written informed consent has been obtained from the patient(s) to publish this paper.
Data Availability Statement
No new data were created or analyzed in this study. Data sharing is not applicable to this article.
Conflicts of Interest
Qingqin Wang was employed by the company China Academy of Building Research Co., Ltd. The remaining authors declare that the research was conducted in the absence of any commercial or financial relationships that could be construed as a potential conflict of interest.
References
- Christensen, K.; Bailey, E.G. Review of The Aesthetic Townscape, by Y. Ashihara & L. E. Riggs. J. Archit. Plan. Res. 1984, 1, 151–153. Available online: http://www.jstor.org/stable/43028686 (accessed on 25 February 2024).
- Row, A.T. Review of The Death and Life of Great American Cities, by J. Jacobs. Yale Law J. 1962, 71, 1597–1602. [Google Scholar] [CrossRef]
- Li, Y.-R.; Cao, L.-Z.; Wang, P.-Y.; Chang, G.-J. Rural living environment improvement and rural revitalization. J. Nat. Resour. 2022, 37, 96–109. [Google Scholar] [CrossRef]
- Zhang, L.; Wang, L.; Li, R. Discussions on the Dilemmas, Causes and Conservation Suggestions of Rural Landscape in China Based on the Field Studies. Urban Plan. Int. 2019, 34, 59–68. [Google Scholar] [CrossRef]
- Guo, D.; Shi, Y.; Chen, R. Environmental affordances and children’s needs: Insights from child-friendly community streets in China. Front. Archit. Res. 2023, 12, 411–422. [Google Scholar] [CrossRef]
- Doi, K.; Sunagawa, T.; Inoi, H.; Yoh, K. Transitioning to safer streets through an integrated and inclusive design. IATSS Res. 2016, 39, 87–94. [Google Scholar] [CrossRef]
- Bai, Y.; Cao, M.; Wang, R.; Liu, Y.; Wang, S. How street greenery facilitates active travel for university students. J. Transp. Health 2022, 26, 101393. [Google Scholar] [CrossRef]
- Ye, H. A Study on the Visual Perception and Preference Factor of the Facades of High Buildings; Tongji University: Shanghai, China, 2013. [Google Scholar]
- Nasar, J.L.; Cubukcu, E. Evaluative Appraisals of Environmental Mystery and Surprise. Environ. Behav. 2011, 43, 387–414. [Google Scholar] [CrossRef]
- Xu, L.; Shi, J. Walking Activity Quality and Built Environment: Take Three Commercial Streets in Shanghai as Examples. Shanghai Urban Plan. Rev. 2017, 1, 17–24. [Google Scholar]
- Xu, L.Q.; Meng, R.X.; Huang, S.Q.; Chen, Z. Healing Oriented Street Design: Experimental Explorations via Virtual Reality. Urban Plan. Int. 2019, 34, 38–45. [Google Scholar] [CrossRef]
- Yiyan, C.; Zheng, C.; Ming, D. Designing Attention—Research on Landscape Experience Through Eye Tracking in Nanjing Road Pedestrian Mall (Street) in Shanghai. Landsc. Archit. Front. 2022, 10, 52. [Google Scholar] [CrossRef]
- Xing, Y.; Leng, J. Evaluation of Public Space in Traditional Villages Based on Eye Tracking Technology. J. Asian Archit. Build. Eng. 2024, 23, 125–139. [Google Scholar] [CrossRef]
- Li, J.; Zhang, Z.; Jing, F.; Gao, J.; Ma, J.; Shao, G.; Noel, S. An evaluation of urban green space in Shanghai, China, using eye tracking. Urban For. Urban Green. 2020, 56, 126903. [Google Scholar] [CrossRef]
- Amati, M.; McCarthy, C.; Parmehr, E.G.; Sita, J. Combining eye-tracking data with an analysis of video content from free-viewing a video of a walk in an urban park environment. JoVE J. Vis. Exp. 2019, e58459. [Google Scholar] [CrossRef]
- Amati, M.; Parmehr, E.G.; McCarthy, C.; Sita, J. How eye-catching are natural features when walking through a park? Eye-tracking responses to videos of walks. Urban For. Urban Green. 2018, 31, 67–78. [Google Scholar] [CrossRef]
- Pei, W.; Guo, X.; Lo, T. Pre-Evaluation method of the experiential architecture based on multidimensional physiological perception. J. Asian Archit. Build. Eng. 2023, 22, 1170–1194. [Google Scholar] [CrossRef]
- Spiers, H.J.; Maguire, E.A. The dynamic nature of cognition during wayfinding. J. Environ. Psychol. 2008, 28, 232–249. [Google Scholar] [CrossRef] [PubMed]
- Simpson, J.; Freeth, M.; Simpson, K.J.; Thwaites, K. Street edge subdivision: Structuring ground floor interfaces to stimulate pedestrian visual engagement. Environ. Plan. B Urban Anal. City Sci. 2022, 49, 1775–1791. [Google Scholar] [CrossRef]
- Ye, K.; Luo, H.; Zhong, H.; Kang, J. Physiological and psychological influence of multi-media in urban business districts. Sustain. Cities Soc. 2022, 77, 103546. [Google Scholar] [CrossRef]
- Davoudian, N.; Raynham, P. What do pedestrians look at at night? Light. Res. Technol. 2012, 44, 438–448. [Google Scholar] [CrossRef]
- Takahashi, R.; Suzuki, H.; Chew, J.Y.; Ohtake, Y.; Nagai, Y.; Ohtomi, K. A system for three-dimensional gaze fixation analysis using eye tracking glasses. J. Comput. Des. Eng. 2018, 5, 449–457. [Google Scholar] [CrossRef]
- Gehl, J. Life between Buildings: Using Public Space; Island Press: Washington, DC, USA, 2011. [Google Scholar]
- Zhao, C.; Yang, B.; Liu, D. PSPL survey: The evaluation method for quality of public space and public lifeÐThe study on Jan Gehl’s theory and method for public space design (Part 3). Chin. Landsc. Archit. 2012, 28, 34–38. [Google Scholar]
- Zhang, J.; Park, S.; Cho, A.; Whang, M. Significant Measures of Gaze and Pupil Movement for Evaluating Empathy between Viewers and Digital Content. Sensors 2022, 22, 1700. [Google Scholar] [CrossRef] [PubMed]
- Pannasch, S.; Dornhoefer, S.M.; Unema, P.J.A.; Velichkovsky, B.M. The omnipresent prolongation of visual fixations: Saccades are inhibited by changes in situation and in subject’s activity. Vis. Res. 2001, 41, 3345–3351. [Google Scholar] [CrossRef]
- Schleicher, R.; Galley, N.; Briest, S.; Galley, L. Blinks and saccades as indicators of fatigue in sleepiness warnings: Looking tired? Ergonomics 2008, 51, 982–1010. [Google Scholar] [CrossRef]
- Saito, S. Does fatigue exist in a quantitative measurement of eye movements? Ergonomics 1992, 35, 607–615. [Google Scholar] [CrossRef]
- Edelmann, D.; Móri, T.F.; Székely, G.J. On relationships between the Pearson and the distance correlation coefficients. Stat. Probab. Lett. 2021, 169, 108960. [Google Scholar] [CrossRef]
- Orquin, J.L.; Ashby, N.J.S.; Clarke, A.D.F. Areas of interest as a signal detection problem in behavioral eye-tracking research. J. Behav. Decis. Mak. 2016, 29, 103–115. [Google Scholar] [CrossRef]
- Duchowski, A.T. Eye Tracking Techniques. In Eye Tracking Methodology: Theory and Practice; Springer: London, UK, 2003; pp. 55–65. [Google Scholar] [CrossRef]
- Matthis, J.S.; Yates, J.L.; Hayhoe, M.M. Gaze and the Control of Foot Placement When Walking in Natural Terrain. Curr. Biol. 2018, 28, 1224–1233.e5. [Google Scholar] [CrossRef]
- Gurtner, L.M.; Hartmann, M.; Mast, F.W. Eye movements during visual imagery and perception show spatial correspondence but have unique temporal signatures. Cognition 2021, 210, 104597. [Google Scholar] [CrossRef]
Figure 1.
(a) real-life eye tracker, (b) visual heat maps, (c) annotated trajectory maps, (d) dynamic AOI analysis of gaze-activity data in the subjects’ experiments.
Figure 1.
(a) real-life eye tracker, (b) visual heat maps, (c) annotated trajectory maps, (d) dynamic AOI analysis of gaze-activity data in the subjects’ experiments.
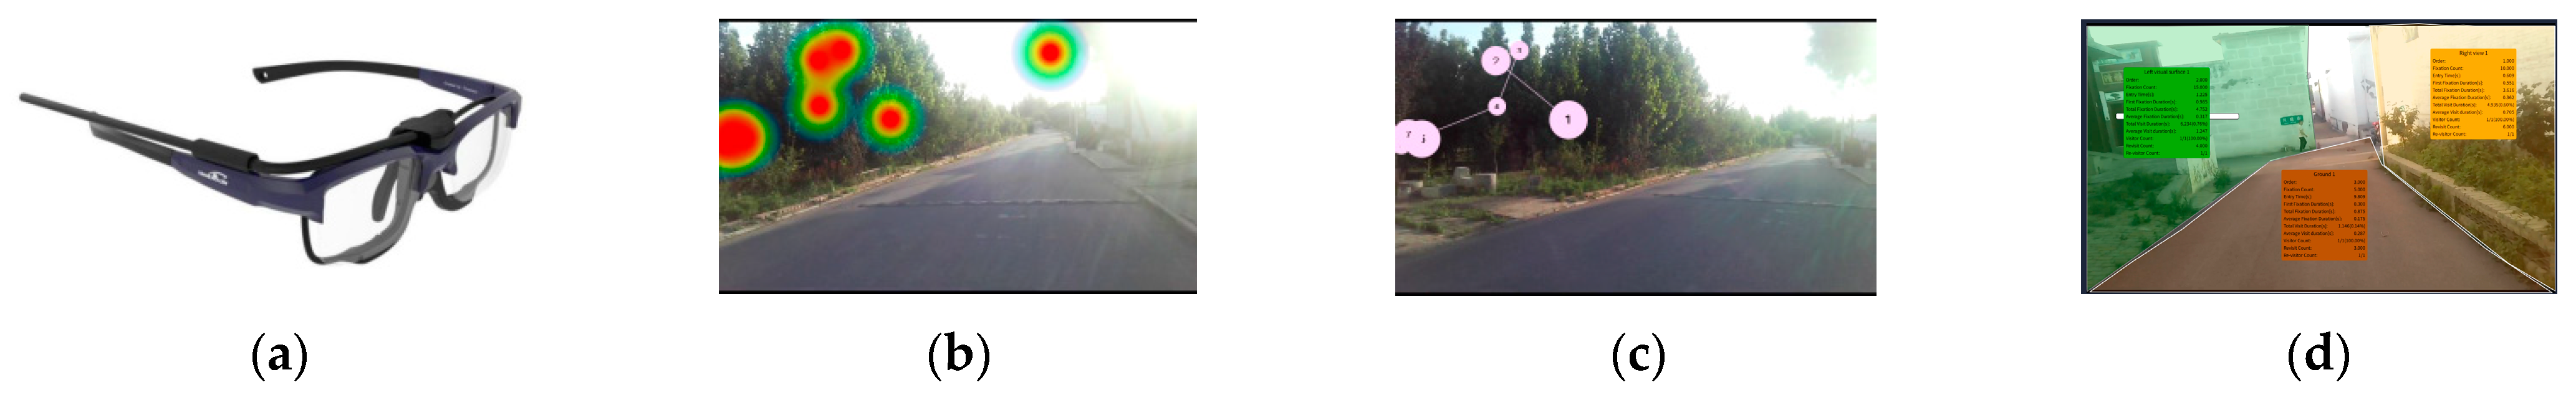
Figure 2.
Test roadmap.
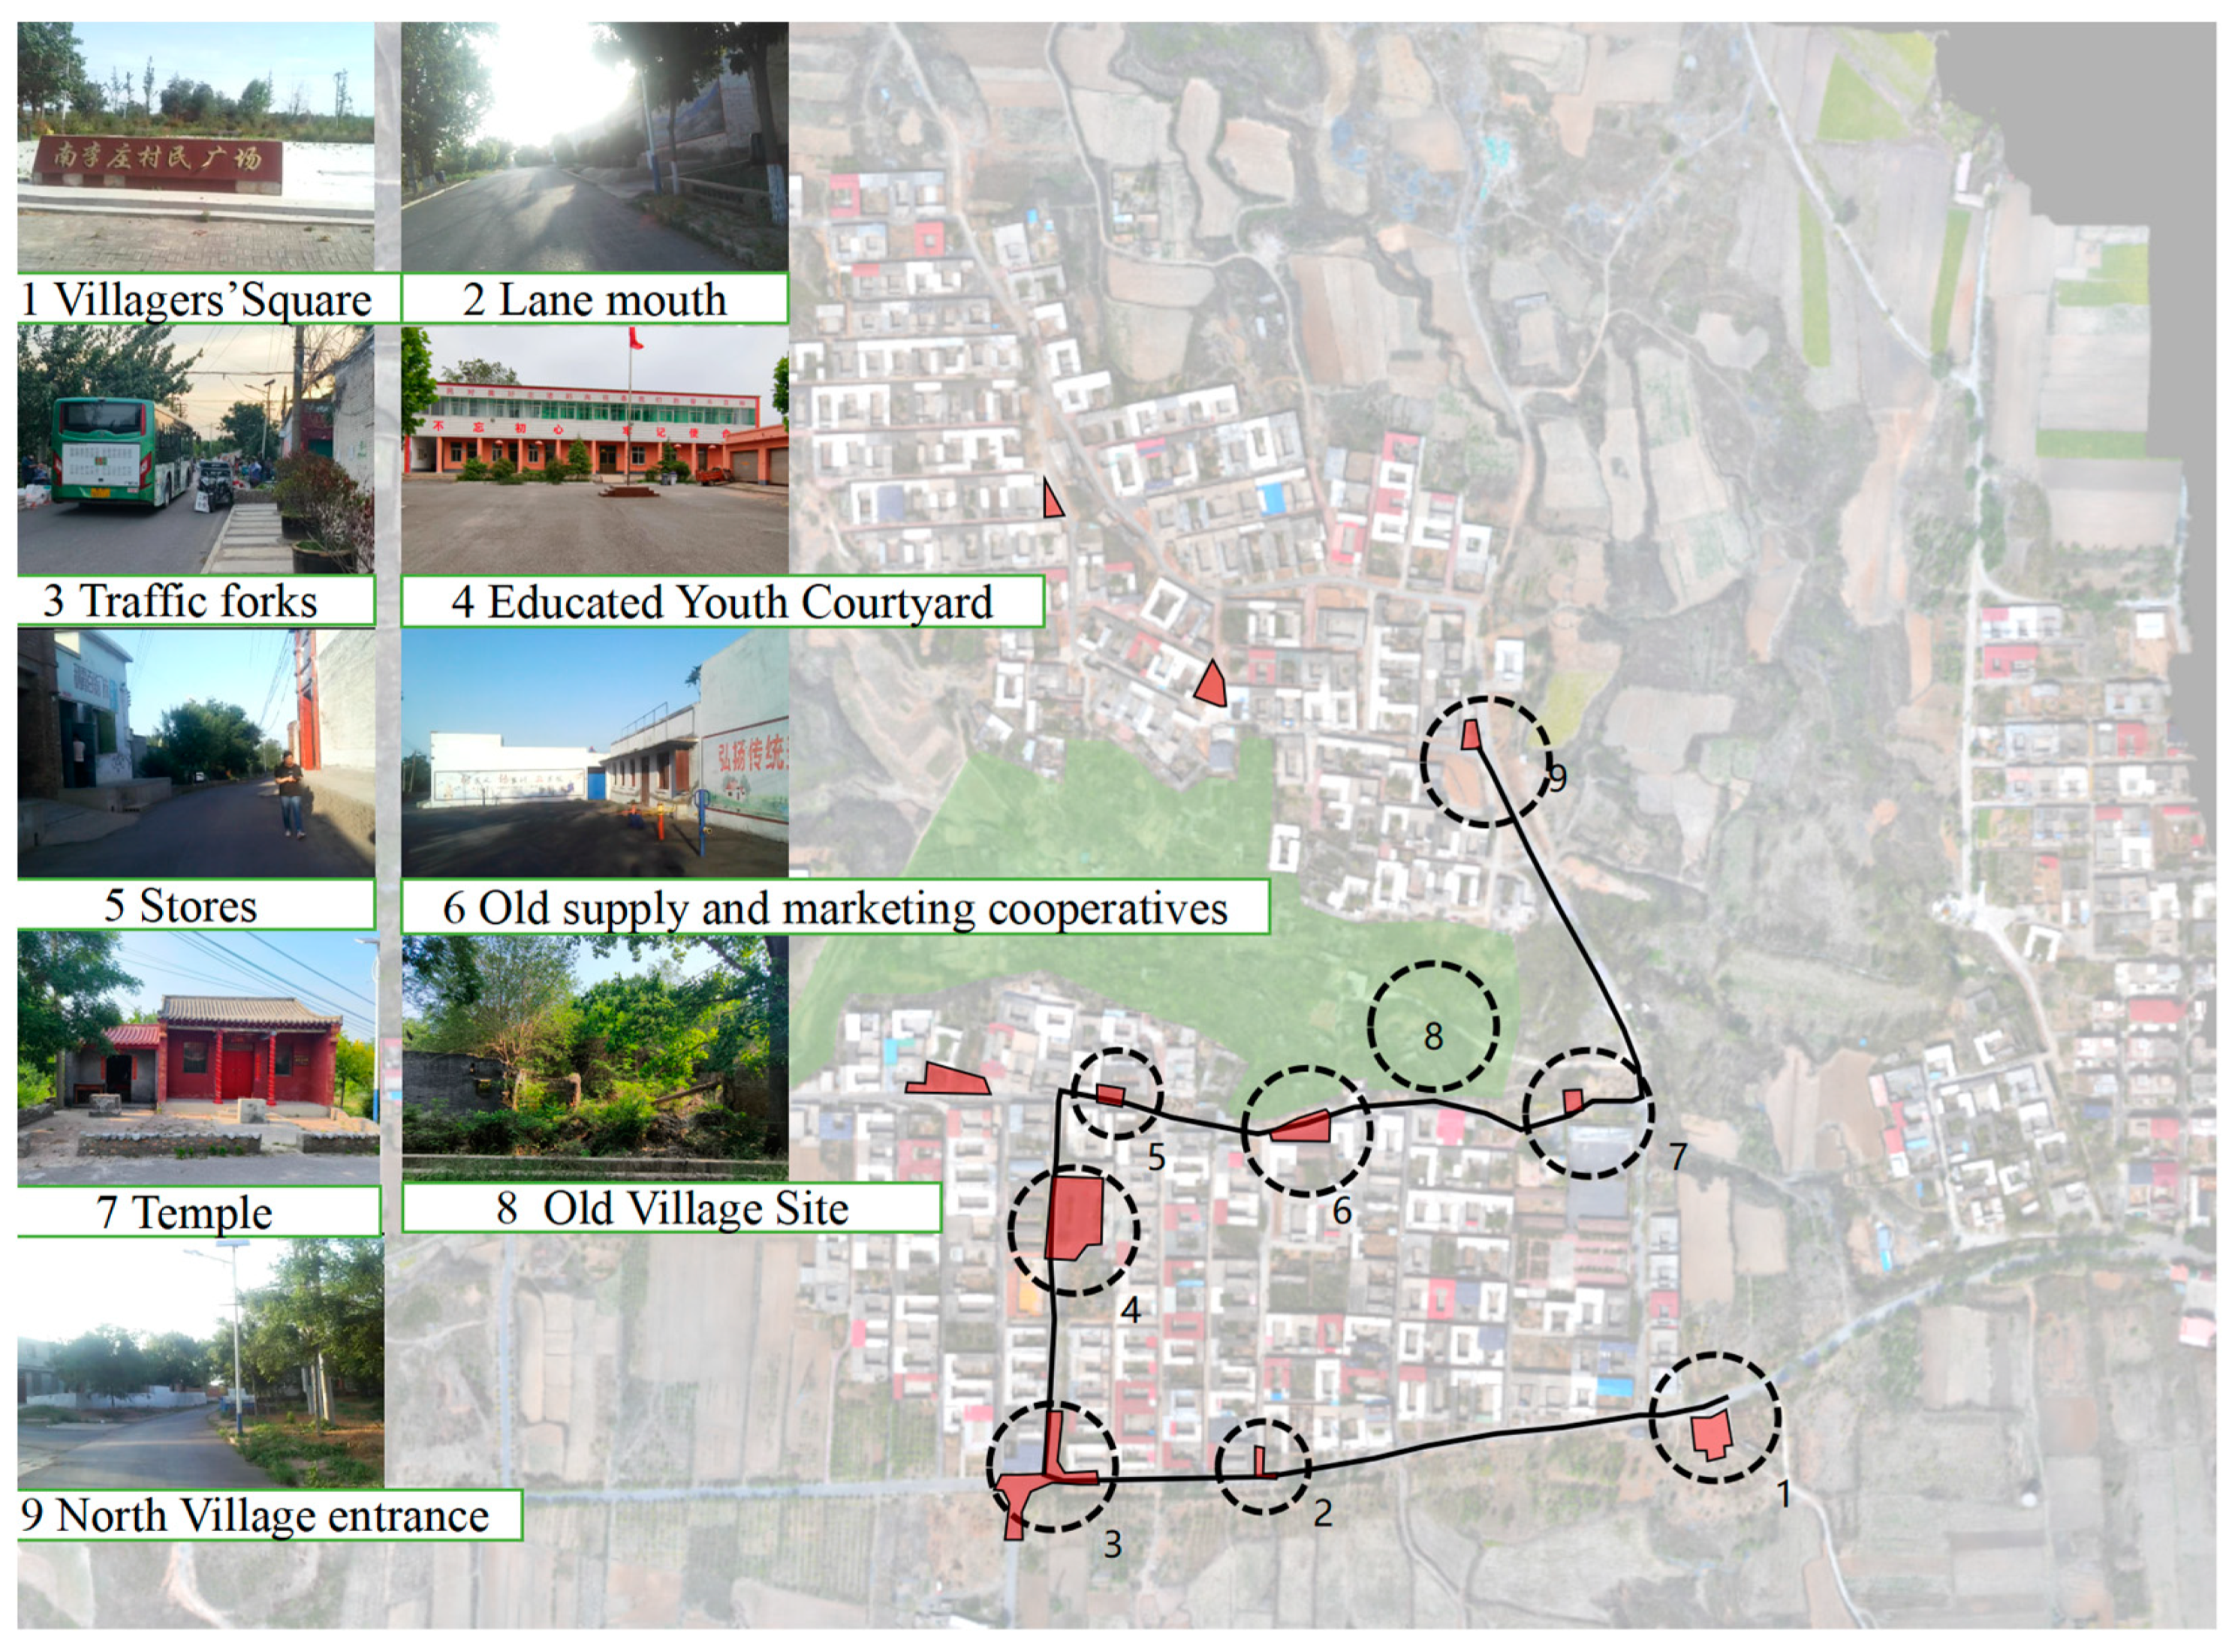
Figure 3.
Photos of subjects’ on-site test.
Figure 3.
Photos of subjects’ on-site test.
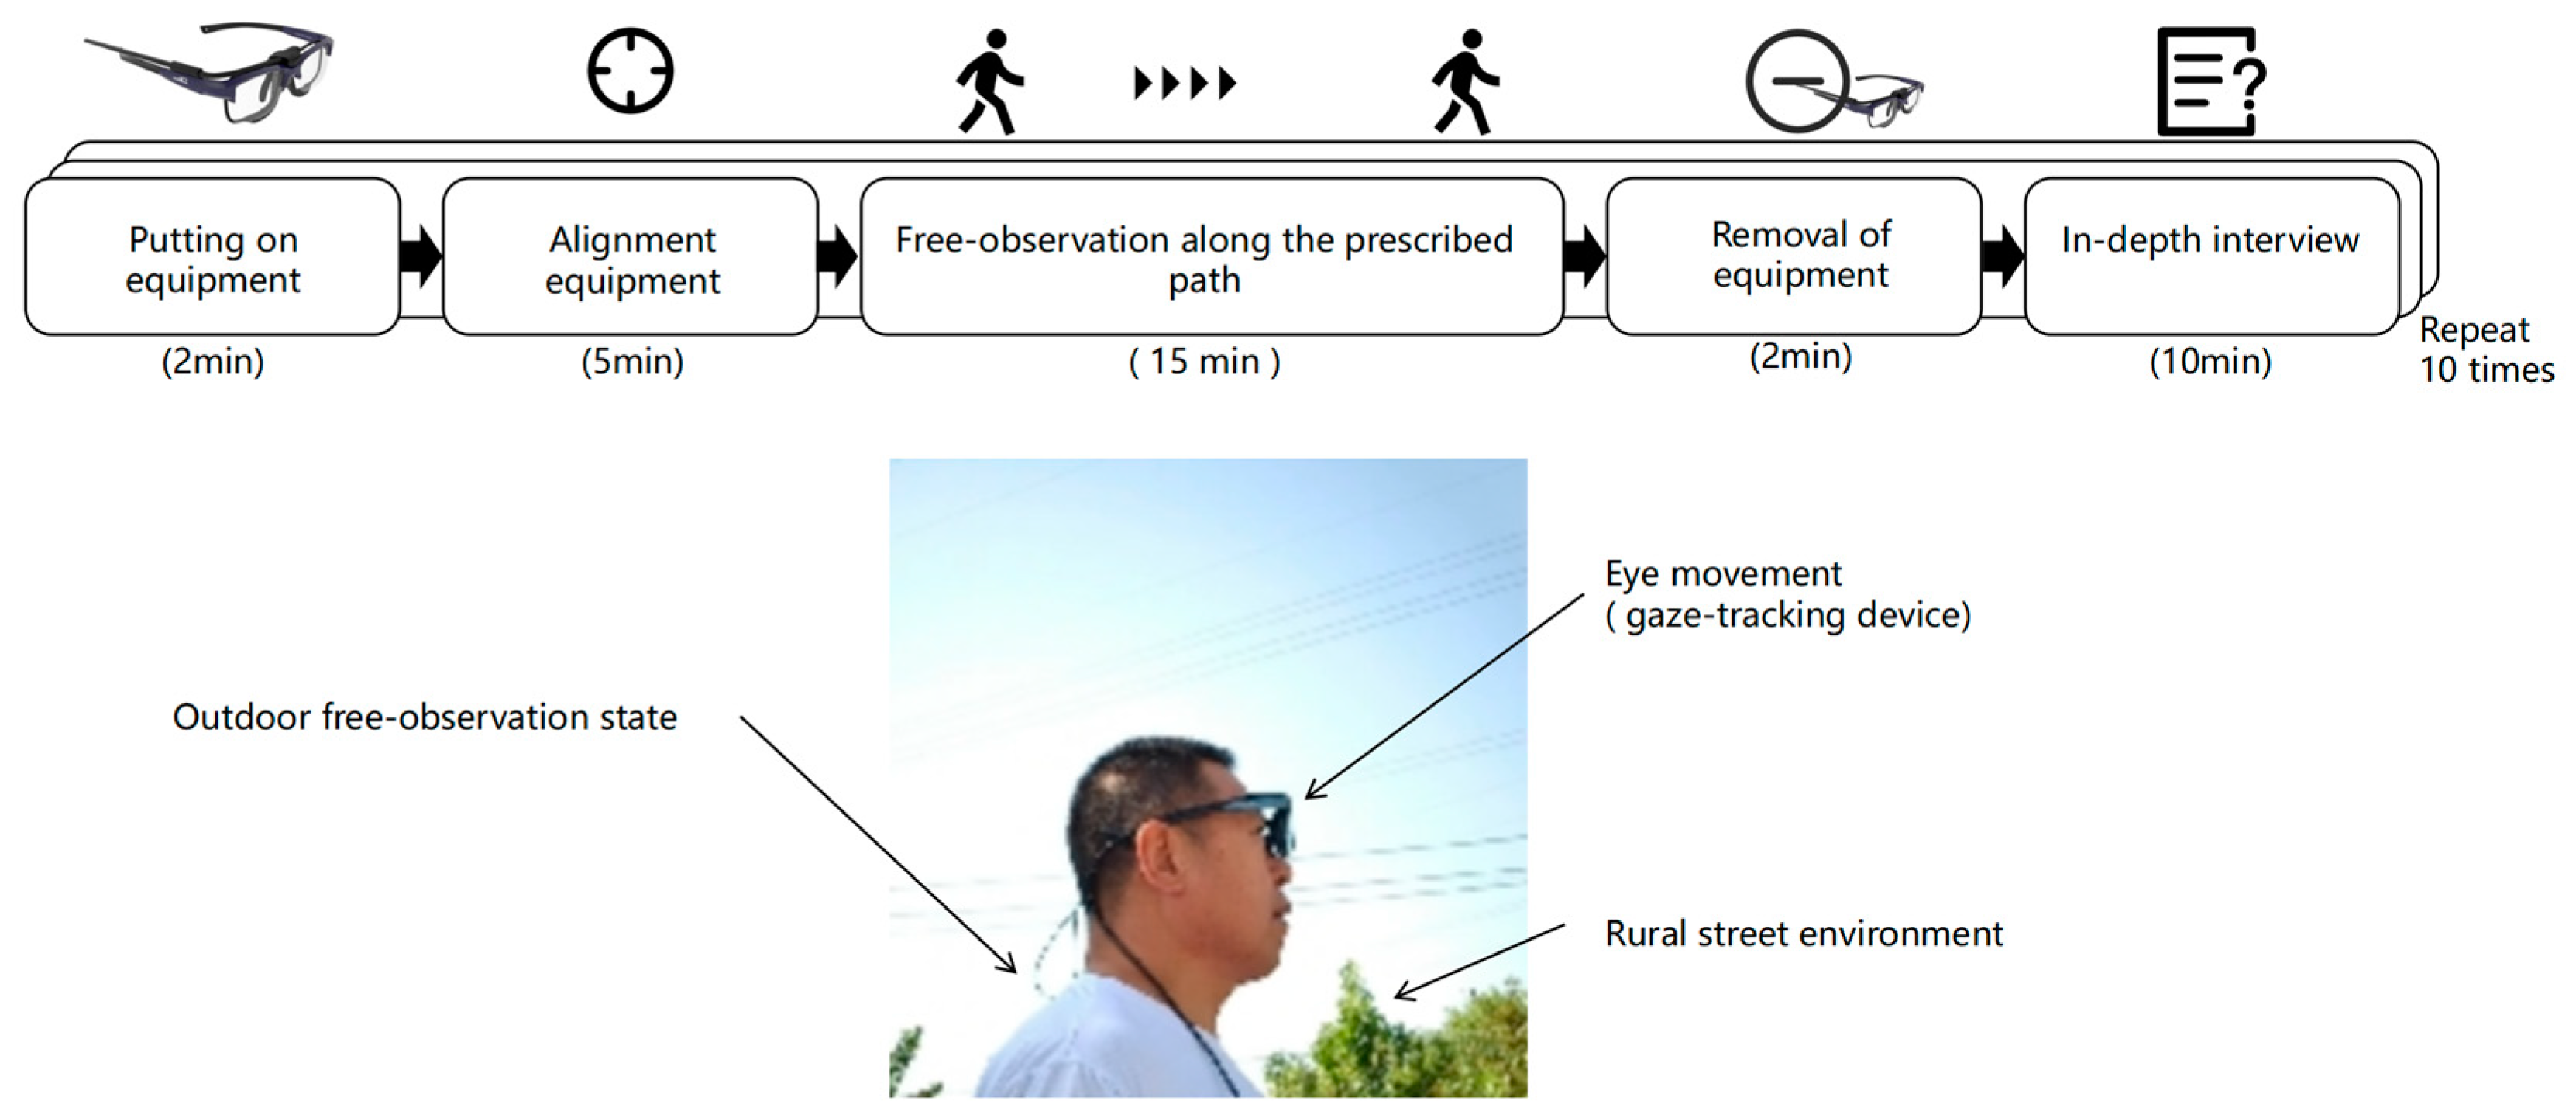
Figure 4.
Analysis method.
Figure 4.
Analysis method.
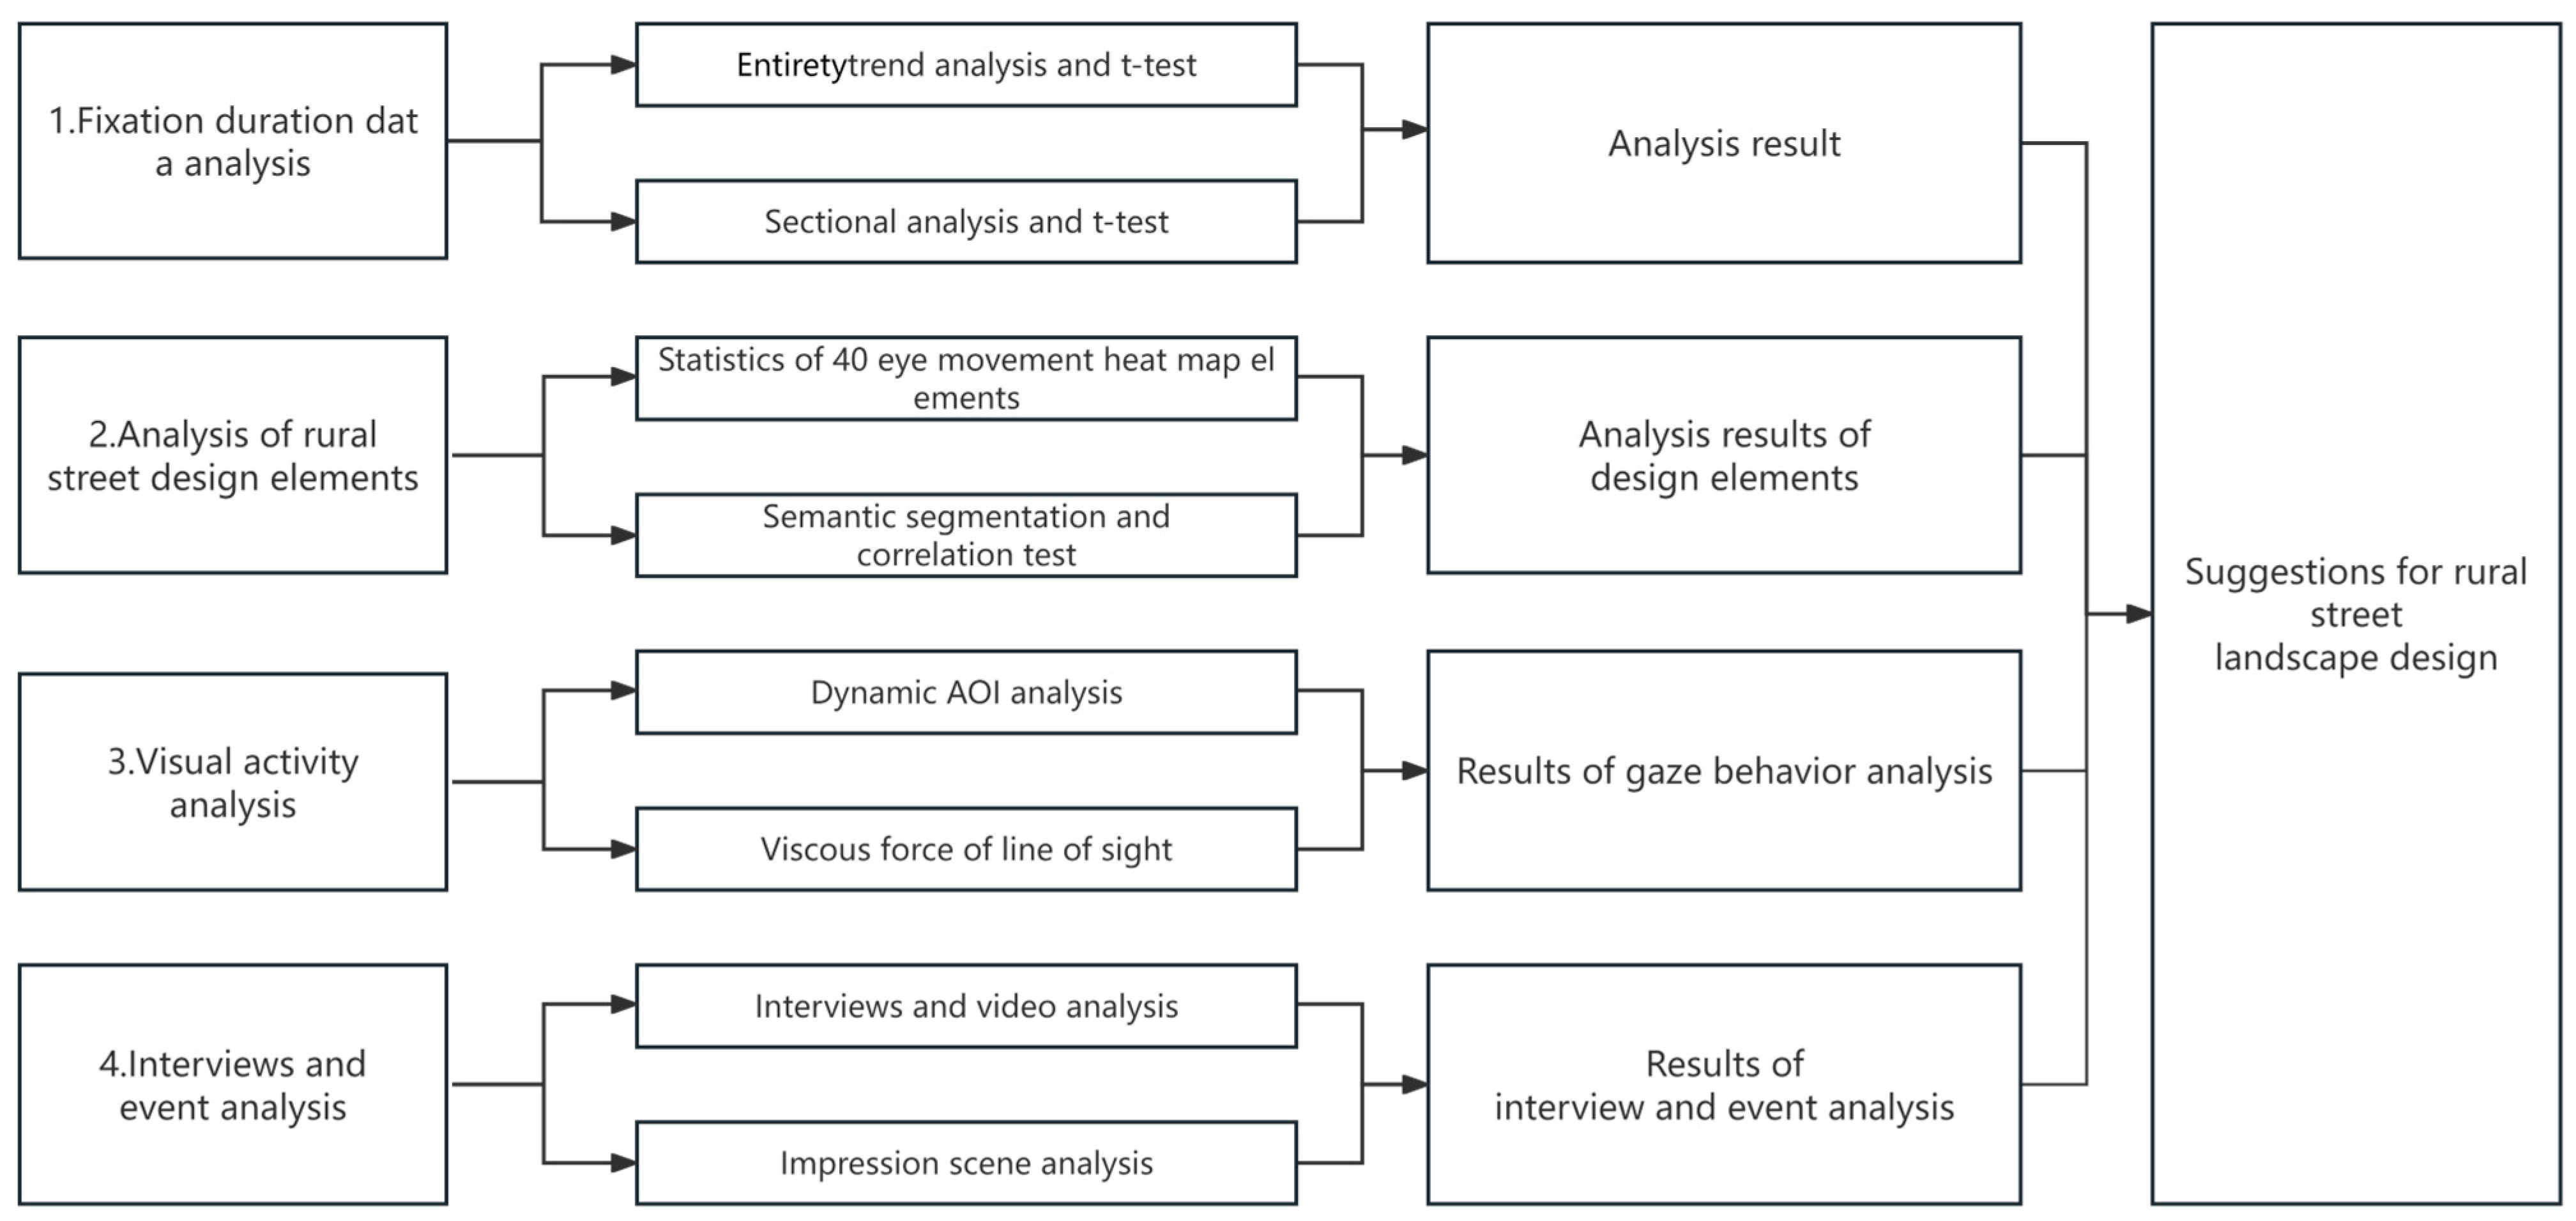
Figure 5.
Custom (dynamic) AOI.
Figure 5.
Custom (dynamic) AOI.
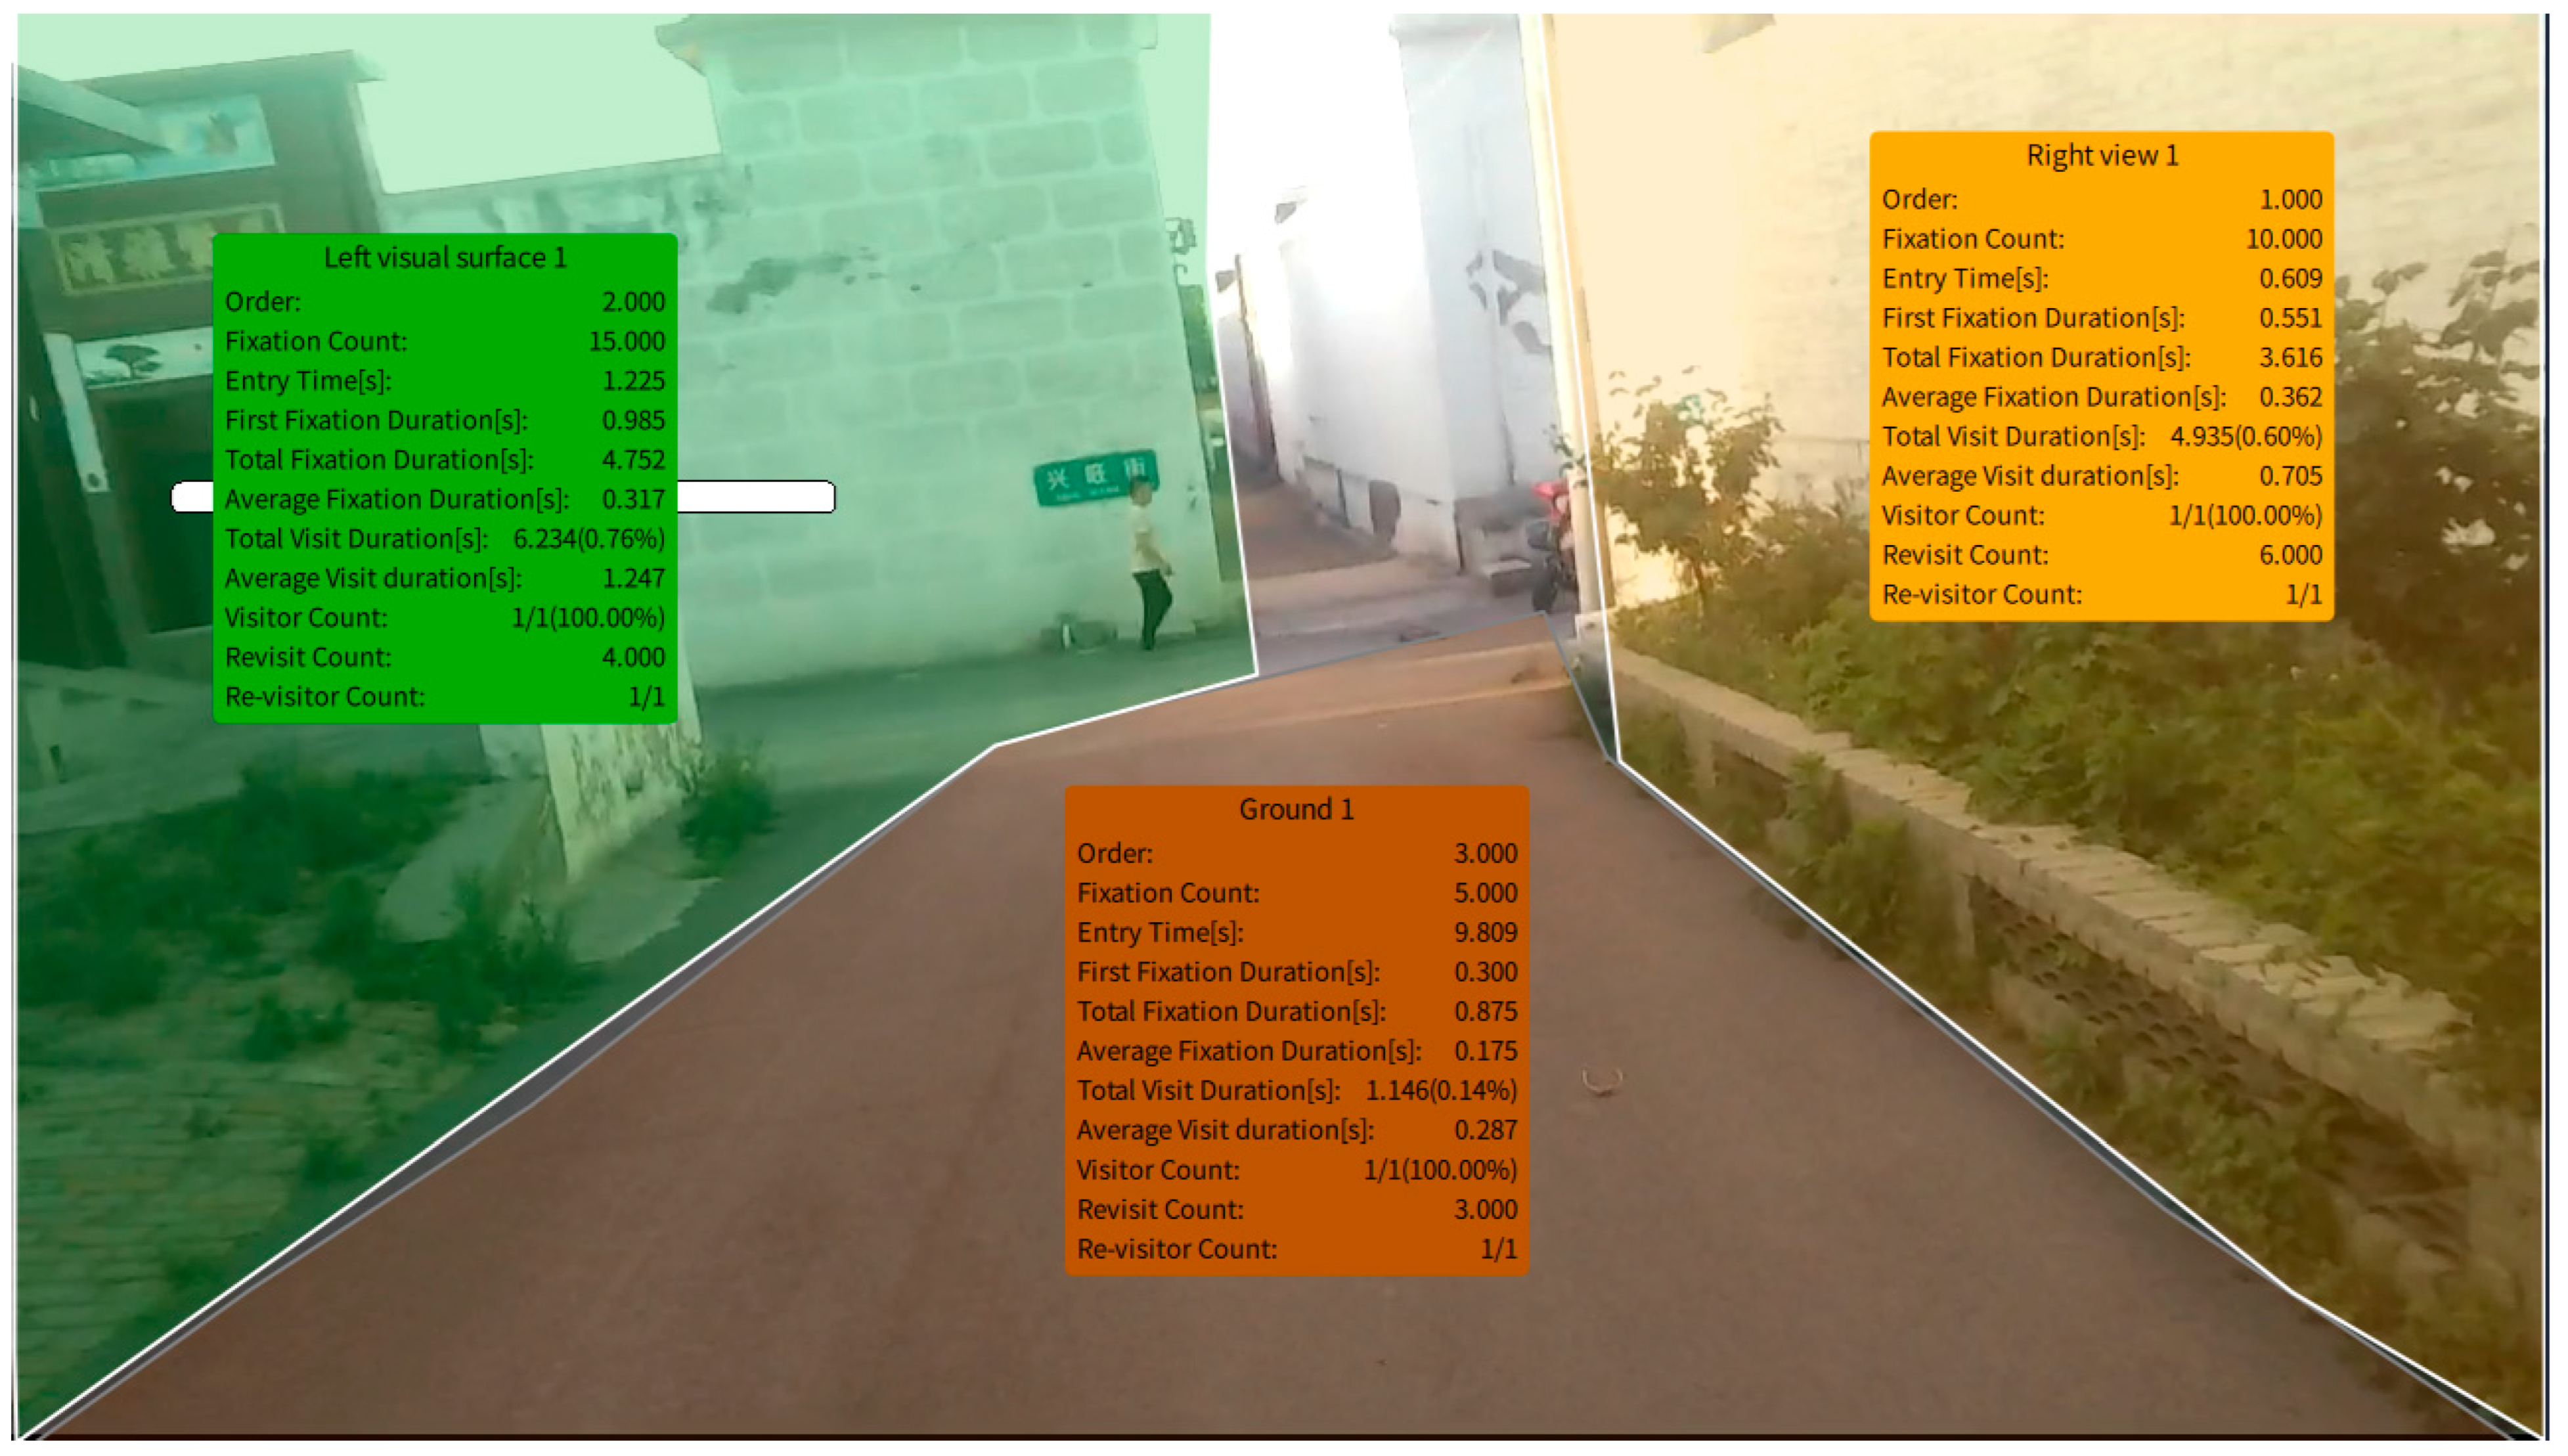
Figure 6.
Three types of street interfaces and their locations.
Figure 6.
Three types of street interfaces and their locations.
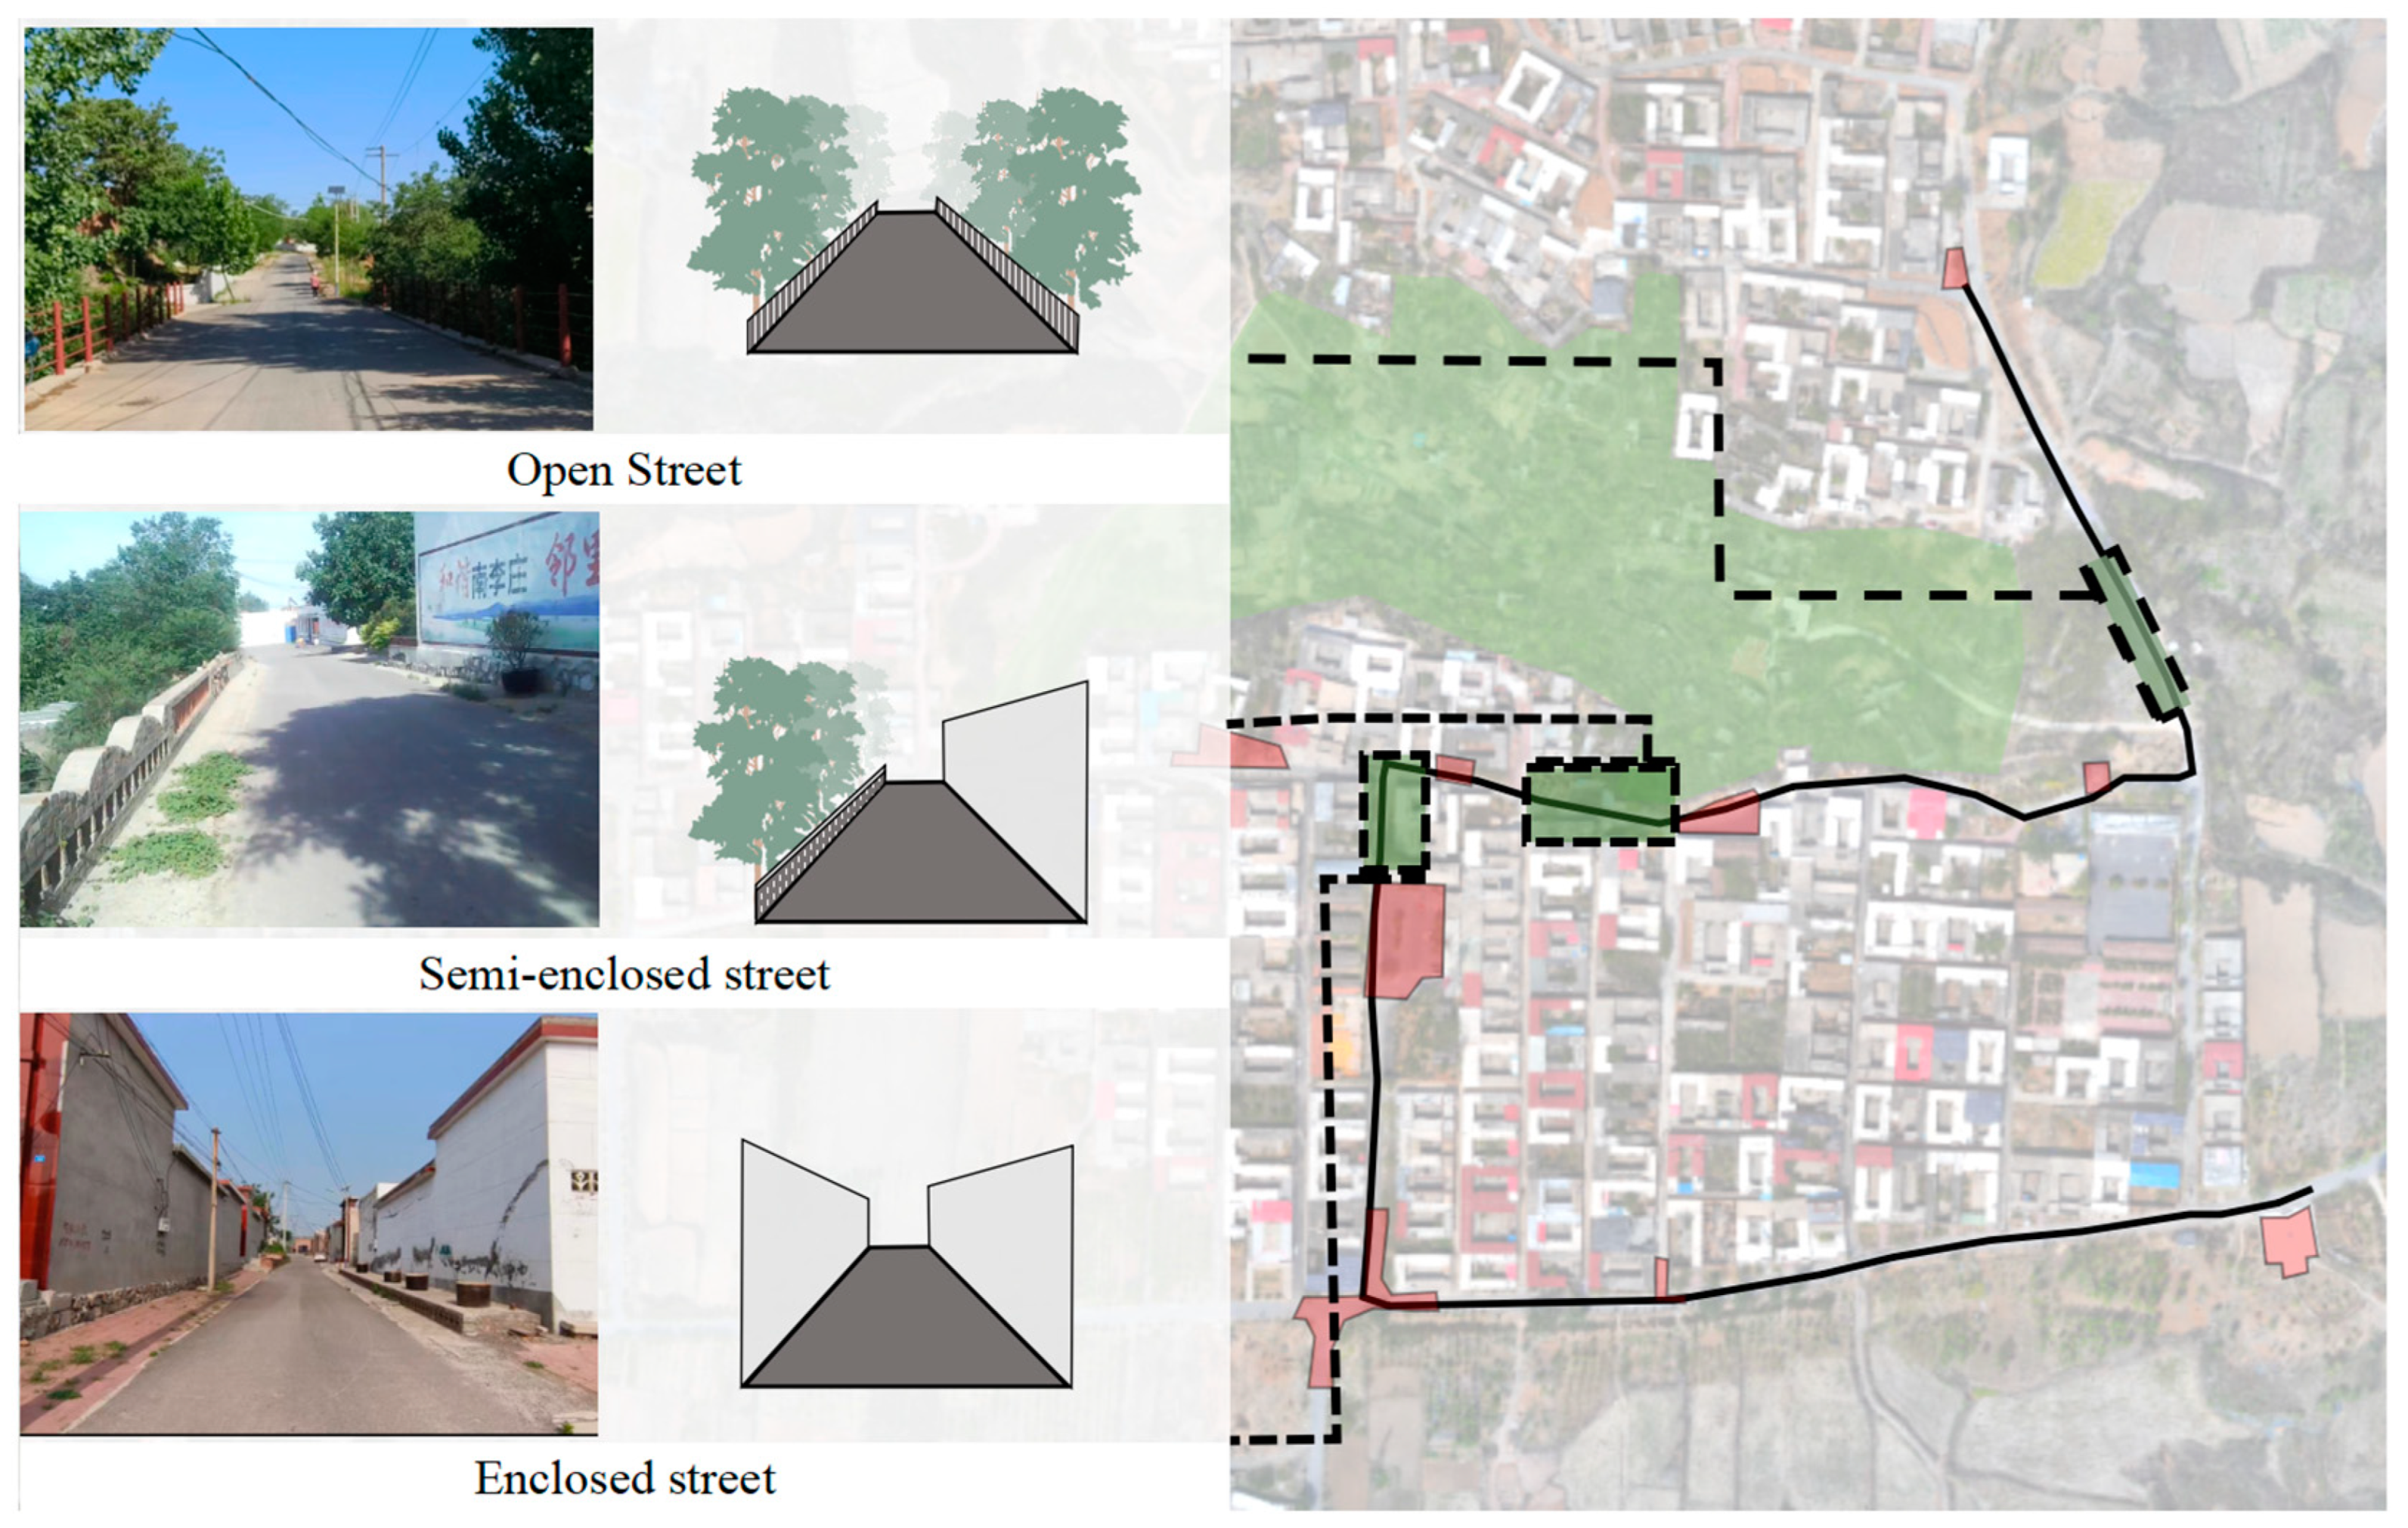
Figure 7.
Significant difference in the t-test results of the villagers and the tourists in the overall scene. (*** p ≤ 0.001).
Figure 7.
Significant difference in the t-test results of the villagers and the tourists in the overall scene. (*** p ≤ 0.001).
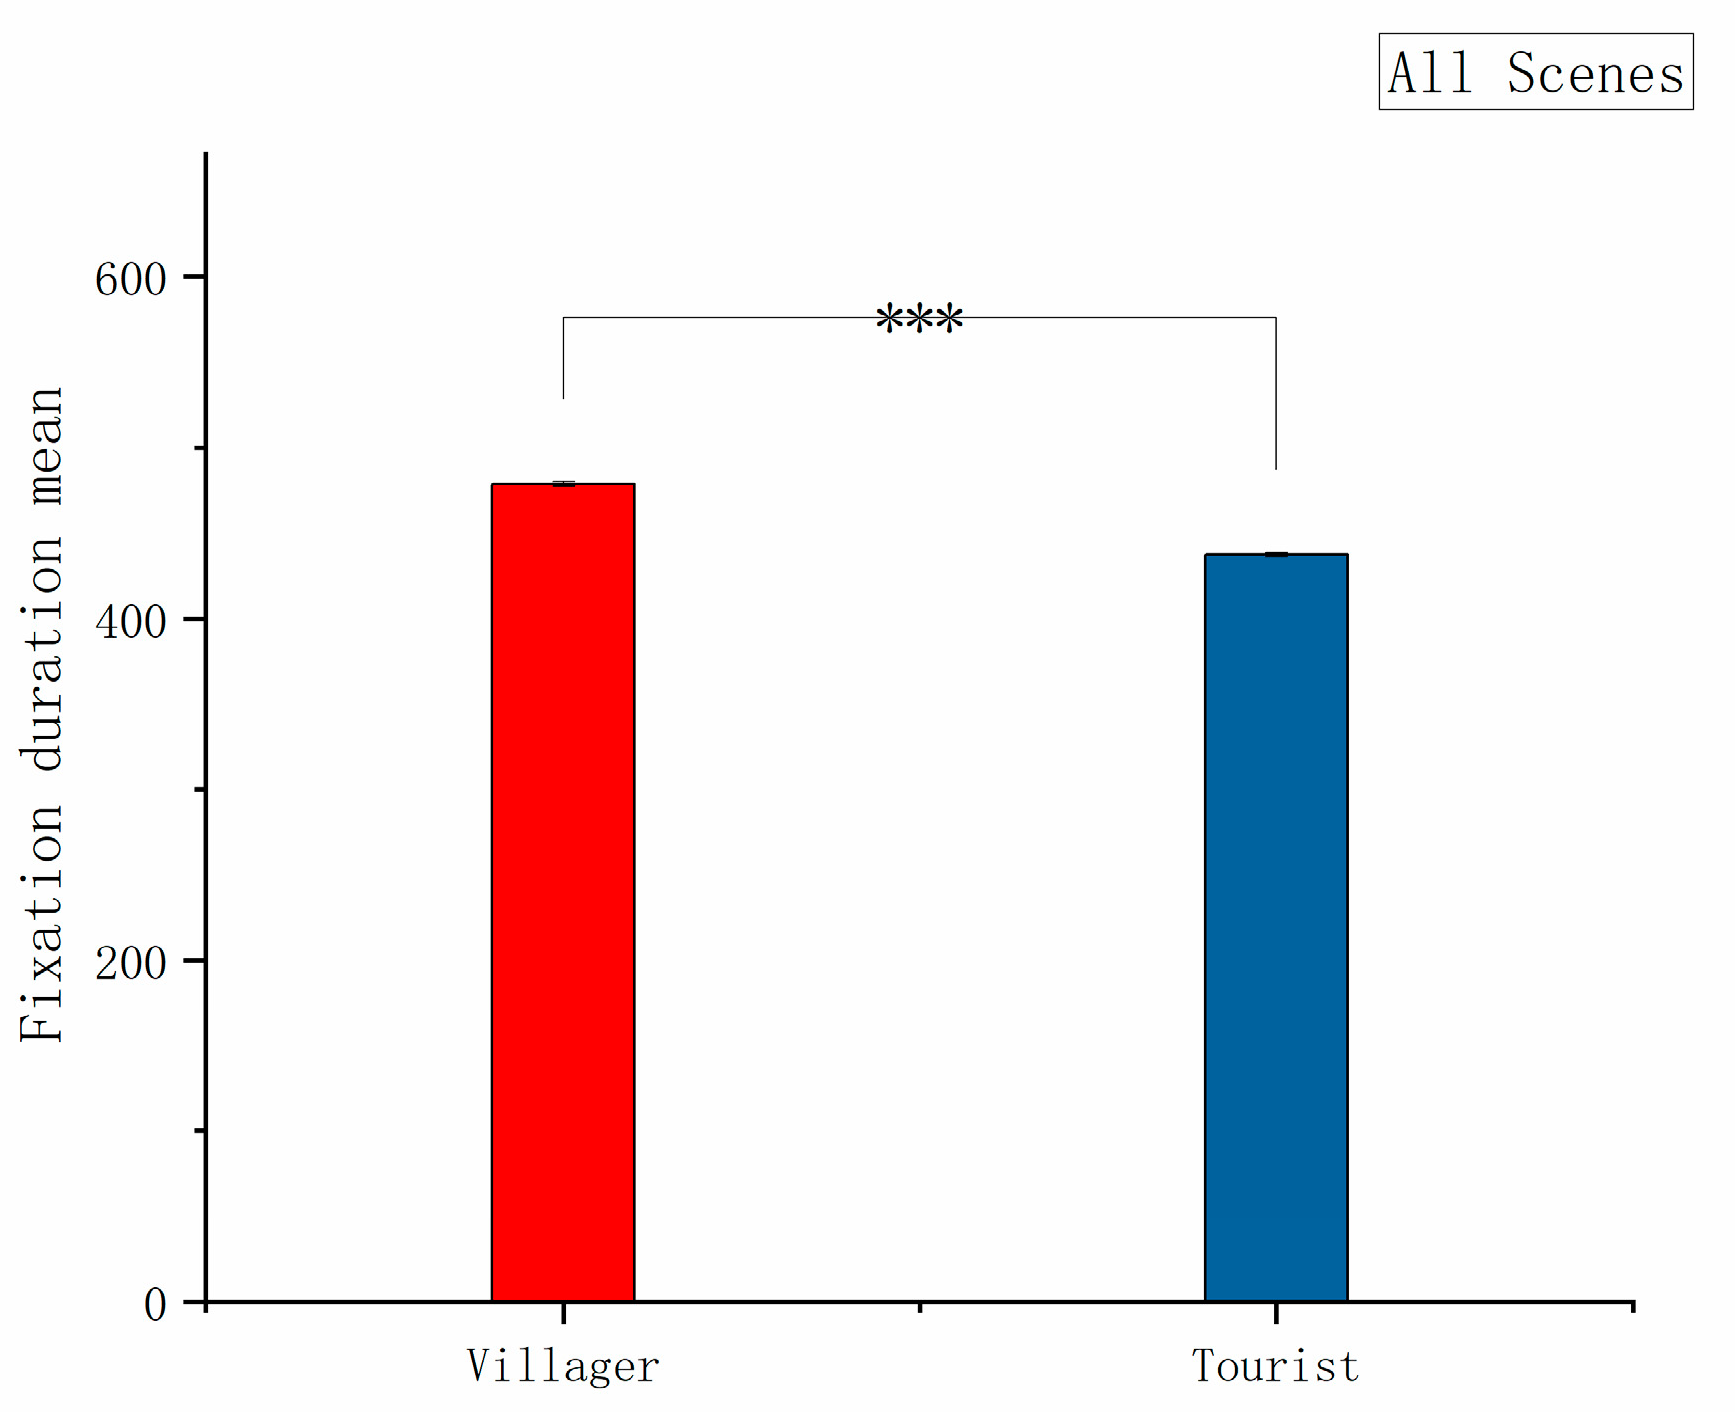
Figure 8.
The t-test results of villagers and tourists in scenes 1, 2, and 3 were significantly different. (*** p ≤ 0.001).
Figure 8.
The t-test results of villagers and tourists in scenes 1, 2, and 3 were significantly different. (*** p ≤ 0.001).
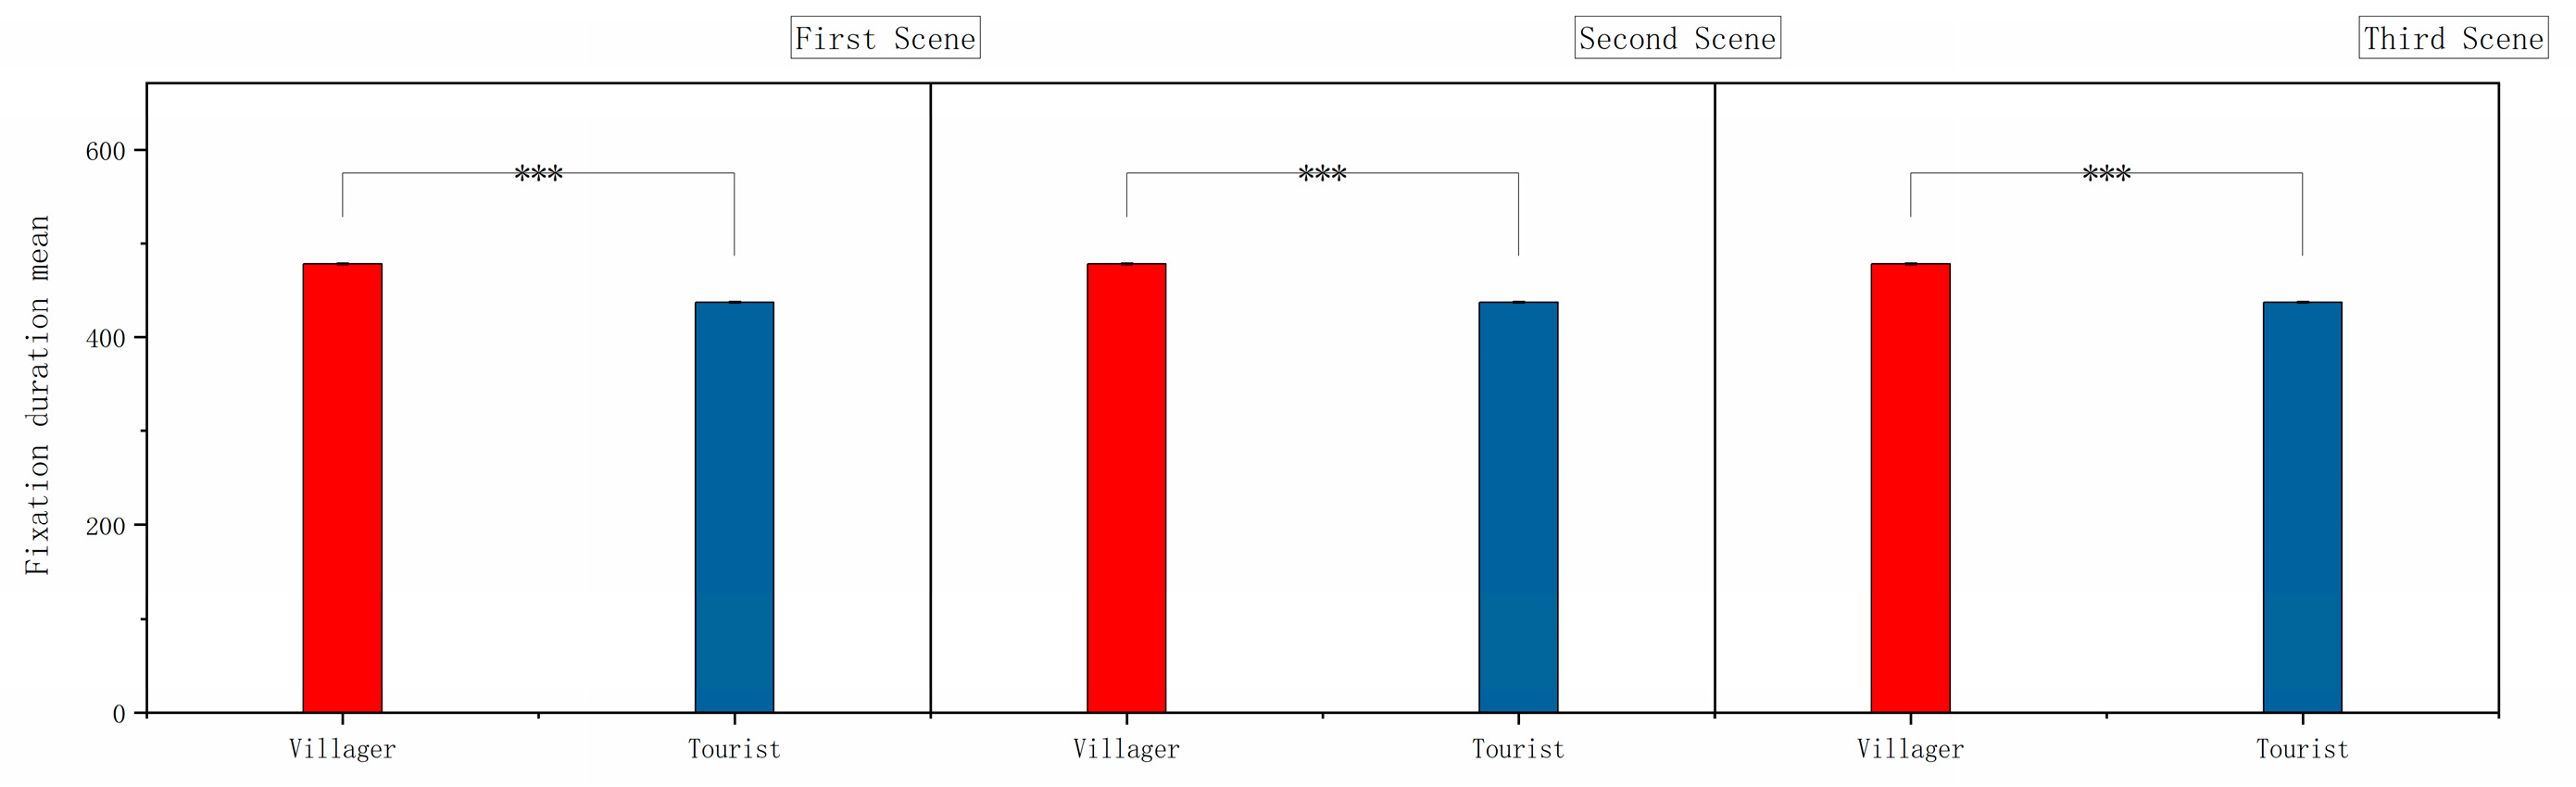
Figure 9.
The t-test results of villagers and tourists in scenes 4–7 were significantly different. (*** p ≤ 0.001).
Figure 9.
The t-test results of villagers and tourists in scenes 4–7 were significantly different. (*** p ≤ 0.001).
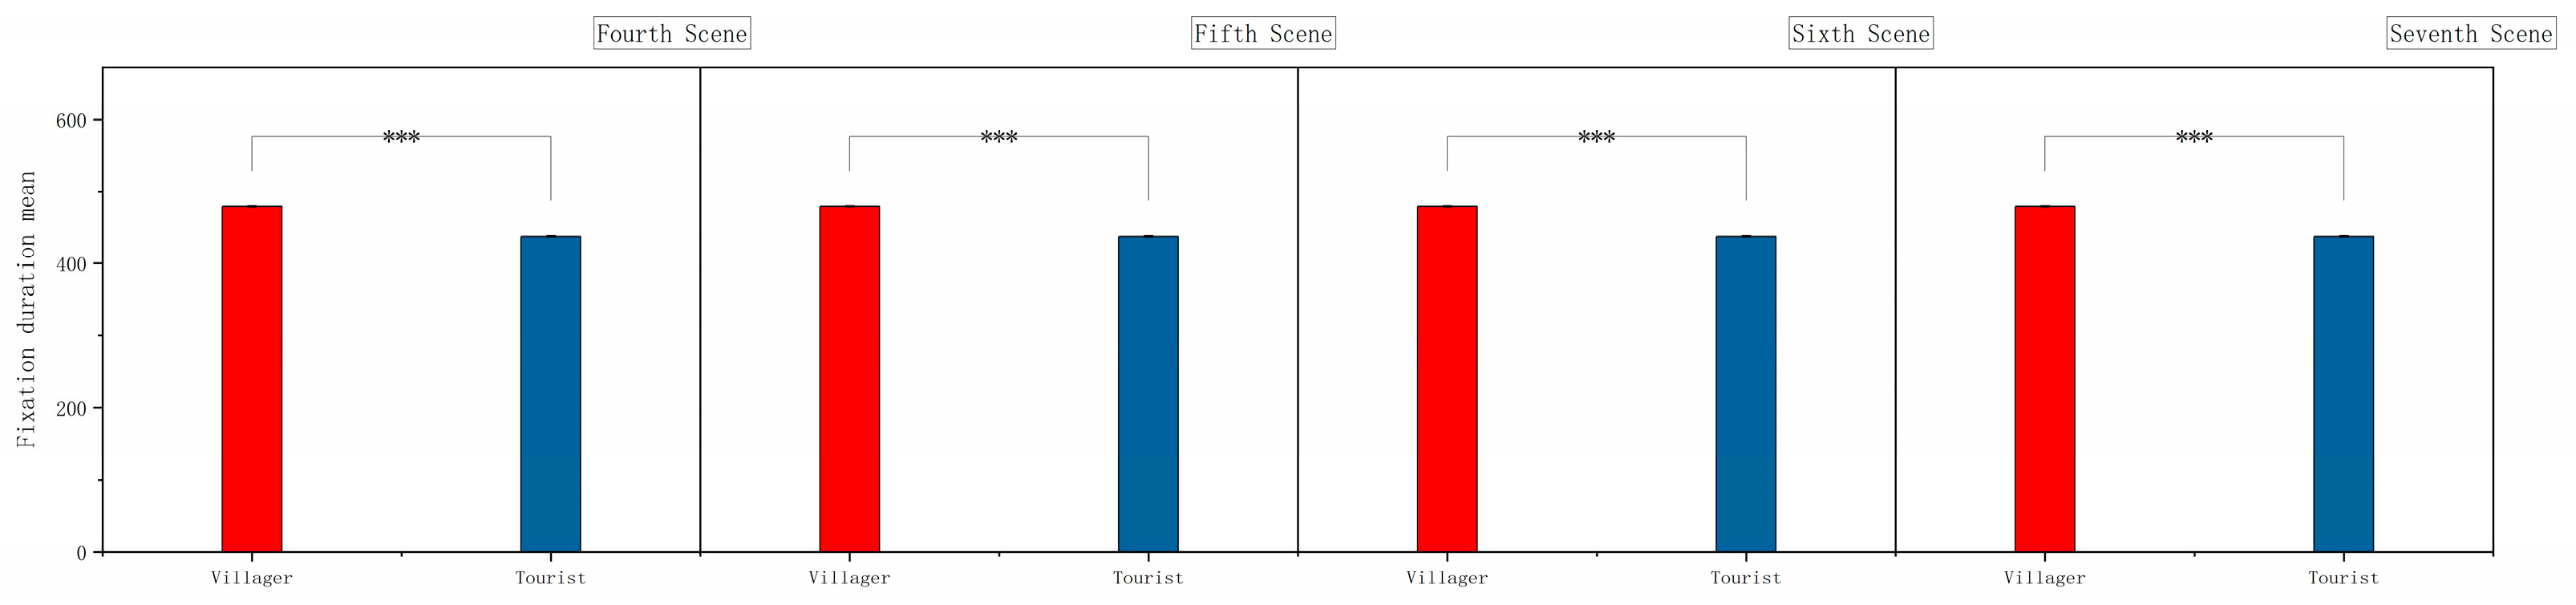
Figure 10.
Correlation analysis of fixation duration with greenery (p = 0.71116) and ground (p = −0.5658).
Figure 10.
Correlation analysis of fixation duration with greenery (p = 0.71116) and ground (p = −0.5658).
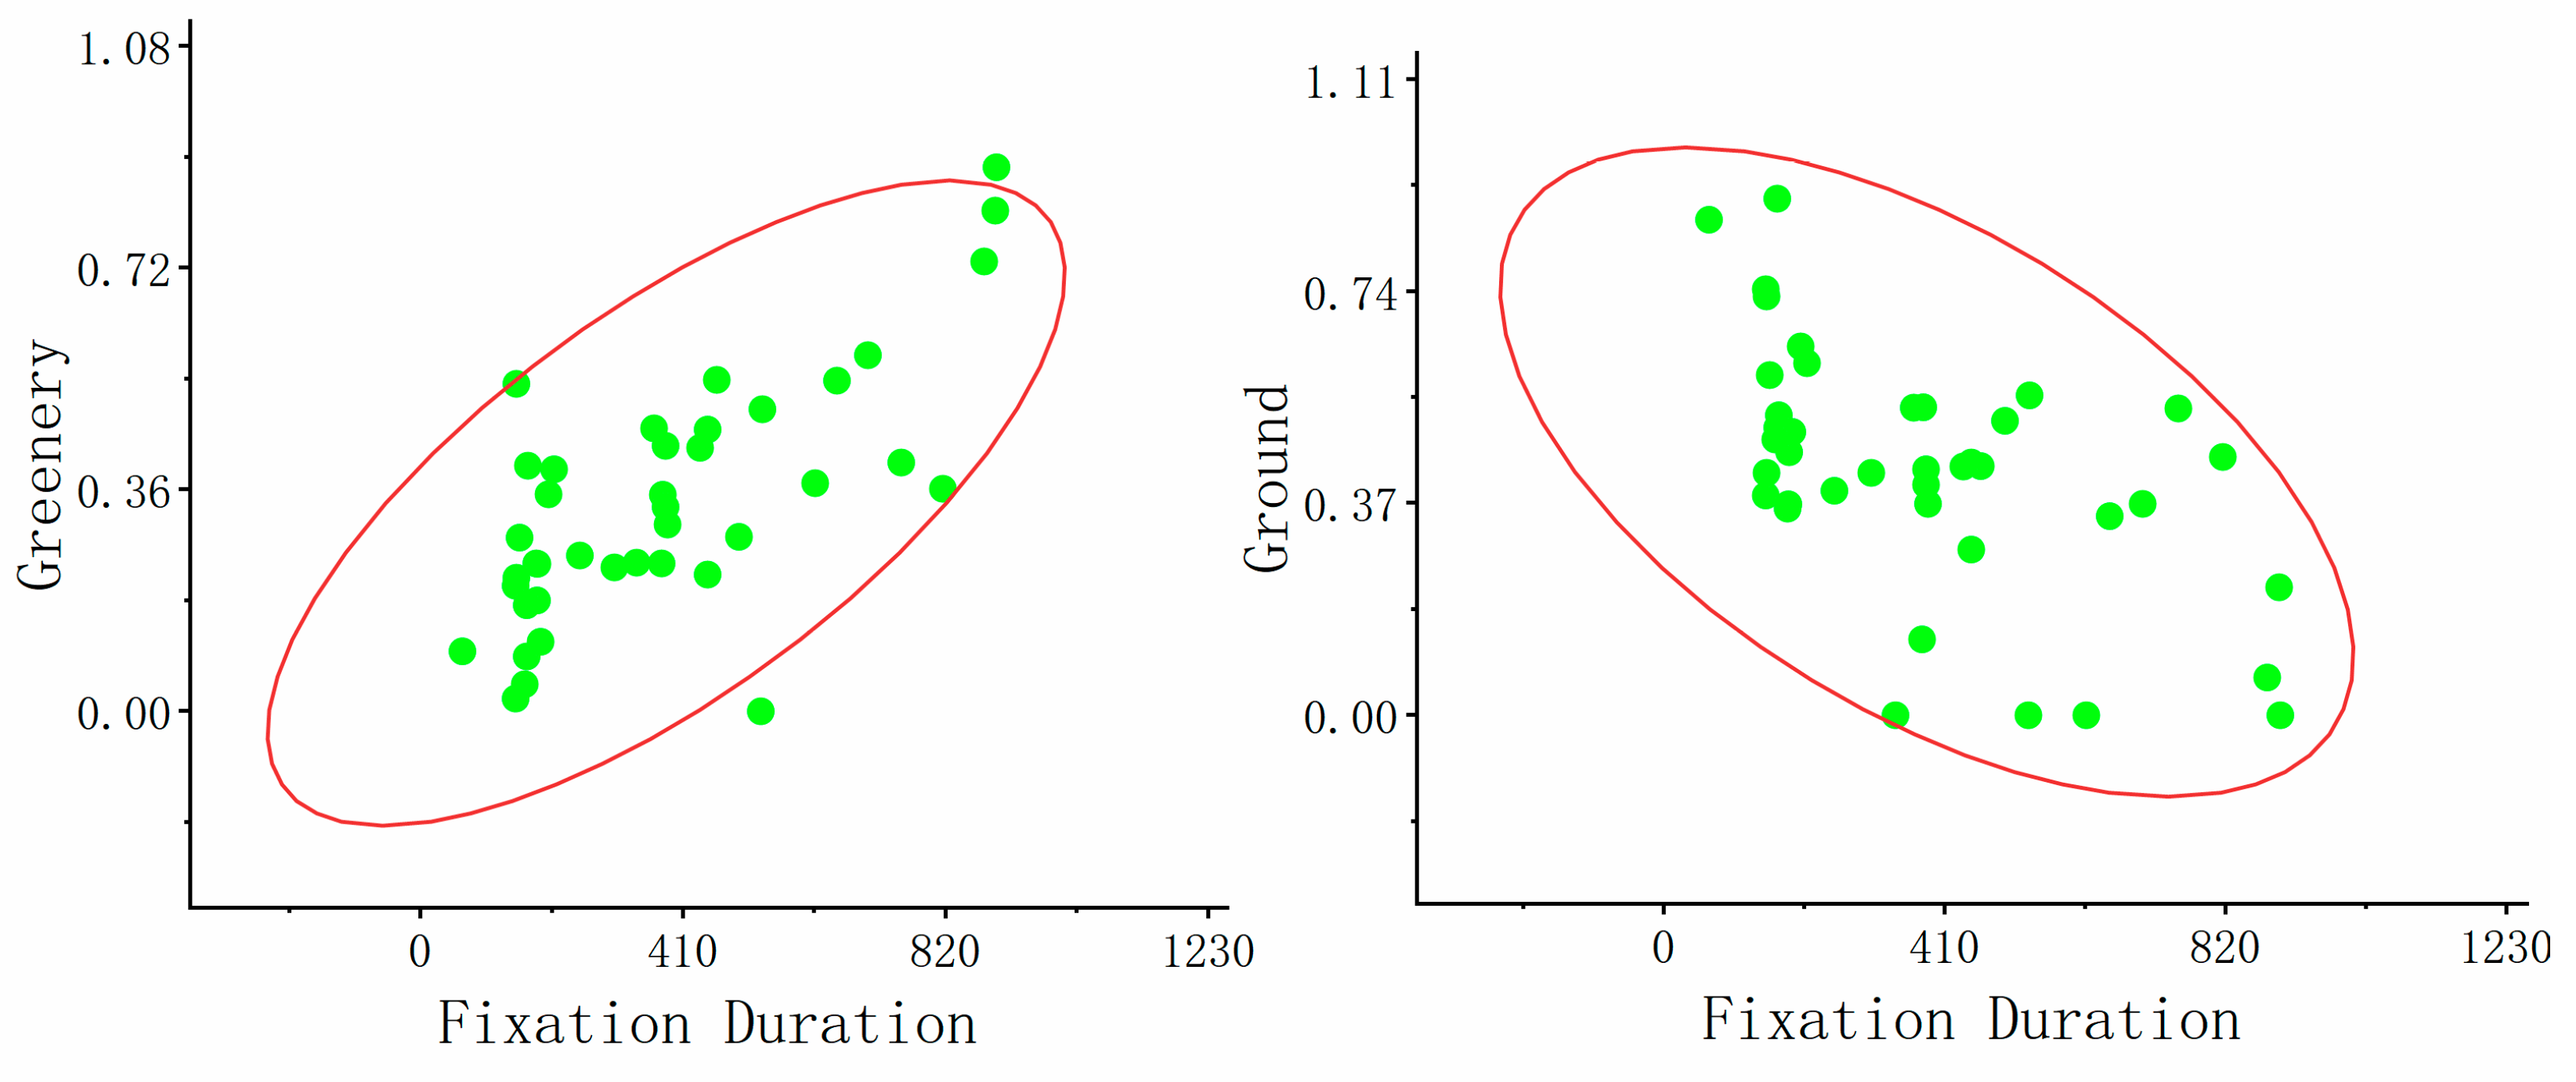
Figure 11.
AOI dynamic analysis (a) and line-of-sight heat map (b) and trajectory map (c).
Figure 11.
AOI dynamic analysis (a) and line-of-sight heat map (b) and trajectory map (c).
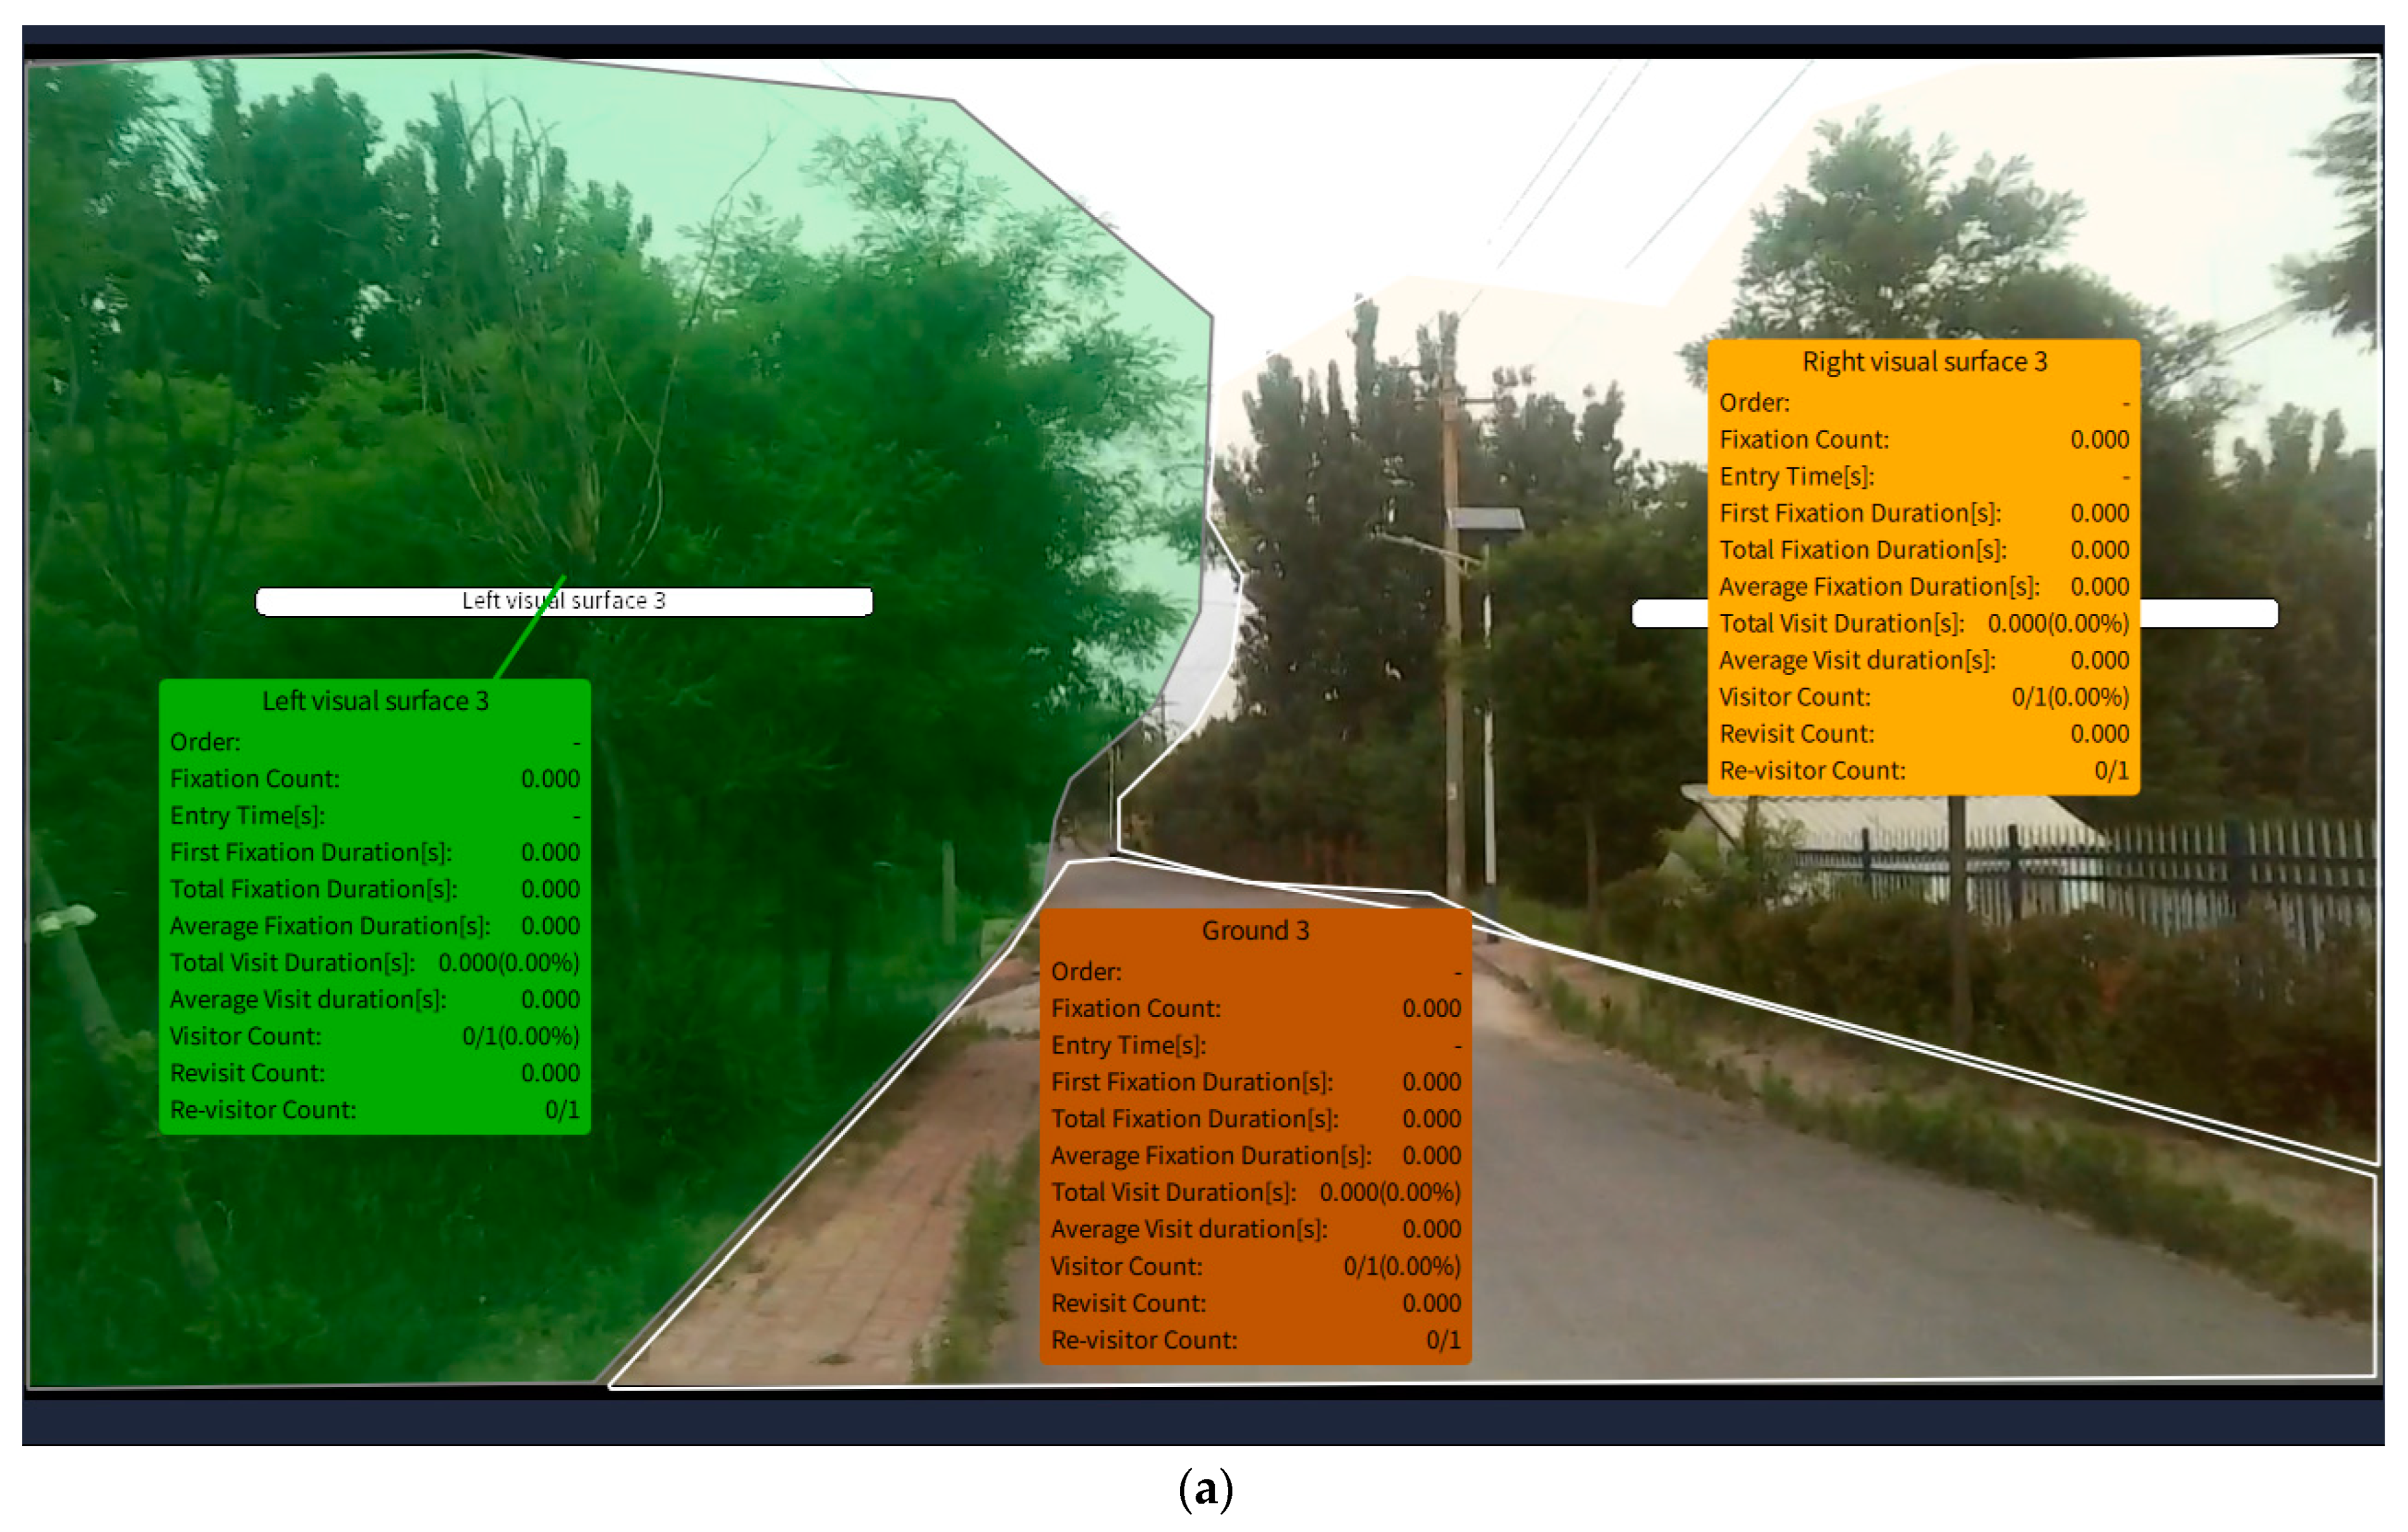
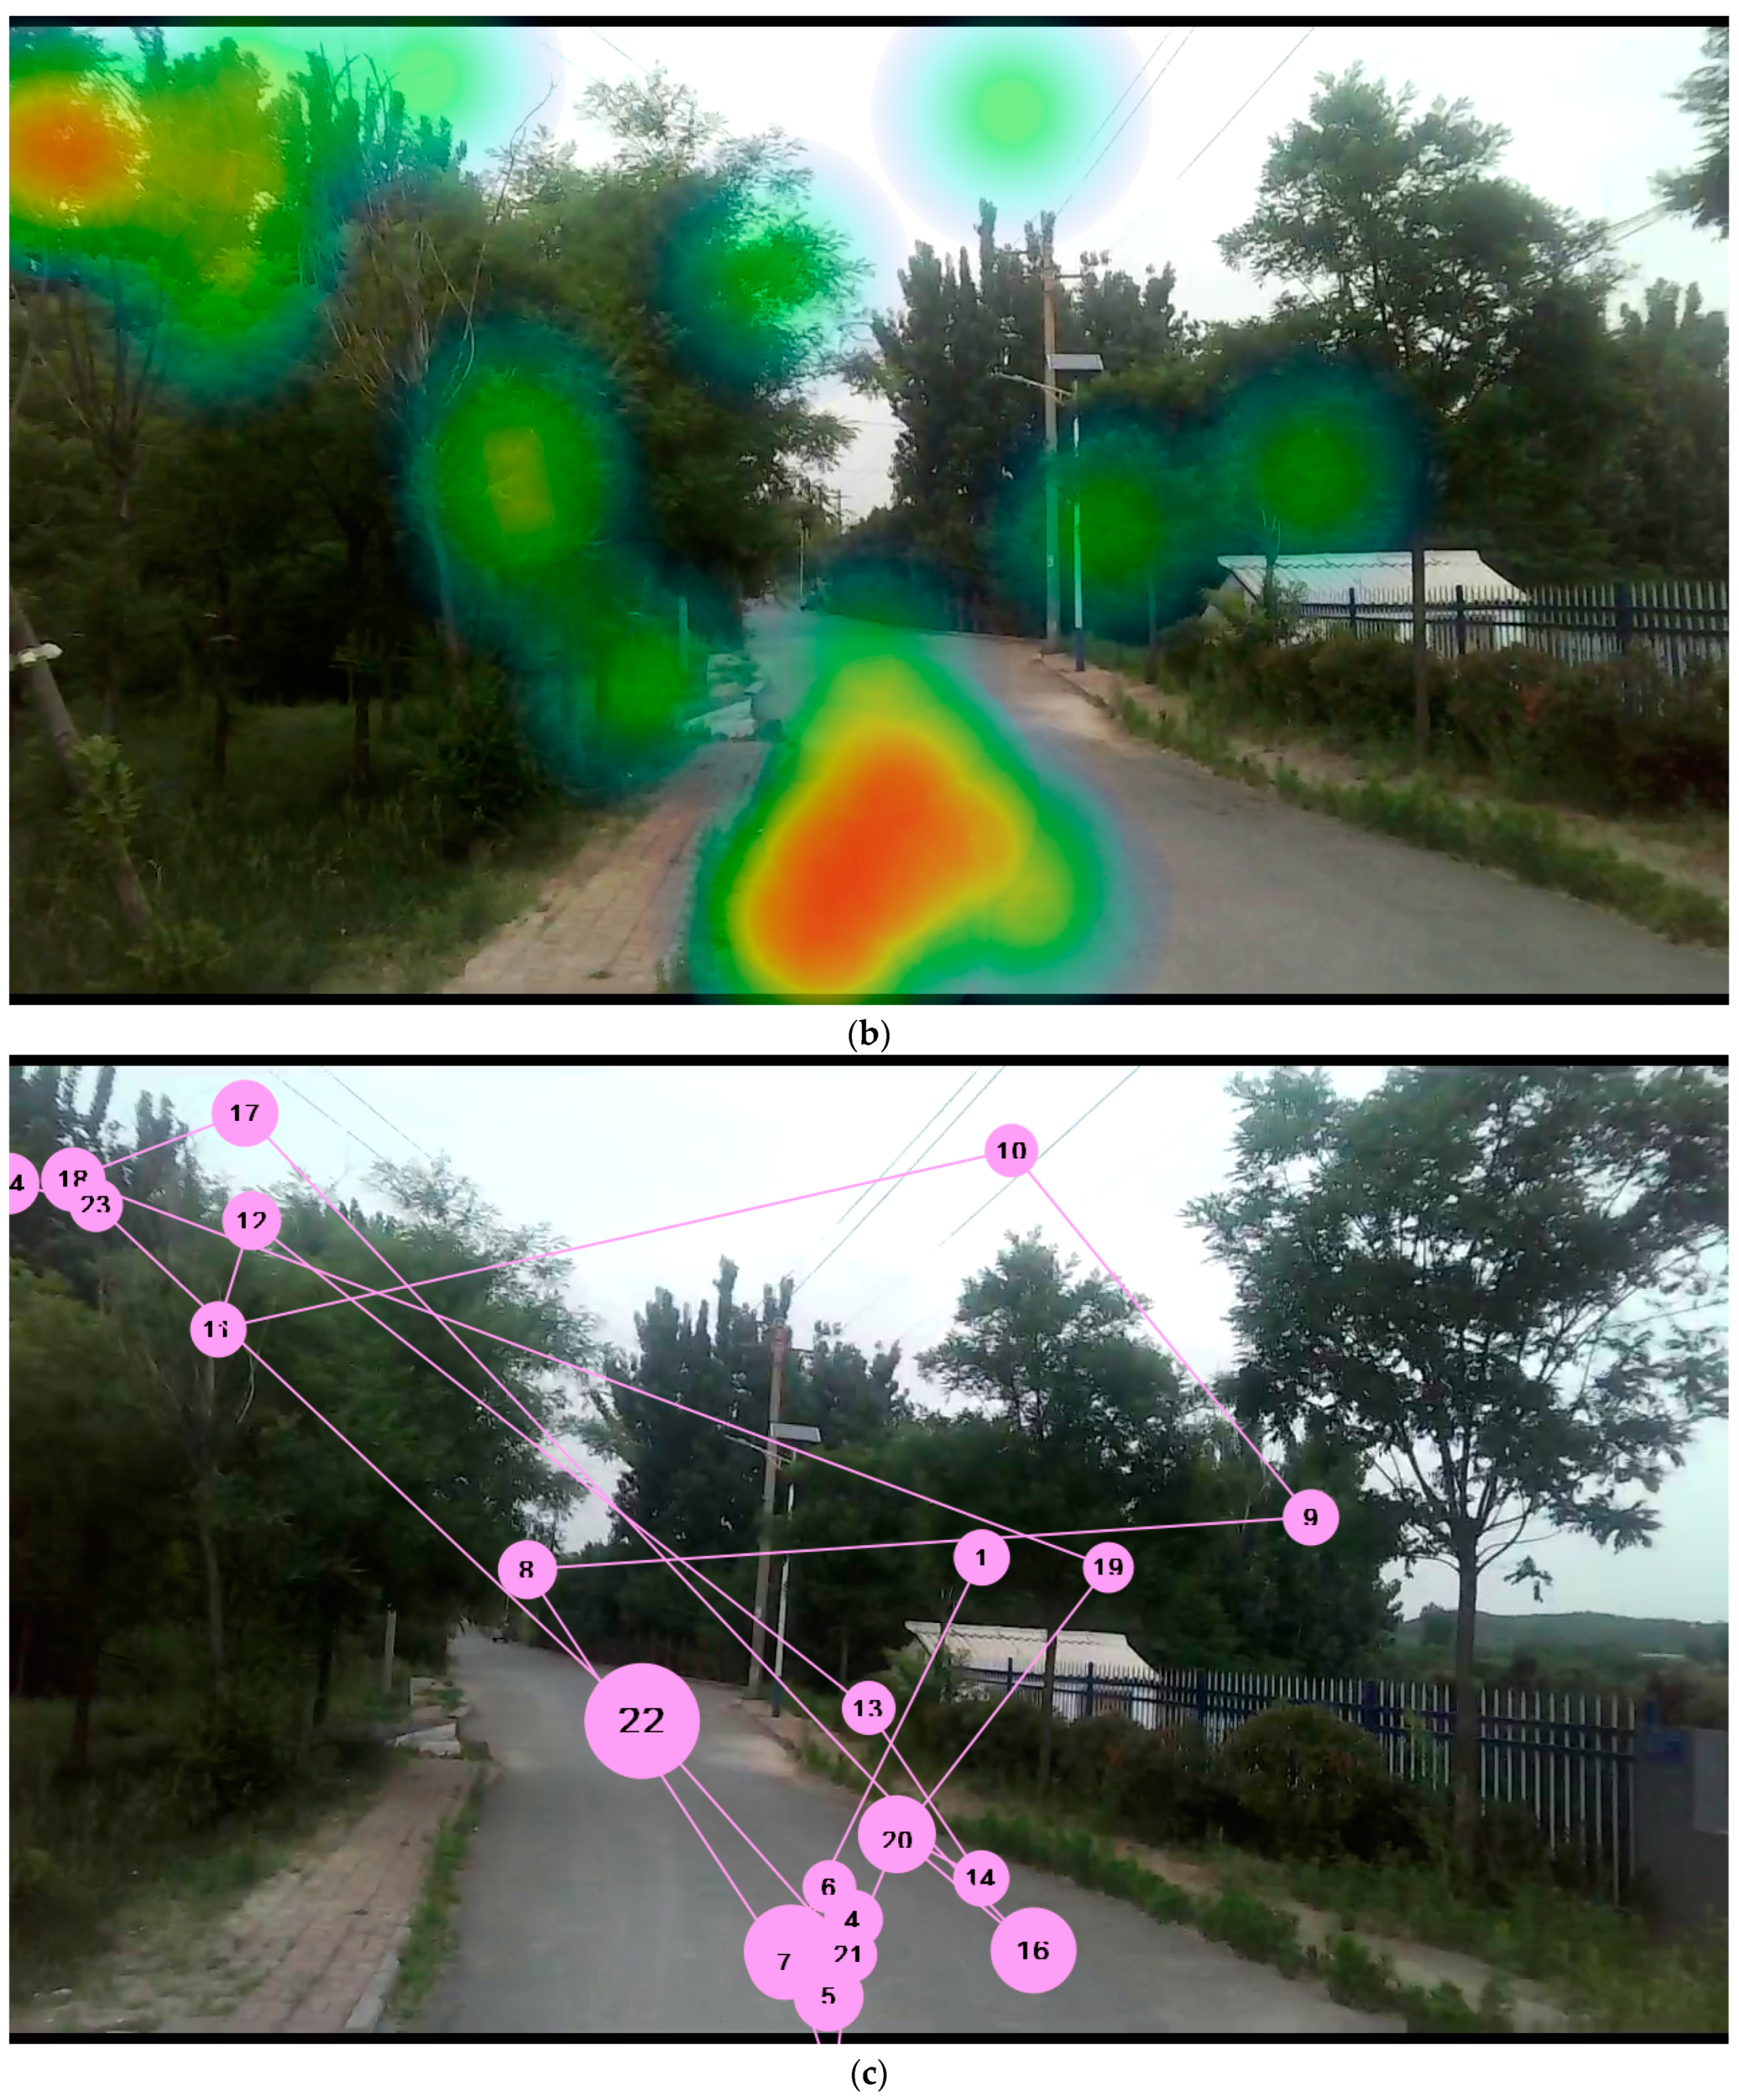
Table 1.
Examples of artificial semantic segmentation.
Table 1.
Examples of artificial semantic segmentation.
| Pixel Statistics | Y1–4 | The Proportion of Elements in the Vision (FP) | |
|---|---|---|---|
 |
 |
Greenery: | 17.23% |
| The sky: | 12.69% | ||
| Ground: | 50.16% | ||
| Doors and windows: | 3.66% | ||
| Wall: | 38.56% | ||
| Low wall: | 5.16% | ||
| Other: | 0.00% | ||
Table 2.
Step-frequency statistics of villagers and tourists (m/s).
Table 2.
Step-frequency statistics of villagers and tourists (m/s).
| Villager | 1.311 | 1.339 | 1.324 | 1.393 | Mean: | 1.342 |
| Tourist | 1.108 | 1.317 | 1.220 | 1.261 | 1.226 |
Table 3.
Statistics of road design elements of concern by eye movement.
Table 3.
Statistics of road design elements of concern by eye movement.
| Experimenter Number | Sampling Point Number | Element Statistics | |||||||||
|---|---|---|---|---|---|---|---|---|---|---|---|
| 1 | 2 | 3 | 4 | 5 | Villager (C) | Tourist (Y) | Sum | Miss Distance | |||
| C1 | △ | ▽I | △U | △U | ○▽ | ||||||
| C2 | △U | △ | △ | U | △ | Greenery: | △ | 70% | 60% | 65% | 10% |
| C3 | △ | ☆ | U | △ | △U | The sky: | ○ | 5% | 50% | 52.5% | −45% |
| C4 | U | △ | △ | △ | △ | Ground: | □ | 0% | 5% | 2.5% | −5% |
| Y1 | ○ | △ | △ | ○ | △ | Doors and windows: | ☆ | 5% | 10% | 7.5% | −5% |
| Y2 | U | ○ | △ | △○☆ | △ | Wall: | ▽ | 10% | 5% | 7.5% | 5% |
| Y3 | ○☆ | △▽ | △ | △ | △○ | Low wall: | U | 35% | 5% | 20% | 30% |
| Y4 | ○ | △○□ | ○ | △ | ○ | Other: | I | 5% | 0% | 2.5% | 5% |
Table 4.
The correlation statistics of fixation duration and elements.
Table 4.
The correlation statistics of fixation duration and elements.
| Villager (C) | Tourist (Y) | Whole Correlation | |
|---|---|---|---|
| Greenery: | 0.70261 | 0.69332 | 0.71116 |
| The sky: | 0.13331 | −0.12607 | −0.01706 |
| Ground: | −0.60348 | −0.61431 | −0.5658 |
| Doors and windows: | −0.38751 | 0.22314 | 0.02776 |
| Wall: | 0.17444 | 0.0165 | 0.1025 |
| Low wall: | 0.03511 | 0.16728 | 0.08314 |
| Other: | −0.27099 | −0.18219 | −0.18768 |
Table 5.
AOI dynamic analysis data and gaze-attraction statistics.
Table 5.
AOI dynamic analysis data and gaze-attraction statistics.
| Enclosed Interface | Semi-Enclosed Interface | Open Surface | |||||||||
|---|---|---|---|---|---|---|---|---|---|---|---|
| Left Visual Surface | Ground | Right Visual Surface | Left Visual Surface | Ground | Right Visual Surface | Left Visual Surface | Ground | Right Visual Surface | |||
| Villager (C) | 1 | G | 0.059139785 | 0.023809524 | 0.064327485 | 0.045751634 | 0.027149321 | 0.057189542 | 0.054422317 | 0.029434851 | 0.060932845 |
| X | 15 | 5 | 10 | 21 | 9 | 21 | 27 | 3 | 26 | ||
| Y | 18.6 | 2.8 | 5.7 | 15.3 | 2.6 | 10.8 | 12.403 | 0.546 | 20.573 | ||
| Z | 2.2 | 0.4 | 1.1 | 1.7 | 0.4 | 1.5 | 1.4 | 0.3 | 2.7 | ||
| 2 | G | 0.037037037 | 0.103174603 | 0.378405651 | 0.125 | 0.225154053 | 0.29342723 | 0.058405469 | 0.076815029 | 0.071092345 | |
| X | 1 | 4 | 5 | 1 | 4 | 3 | 5 | 17 | 12 | ||
| Y | 0.1 | 5.6 | 21.802 | 4.3 | 37.974 | 1.917 | 4.784 | 22.782 | 10.922 | ||
| Z | 0.1 | 3.9 | 16.5 | 4.3 | 17.1 | 1.5 | 1.9 | 3.5 | 2.2 | ||
| 3 | G | 0.08656558 | 0.077084022 | 0.118128507 | 0 | 0.431992101 | 0.125456204 | 0.037369984 | 0.078313896 | 0.125031447 | |
| X | 6 | 12 | 9 | 0 | 7 | 1 | 2 | 22 | 25 | ||
| Y | 15.916 | 4.036 | 7.901 | 0 | 8.102 | 14.248 | 0.983 | 22.359 | 26.932 | ||
| Z | 6.2 | 0.7 | 2.8 | 0 | 4 | 14.3 | 0.9 | 3.9 | 6.6 | ||
| 4 | G | 0 | 0.21418756 | 0.169718977 | 0 | 0.102755581 | 0.017857143 | 0.057957015 | 0.06853746 | 0 | |
| X | 0 | 13 | 3 | 0 | 55 | 1 | 12 | 28 | 1 | ||
| Y | 0 | 17.829 | 9.501 | 0 | 39.188 | 0.134 | 10.1 | 27.9 | 1.3 | ||
| Z | 0 | 4.7 | 8.6 | 0 | 4.1 | 0.134 | 2 | 2.8 | 1.3 | ||
| Tourist (Y) | 1 | G | 0.070401502 | 0.074517353 | 0.064460607 | 0.0625 | 0.356324765 | 0.023809524 | 0.054996677 | 0.137568293 | 0 |
| X | 22 | 19 | 5 | 1 | 14 | 1 | 3 | 32 | 0 | ||
| Y | 16.304 | 13.303 | 12.984 | 0.3 | 15.716 | 2.1 | 2.567 | 31.471 | 0 | ||
| Z | 2.4 | 2.4 | 7.7 | 0.3 | 6.4 | 0.8 | 1.6 | 4.6 | 0 | ||
| 2 | G | 0.200711885 | 0.293933709 | 0.076923077 | 0.28584392 | 0.061617458 | 0.117311351 | 0.15154265 | 0.131082423 | 0.125313283 | |
| X | 7 | 5 | 1 | 6 | 8 | 5 | 3 | 11 | 5 | ||
| Y | 38.9 | 12.3 | 0.3 | 23.2 | 4.1 | 8.3 | 17.4 | 10.6 | 12.6 | ||
| Z | 14.5 | 9.4 | 0.3 | 21 | 0.6 | 3.7 | 16.7 | 2.4 | 6 | ||
| 3 | G | 0.053835204 | 0.026817364 | 0.023314973 | 0.041739782 | 0.039226928 | 0.030449345 | 0.102685624 | 0.055671538 | 0.034425778 | |
| X | 40 | 15 | 14 | 21 | 26 | 32 | 17 | 34 | 17 | ||
| Y | 18.306 | 8.917 | 3.481 | 8.916 | 11.746 | 9.312 | 3.165 | 14.37 | 3.631 | ||
| Z | 1.7 | 1.1 | 0.4 | 1.4 | 1.4 | 0.7 | 1.3 | 1.6 | 0.5 | ||
| 4 | G | 0.126020768 | 0.188018338 | 0.082365538 | 0.464839094 | 0.142574816 | 0.08583691 | 0.132835244 | 0.061805652 | 0 | |
| X | 5 | 9 | 4 | 6 | 3 | 1 | 25 | 2 | 0 | ||
| Y | 9.919 | 19.413 | 1.349 | 20.136 | 21.252 | 0.233 | 43.217 | 2.397 | 0 | ||
| Z | 4.5 | 7.3 | 0.5 | 15.6 | 10.1 | 0.2 | 6.2 | 2 | 0 | ||
Table 6.
Comparison of AOI dynamic analysis data.
Table 6.
Comparison of AOI dynamic analysis data.
| Villager (C) | Tourist (Y) | |
|---|---|---|
| Mean: | 0.097 | 0.111 |
| Fixation time: | 10.722 | 11.639 |
| Residence time: | 11.276 | 11.728 |
| Maximum fixation duration: | 3.493 | 4.369 |
Table 7.
The most memorable (impressed) scenes.
Table 7.
The most memorable (impressed) scenes.
| Villager (C) | Tourist (Y) | |||||
|---|---|---|---|---|---|---|
| 1 | Educated youth courtyard | Old supply and marketing cooperative | Old village site | Low wall | Yard gate | Low wall |
| 2 | Educated youth courtyard | Old supply and marketing cooperative | Old village site | Educated Youth courtyard | Shop | Old village site |
| 3 | Educated youth courtyard | Old supply and marketing cooperative | Old village site | Old supply and marketing cooperative | Low wall | Side of the street |
| 4 | Bridge | Old supply and marketing cooperative | Old village site | Educated youth courtyard | Old supply and marketing cooperative | Side of the street |
|
Disclaimer/Publisher’s Note: The statements, opinions and data contained in all publications are solely those of the individual author(s) and contributor(s) and not of MDPI and/or the editor(s). MDPI and/or the editor(s) disclaim responsibility for any injury to people or property resulting from any ideas, methods, instructions or products referred to in the content. |