Exploring GIS Techniques in Sea Level Change Studies: A Comprehensive Review
[ad_1]
8.1. Global Overview
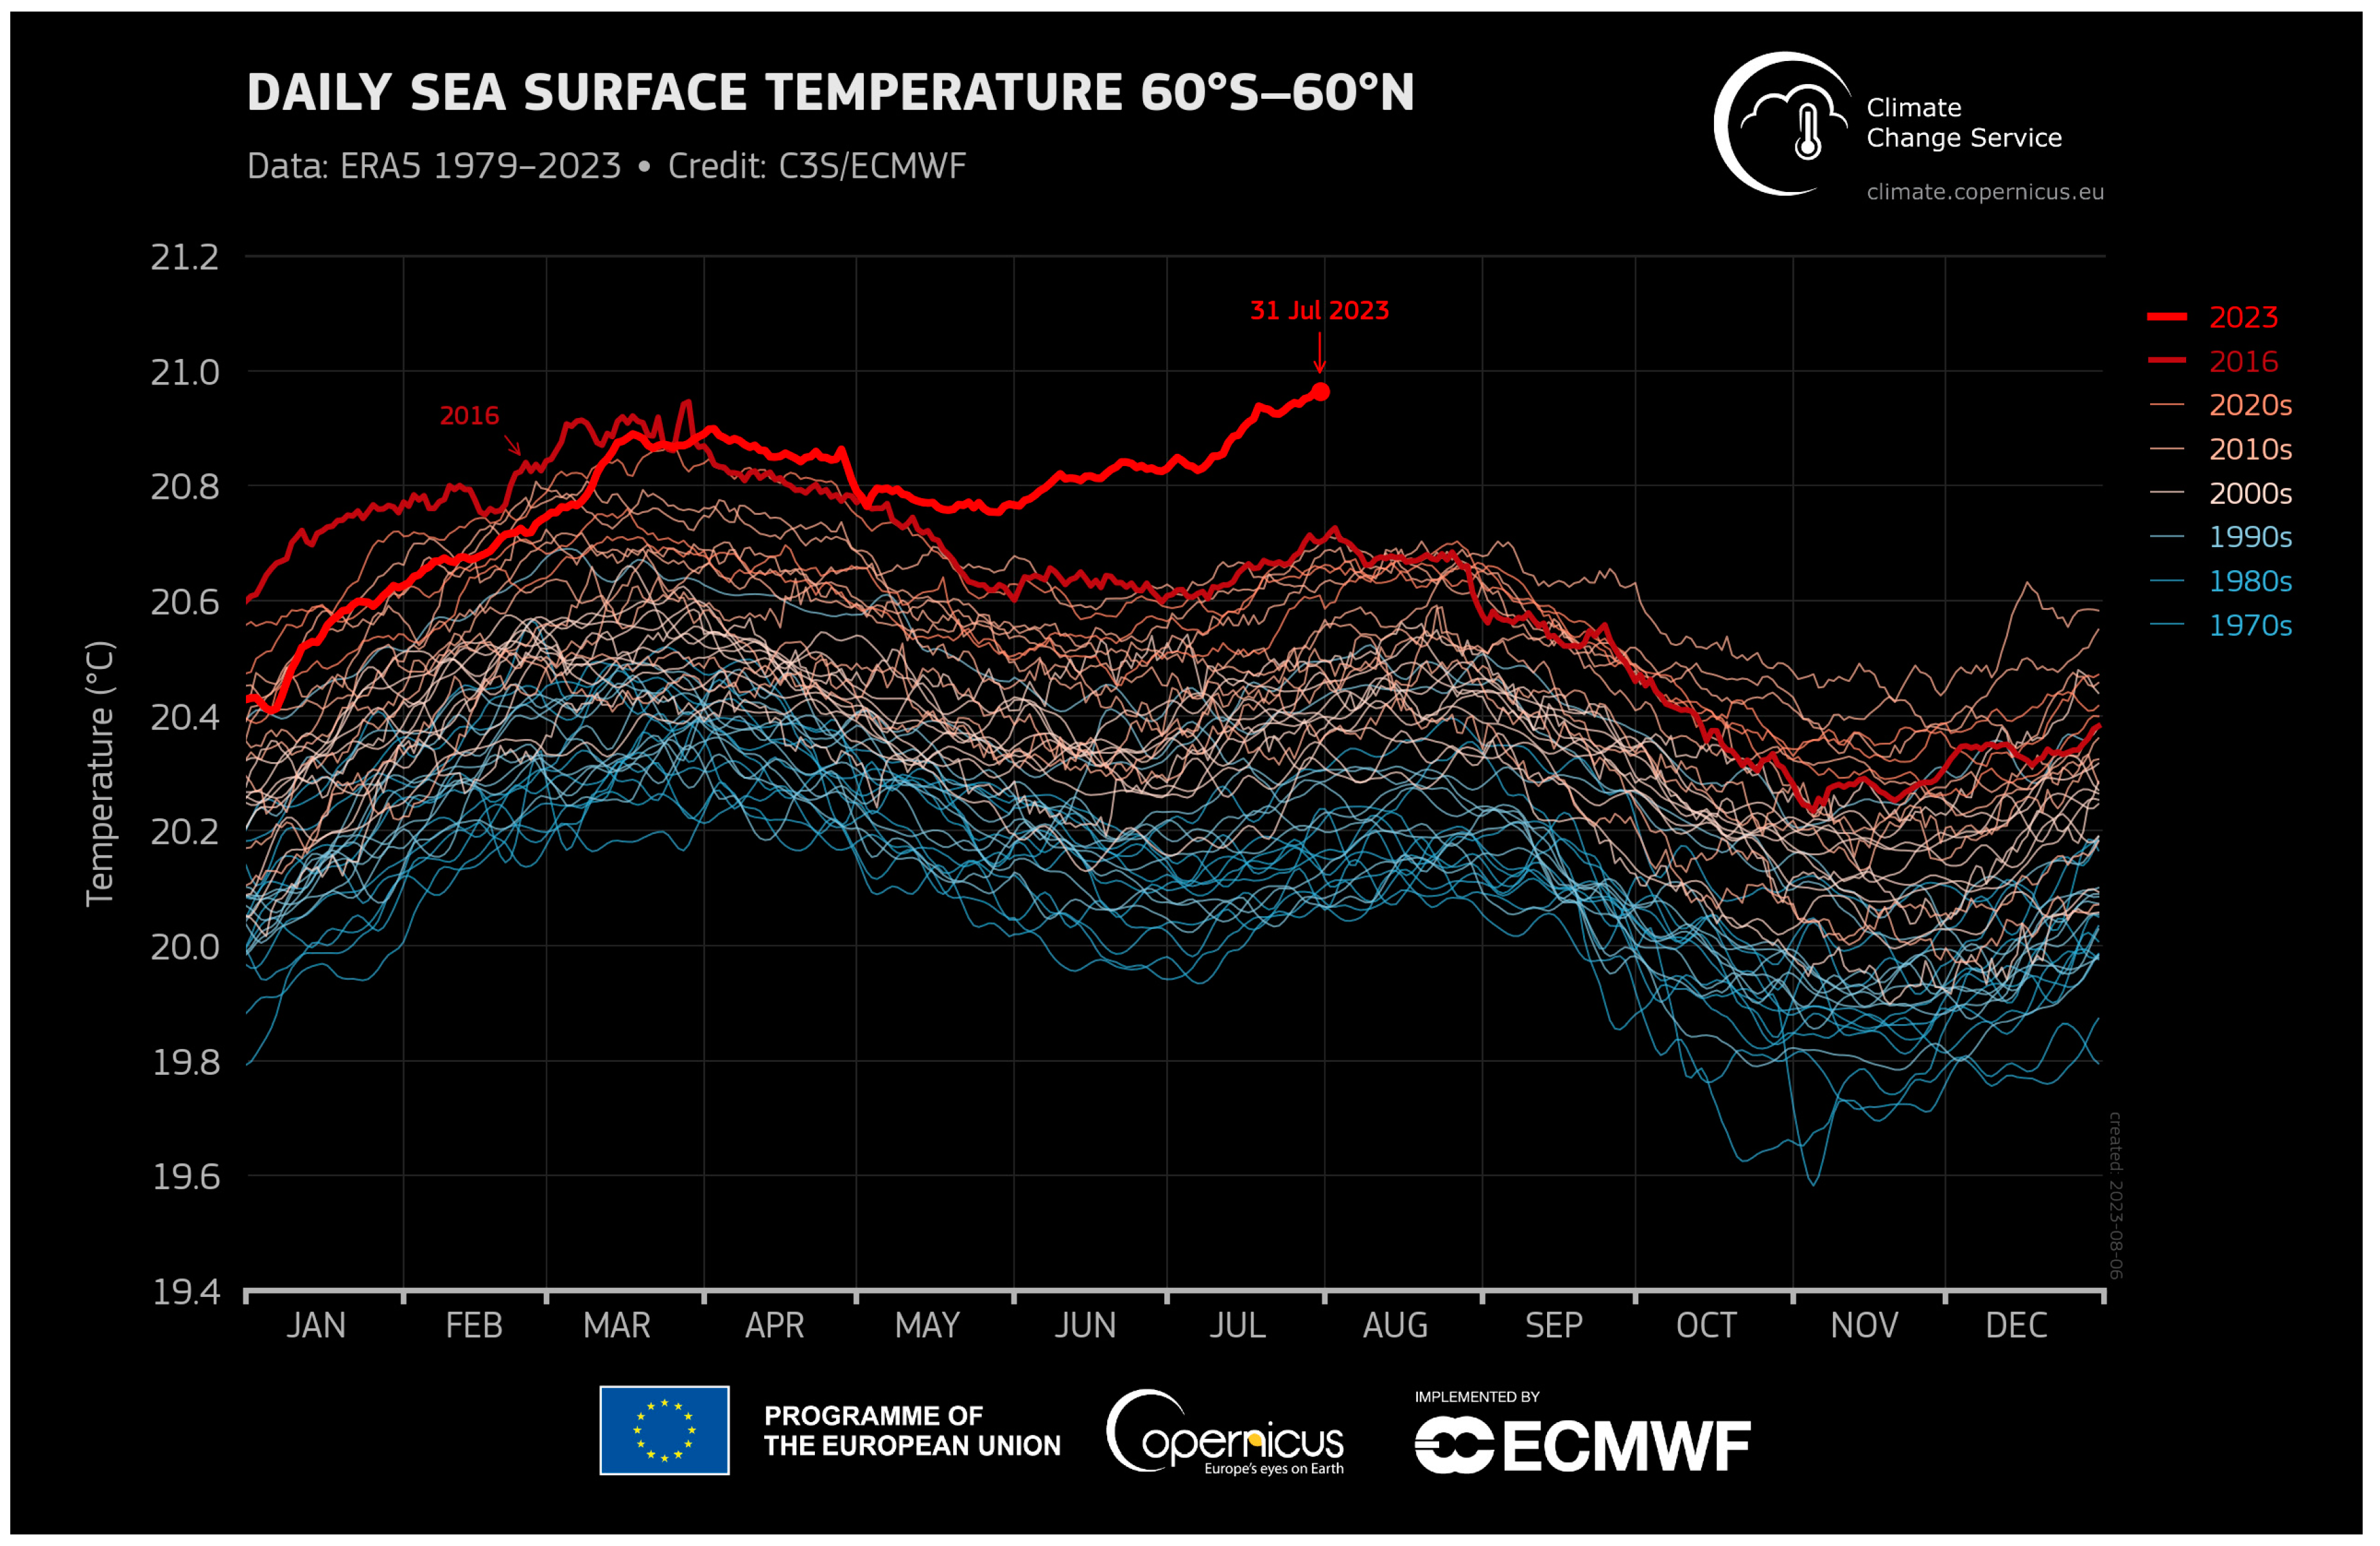
On a global scale, surface air temperatures are rising (Figure 3). As the United Nations (UN) Secretary General said in July 2023, “the era of global warming has ended” and “the era of global boiling has arrived” [43] (p. 1), which highlights and stresses the impacts of it. Since the 1970s, after the ECMWF (European Centre for Medium-Range Weather Forecasts), there has been a continuous increase in the evolution of these temperatures. From that moment onwards, there has been a gain of more than 1 °C. The last few years, especially 2023, highlight particularly warmer years than average. A correlation can be observed between the variation of surface air temperature and sea surface temperature between 60° S and 60° N (Figure 4). In effect, sea surface temperature shows the same evolution, with an increase of 1 °C from 1970–1980 until 2023, with an exceptionally high value for 2023. The same conclusion is highlighted by the evolution of surface air temperature. Focusing on the ongoing year 2023, there appears to be a tendency that suddenly breaks from previous variations, as seen in 2016.
The role of anthropogenic processes is often mentioned to explain these variations. However, Dangendorf et al. [12] in 2019 also mentioned the role of steric changes leading to thermal expansion, notably related to changes in westerlies, to explain the acceleration of global mean sea level. Steric changes, which involve changes in temperature, are depicted in Figure 4, showing an evolution towards even more significant thermal expansion and consequent rise in global sea level. This is also explained by Frederikse et al. [8], who mentioned that this is linked to a combination of thermal expansion of the ocean and increased ice-mass loss from Greenland [8] (p. 1). Such changes are observed at a time when catastrophic events like tsunamis or storm surges happen and are becoming even more violent and dangerous. Hence, studying these parameters is closely related to studying the evolution of sea level.
8.1.1. Asia and America
As mentioned earlier, Asia and America are the two leading continents, with China and the United States, countries near the ocean, publishing the most articles related to sea level rise. Several articles have been published in the United States regarding surface air temperature [44,45,46,47], mainly studied on a local scale. In China, there is a very high number of publications [48,49,50,51,52,53,54], appearing to surpass those of the United States. This shows the specific concern of this country with the question of surface air temperature. In effect, China conducts several studies related to climate change as it has consequences for this country, as evidenced by the number of publications concerning sea level rise. Asia also includes India, Indonesia, and the United Arab Emirates, three countries that have published 13, nine, and seven articles, respectively. For instance, Chowdary et al. [55] showed that surface air temperature is locally influenced by sea surface temperature and El Niño in India. This highlights a link at a local scale that could also be applied at a global level, aligning with results obtained by the Copernicus Climate Change Service [56].
Figure 3.
Globally averaged surface air temperature for all months of July from 1940 to 2023. Shades of blue indicate cooler-than-average years, while shades of red show years that were warmer than average. Data: ERA5. Credit: ECMWF, Copernicus Climate Change Service (C3S) [56].
Globally averaged surface air temperature for all months of July from 1940 to 2023. Shades of blue indicate cooler-than-average years, while shades of red show years that were warmer than average. Data: ERA5. Credit: ECMWF, Copernicus Climate Change Service (C3S) [56].
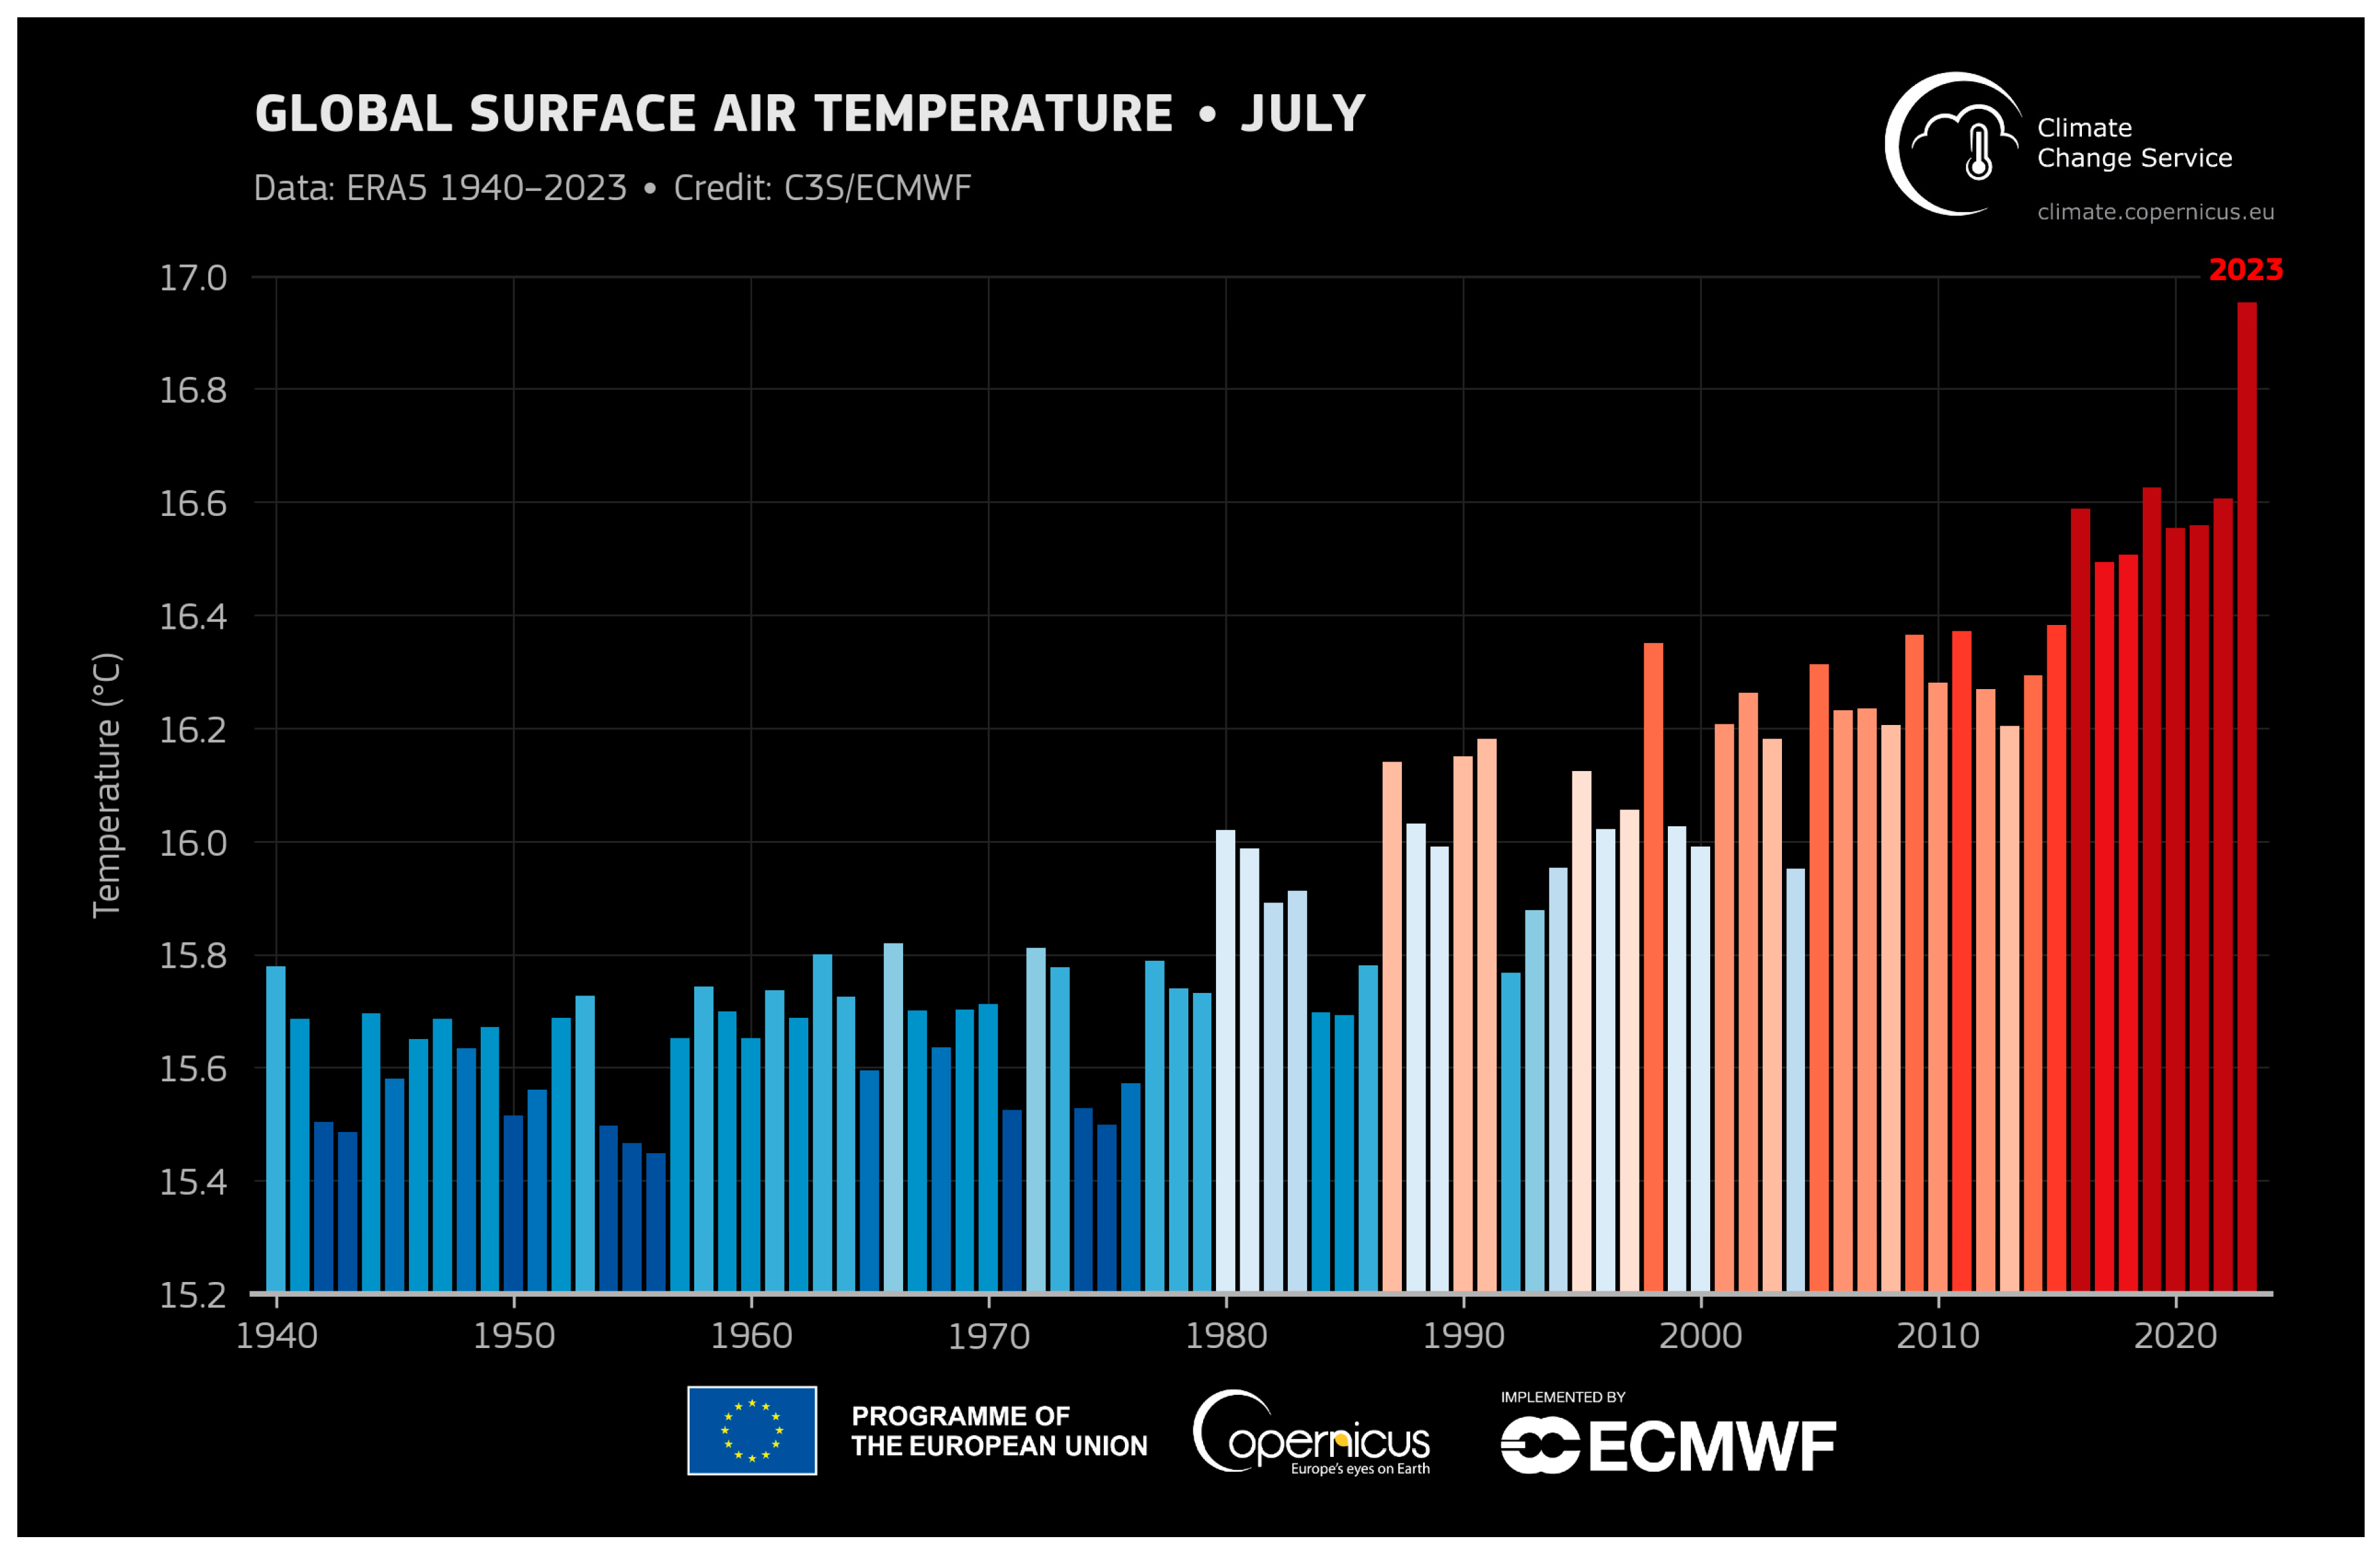
Figure 4.
Daily global sea surface temperature (°C) averaged over the 60° S–60° N domain, plotted as a time series for each year from 1 January 1979 to 31 July 2023. The years 2023 and 2016 are shown with thick lines shaded in bright red and dark red, respectively. Data: ERA5. Credit: ECMWF, Copernicus Climate Change Service (C3S) [56].
Daily global sea surface temperature (°C) averaged over the 60° S–60° N domain, plotted as a time series for each year from 1 January 1979 to 31 July 2023. The years 2023 and 2016 are shown with thick lines shaded in bright red and dark red, respectively. Data: ERA5. Credit: ECMWF, Copernicus Climate Change Service (C3S) [56].
Only two studies have been performed in Indonesia mentioning surface air temperatures. As this type of study is rare in Indonesia after Rohman et al. [57], the decision to work on it was made because Indonesia is vulnerable to climate change due to its important agricultural sector. Rohman showed an increase in air temperatures at different sites in Indonesia. In the United Arab Emirates, this question has also been assessed, with global trends showing a global increase in surface air temperatures from a local point of view [58,59,60] and a regional one at the scale of the Arabian Peninsula [61].
8.1.2. Europe and Africa
The two other continents that have a smaller number of articles published, are Europe and Africa. These continents include, notably, Egypt and Spain. In Egypt, Hasanean and Basset [62] studied surface air temperatures and linked them to climate variations, including El Niño too. This shows that it is possible to understand variations in sea level rise by studying surface air temperatures. In effect, El Kenawy [63] explained that atmospheric patterns could explain temperature variations in a study area in Spain. Italy, the Netherlands, Sweden, and the United Kingdom are also coastal countries that are impacted by these fluctuations. Despite their underrepresentation in the literature on sea level rise, the Netherlands is a great example of vulnerability due to the presence of polders, as a part of the country is located at sea level. Coastal parts of Italy are also endangered, like Venice. A potential acceleration of sea level rise could have important consequences for this city.
8.1.3. Oceania and Antarctica
The two last continents with the least number of publications are Oceania and Antarctica. Oceania has a lot of islands that are vulnerable to sea level rise, like Fiji [64]. For instance, in line with previous papers, Xue et al. [65] showed that surface air temperature is locally influenced by sea surface temperature in Australia and El Niño, when studying during the austral summer. However, there are no papers on Antarctica, as research in this region mainly focuses on glacier melting.
All these areas mostly highlight the same outcome: sea surface temperatures influence surface air temperatures. Overall, no matter what area is selected, surface air temperatures appear to increase over time with a speed related to the location studied. The more arid the climate of the area, the quicker the temperature rises. These temperature changes impact sea surface temperatures over time through winds on a global scale, which is significantly responsible for sea level rise [12].
8.2. Case of GCC (Gulf Cooperation Council)
After a general overview, the decision was made to focus on GCC countries. The United Arab Emirates is one of them, and previous sections have demonstrated that it is one of the countries that has published several papers about sea level rise. Moreover, there is a link between the intensity of climate events and temperatures. In regions like the GCC, because of its overall arid climate, temperatures are usually high, especially in the summer. The more desertic the area, the more pronounced the climate events are. Also, recent extreme weather conditions in the Middle East, like snowfall in the desert in Saudi Arabia and significant episodes of rain and hail in the UAE, have highlighted the importance of focusing on this region.
Several catastrophic events happened regularly in the GCC, such as cyclones. Sandstorms and dust storms are also frequent. Francis et al. [66] showed that there is a correlation between temperature rise and the recurrence of cyclones in the Arabian Peninsula. Because of the growing importance of these events in this area, it is important to focus on them, as the literature on this subject is limited. The cities in the GCC are vulnerable, and stakes are high with important business and touristic hubs. Environmental awareness and recent sport events, like COP28 in Dubai or the Qatar World Cup Final, raise questions about the vulnerability of such events in the future in this region, considering the risks of sea level change or natural hazards they face, using network analysis, for instance [67]. The preservation of the environment, including mangroves, is also an important challenge, as already addressed by several studies [7,68], mostly using models.
It has been decided to focus on average summer temperatures as it is the warmest season of the year. This way, it will be possible to see how this season, which is the most extreme, evolves.
To explore the spatial distribution pattern of summer temperatures in the GCC and neighboring countries, average temperature data spanning 60 years were used, from June and July 1963 to 2023. These data come from the ECMWF ERA5 open-source dataset produced by the Copernicus Climate Change Service (C3S) and are analyzed using the GrADS application on a Linux-based system.
Figure 5 presents the average summer season temperature in °C for the months of June and July, from 1963 to 2023, across the GCC region. Over this 60-year timeframe, it is apparent that the maximum temperature values remained stable, while their geographical coverage expanded significantly.
Between June and July 1963 and 1983, the region experienced maximum temperatures averaging between 39 and 43 °C, confined to a relatively small part of Saudi Arabia and the northern part of Yemen. Temperature levels gradually decreased as one moved away from this central area.
In contrast, during June and July 1983–2003, the area characterized by maximum temperatures within the same range (39–43 °C) expanded significantly, covering nearly all of Saudi Arabia, parts of Yemen, and a small portion of Oman. The rate of temperature decreases in surrounding regions exhibited a gentler gradient.
Moving into the period of June and July between 2003 and 2023, distinctive temperature changes come into focus. In June, an increase in maximum temperatures is observed, with values ranging from 41 to 43 °C, primarily in the central region of Saudi Arabia. However, in July, the temperature range remains consistent at 41 to 43 °C. What is noteworthy is that this temperature range expands its coverage, extending beyond the borders of Saudi Arabia and encompassing a broader geographical area that includes neighboring countries like Kuwait, the UAE, Iraq, and Iran. These temperature dynamics in the 2003–2023 period highlight the intriguing variations in thermal conditions experienced during these two summer months across the Gulf Region.
The observed increase in temperature patterns, especially during the summer months of June and July in the GCC region, can have significant implications for long-term for sea level rise in the area. In effect, steric changes can happen due to increasing temperatures, leading to expanding sea volume locally and causing sea level rise [69]. Higher temperatures can also lead to more frequent and severe weather events, as highlighted by the IPCC [70] and mentioned by Ebi et al. [71]. For example, a cyclone or hurricane in the Arabian Sea can bring intense rainfall and storm surges, leading to temporary but significant increases in sea levels. An example is Cyclone Gonu in 2007, which caused coastal flooding in Oman and the UAE [72]. Moreover, rising sea levels intensify coastal erosion, particularly in Qatar, posing a significant threat to coastal infrastructure and property [72]. These instances demonstrate the various ways in which rising temperatures and their consequences, including sea level rise, affect the GCC region, highlighting the need for ongoing monitoring, adaptation, and mitigation measures.
[ad_2]