Investigating the Value of Parallel Pipeline Projects for Water Supply: A Contingent Valuation Study in South Korea
[ad_1]
1. Introduction
Water infrastructure is essential to have a safe and stable water supply and various economic activities. Water infrastructure typically comprises water sources, treatment and storage facilities, and distribution networks. Distribution networks, which are responsible for transporting water from sources (e.g., reservoirs, rivers, and lakes) to demand sites (e.g., households and industrial and commercial facilities), mainly comprise underground water pipelines. However, accidents can cause damage to these underground pipelines, which may lead to water contamination, leakage, or outages. Fixing such problems may require digging up the land to repair or replace pipelines, which may be costly and may require a lot of time. However, because of the nature of the water supply, losses from these accidents include not only the cost of restoration but also those from damages that arise during the restoration period. For instance, households may incur inconvenience costs from being unable to use water [1,2,3] and industrial or commercial facilities may face substantial economic losses due to water outages [4,5]. Moreover, various water-related conflicts may arise, and the response capability for emergencies or disasters may decrease [6,7].
One measure to address this situation is the installation of parallel pipelines (or twin pipelines). A parallel pipeline is an additional pipeline installed alongside an existing pipeline to ensure a stable supply of resources. (The concept of a parallel pipeline in this study differs from that of dual water distribution suggested in some previous studies, which involves separating the supply of potable and non-potable water using different pipelines [8,9]. Parallel pipelines are utilized for water and the transportation of various energy resources [10]. Although installing additional pipelines leads to additional costs, it offers significant advantages in terms of improving the supply stability. Specifically, when a parallel pipeline exists, the water supply is not disrupted even when one pipeline encounters an accident or needs maintenance. Therefore, parallel pipelines can help prevent losses caused by water supply disruptions in residential, commercial, and industrial sectors. Parallel pipelines can address aging issues regarding installed pipelines (which is the case for most developed countries and regions) while ensuring a stable water supply [10,11,12].
However, such parallel pipeline projects typically involve substantial costs; therefore, appropriately measuring the value derived from the project’s implementation is important to improve decision-making. When measuring the value of water supply projects, various public values associated with the water supply should be included. Therefore, evaluating parallel pipeline projects for a better water supply should not be merely based on economic factors, such as costs and bills. Previous studies often utilized survey-based methods, including the contingent valuation method (CVM), to analyze the value of projects imposed by consumers based on their willingness to pay (WTP), using samples collected from the directly affected area [13,14,15,16,17,18].
Considering the public nature of the water supply and the global impact of water outages in specific areas of a country, residents outside the project area (who do not directly benefit from the project) may also impose some value on parallel pipeline projects in other areas (e.g., facilitating industry and preventing water-related conflicts). Therefore, unlike previous studies that primarily focus on calculating the direct benefits received by local residents [19,20,21,22], our study constructs two contingent valuation (CV) surveys that differ by project area (within or outside the respondent’s residential area) and utilize the CVM, specifically the spike model [23], to estimate the total value of parallel pipeline projects for each case. Moreover, we apply the swing weighting technique both within and outside respondents’ residential areas to investigate the relative importance that respondents place on key value items associated with the project. Finally, we conduct a CVM analysis by including covariates to identify the factors influencing respondents’ valuations for the projects. Our study is the first to estimate the value of parallel pipeline projects in improving the water supply based on public perception using the CVM. Further, a key contribution of this study is that it presents a valuation framework that considers the value perceived by residents from other regions when implementing water projects in a specific area, reflecting the public value of water services.
2. Literature Review
Existing studies examined the valuation of water-related infrastructure and projects by utilizing the CVM based on survey data. The widespread use of the CVM in appraising the value of water-related infrastructure and projects arises from the difficulties in assessing water’s value solely through the water usage and per-unit fare. This stems from the fact that water encompasses various public values beyond fares. Table 1 lists existing studies that utilize the CVM to value water-related infrastructure and projects. While multiple factors are considered in each project, previous studies focus on the valuation of water infrastructure projects associated with water quality improvement or enhancing the water supply.
Some studies focus on various projects to improve water quality. Kwak et al. [24] and Hao et al. [15] directly estimate the WTP for an enhanced water quality in specific study areas. Additionally, Kontogianni et al. [25] and Paola et al. [26] consider upgrading or extending the operation time of wastewater treatment plants. Choi et al. [27] and Lee et al. [22] analyze the WTP for an improved water quality by imposing agricultural restrictions in upstream areas. Finally, Sehreen et al. [17] and Sewunet et al. [28] examine the WTP for adopting watershed management programs and water pollution management systems.
Other studies concentrate on approaches involving pipelines and water infrastructure to enhance the water supply. Tussupova et al. [14], Bui et al. [29], and Vásquez et al. [30] focus on the provision of safe and reliable piped water services. Aslam et al. [21] analyze the WTP for improved access to water services. Del Saz-Salazar et al. [31] investigate the WTP for enhancements in water supply infrastructure. Genius et al. [32] explore the WTP for implementing municipal enterprises. Kim et al. [13] examine the use of asset management, while Jimenez-Redal et al. [19] examine the WTP for operations and maintenance services.
Although various CVM studies on water-related infrastructure and projects have been conducted, none have focused on the valuation of parallel pipeline projects. Moreover, previous studies have conducted surveys only for residents who directly benefit from the projects. Therefore, the key contributions of this study can be summarized as follows. First, our study is the first to measure the value of parallel pipeline projects. Second, our study includes the WTP of residents outside the project areas to consider the public nature of water infrastructure projects. Finally, our study explores the most important values considered by respondents when valuing parallel pipeline projects using the swing weighting method.
Table 1.
Previous CVM studies on water-related infrastructure and projects.
Table 1.
Previous CVM studies on water-related infrastructure and projects.
| Authors | Research Object | Scope | Description | Main Results |
|---|---|---|---|---|
| Kontogianni et al. [25] | Water quality | Thessaloniki, Greece | Full operation of wastewater treatment plants | EUR 15.23/quarter |
| Genius et al. [32] | Water supply | Rethymno, Greece | Municipal Enterprise for Water Supply and Sewerage (MEWSS) implementation | EUR 10.64/quarter |
| Vásquez et al. [30] | Water supply | Hidalgo del Parral, Chihuahua, Mexico | Safe and dependable drinking water supply | USD 20.88/month |
| Kwak et al. [2] | Water quality | Pusan, South Korea | Improved tap water quality | USD 2.2/household/month |
| Tussupova et al. [14] | Water supply | Pavlodar region, Kazakhstan | Ensuring a safe piped water supply | USD 7.47/household/month |
| Del Saz-Salazar et al. [31] | Water supply | Guadalaquivir River basin, Spain | Urban water supply infrastructure improvement | EUR 8/household/month |
| Choi et al. [27] | Water quality | Han River basin, South Korea | Implementation of highland agriculture restrictions | USD 2.54/household/month |
| Lee et al. [22] | Water quality | Soyang Lake, South Korea | Transition to environmentally friendly farming | KRW 36,115/household/year |
| Paola et al. [26] | Water quality | Ferrera, Italy | Upgraded wastewater treatment plant | EUR 48.1/household/one-off payment |
| Aslam et al. [21] | Water supply | Coalfield, Pakistan | Enhanced access to water services | USD 48.13/month |
| Sehreen et al. [17] | Water quality | Dhaka City, Bangladesh | Effective water pollution management systems | USD 4.78/month |
| Kim et al. [13] | Water supply | Korea | Water infrastructure and asset management adoption | USD 0.22/month |
| Jimenez-Redal et al. [19] | Water supply | Ldjwi island, Congo | Operations and maintenance services for water infrastructure | USD 0.19/month |
| Bui et al. [29] | Water supply | Hanoi, Vietnam | Reliable domestic water supply system | USD 12.2/household/month |
| Sewunet et al. [28] | Water quality | Lake Tana, Ethiopia | Implementation of watershed management program | USD 10/year |
| Hao et al. [15] | Water quality | Haikou City, China | Water quality enhancement | USD 4.01/household/year |
3. Materials and Methods
3.1. Overview
This study utilizes the CVM, specifically the spike model [23], to investigate the value of parallel pipeline projects in South Korea. We conduct a structured survey of South Korean respondents and utilize various methods to investigate how the respondents value parallel pipeline projects. Figure 1 summarizes this study’s overall research framework. Specifically, we conduct two CV surveys that differ by project region: (1) within the respondents’ residential area and (2) outside the respondents’ residential area. The project within respondents’ residential area is assumed to be directly associated with their water use, while the project outside respondents’ residential area is assumed to be indirectly associated with their water use and may have some indirect effects. All respondents completed both surveys. From the survey results, we utilize the spike model to elicit consumers’ WTP (imposed value) for parallel pipeline projects in South Korea [23]. We also employ the swing weighting technique to quantify and compare the relative importance of six key value items associated with the project [33]. Finally, we utilize the spike model with covariates to investigate the factors that influence the WTP (imposed value) for parallel pipeline projects.
3.2. Survey Questionnaire
This study conducts a CV survey to estimate consumers’ WTP for parallel pipeline projects. We provided overall background information on the water infrastructure and parallel pipeline project. Then, we explained how the situations changed with and without the project. Specifically, we mentioned that if a parallel pipeline project is not conducted, inconveniences associated with water outages, leakages, contamination, or road closures in case of accidents may occur. However, we said that if the project is implemented, such inconveniences may be prevented or reduced. Next, we informed respondents that we would conduct two consecutive CV surveys asking about their WTP for parallel pipeline projects within and outside their residential area. We informed them that the project within their residential area is directly associated with their water use, and the project outside their residential area is indirectly associated with their water use and may have some indirect effects.
While various approaches to conducting a CV survey exist, this study utilizes the dichotomous choice (DC) approach, in which respondents express their WTP by responding “yes” or “no” to questions asking if they are willing to pay a certain amount of bid for the given situational change. The DC approach is widely adopted in CV studies because of its various advantages, including ease of response for respondents, low strategic bias, and statistical efficiency [34,35,36,37,38]. Specifically, we utilize the single-bounded dichotomous choice (SBDC) approach, in which respondents respond to a given bid only once. Arrow et al. [39] state that the SBDC approach can be effectively used for the valuation of non-market goods.
As setting the initial bid is important in the DC approach, we set the initial bids for projects within and outside respondents’ residential area using the results of a pilot survey that collected open-ended WTP responses from 100 respondents. For the project within their residential area, we set the payment vehicle as an additional water rate per 1000 L of water (KRW/1000 L) for the next five years because the project is directly associated with one’s water use. Using the results of the pilot survey, bids were set at KRW 100 (USD 0.08), KRW 200 (USD 0.15), KRW 300 (USD 0.23), KRW 500 (USD 0.39), and KRW 1000 (USD 0.77)/1000 L, and respondents were randomly assigned to one of these bids. The specific questionnaire for the survey is as follows: “Does your household willing to pay additional _____ KRW/1000 L charged proportional to your water use for the parallel pipeline project within your residential area?” For the project outside respondents’ residential area, we set the payment vehicle as an additional income tax for the next five years because the project outside their residential area is indirectly associated with water use. Using the pilot survey results, bids were set at KRW 1000 (USD 0.77), KRW 3000 (USD 2.32), KRW 6000 (USD 4.64), KRW 10,000 (USD 7.74), and KRW 20,000 (USD 15.48) per year, and respondents were randomly assigned to one of these bids. The specific questionnaire for the survey is as follows: “Does your household willing to pay additional _____ KRW per year as additional income tax for the parallel pipeline project outside your residential area?”.
Finally, since we expected that many respondents would have zero WTP for the public project, we added a follow-up question to respondents who responded “no” to the initial DC questionnaire asking if the respondent had any WTP for the project (SBDC spike). If the respondent responded “yes” to the follow-up question, the respondent had some amount of positive WTP, while responding “no” to the proposed bid (0 < WTP < bid). However, if the respondent responded “no” to the follow-up question, the respondent had zero WTP (WTP = 0).
3.3. WTP Elicitation Using Spike Model
Using the data collected from the CV survey, a spike model is used to elicit the respondents’ WTP for parallel pipeline projects within and outside the region [23]. The spike model can effectively incorporate zero WTP responses, which is useful for the valuation of public projects that respondents are likely to show a high proportion of zero WTP [34,40,41].
The responses from the CV survey are used to estimate the spike model. We use indicator functions to represent respondent responses. If respondent m is willing to pay the given bid (“yes”), we denote . If the respondent is not willing to pay the given bid but is willing to pay some amount (“no”–“yes”), we denote . Finally, if the respondent is not willing to pay the given bid and does not want to pay any amount (“no–no”), we denote . Using the above notations, the WTP distribution of respondents can be estimated using Equations (1) and (2):
where
Here, G is the logistic distribution, which can be explained by a given bid A and parameters a and b. Moreover, we can include covariate z in estimating a () to investigate how various covariates affect respondents’ WTP. Finally, using the parameters a and b estimated using Equations (1) and (2), the mean and median WTP values can be calculated using Equations (3) and (4).
3.4. Comparing the Relative Importance Using Swing Weighting
This study applies the swing weighting technique to investigate the specific values respondents prioritize for parallel pipeline projects within and outside their residential areas [33]. Specifically, after the CV survey, respondents who did not indicate zero WTP for the project were asked to choose the value item they consider most important among the six value items assumed in this study. Then, considering the most important value item as a score of 100, we asked respondents to assign relative scores to the remaining value items. Finally, using these scores, the relative importance (weight) of the value item j () can be calculated using the average score of each value item (), as shown in Equation (5).
When utilizing the swing weighting technique, appropriately assuming the key value items for valuation is critical. Based on the extant literature and expert reviews, we identify the following key values that are closely associated with parallel pipeline projects: environmental, health and sanitation, climate change response, community integration, industrial–economic, and maintaining and improving living conditions. The meanings of these values were explained in detail to the respondents before the CV survey and swing weighting questionnaires. Table 2 provides the descriptions of each value item.
First, environmental value refers to the value arising from improvements in water quality and the conservation and improvement of environments near water resources and infrastructure through the project [42,43,44,45,46]. Second, the health and sanitation value refers to the value of preventing diseases and maintaining a sanitary environment through the project [47,48,49]. Third, the climate change response value refers to the value of effectively responding to increasing incidents of floods, droughts, fires, and other disasters or reducing carbon emissions through the project [50,51,52,53]. (The value of the environmental and climate change responses may seem similar or overlapping, but they are distinct. If environmental value refers to the improvement of the water quality and the surrounding environment of water resources, the climate change value response involves appropriately addressing carbon emissions from related facilities and effectively responding to events induced by climate change, such as droughts and floods. For example, the prevention of environmental degradation around water pipelines, which is made more manageable and cleaner due to parallel pipelines, is associated with environmental value. In contrast, the ability to appropriately manage emergency situations, such as droughts or floods, even in the case of damage to one pipeline, due to parallel pipelines is closely associated with climate change response value.) Fourth, community integration value refers to the value of resolving inter-regional water conflicts, protecting vulnerable groups, and strengthening the community consciousness through the project [42,54,55,56]. Fifth, industrial–economic value refers to the effects of maintaining and invigorating the local economy, accumulating related knowledge, and promoting research through the project [42,44,57]. Lastly, the value of maintaining and improving living conditions refers to the value of preventing inconveniences related to infrastructure maintenance and preserving basic standards of living throughout the project [45,49,58].
3.5. Sampling and Survey Methods
The data collection survey was conducted in November 2022 in South Korea. A professional survey company was commissioned to handle sampling and ensure credible responses from a representative sample. The total number of respondents was 1055. Owing to the COVID-19 situation at the time of the survey, the survey was conducted online. In South Korea, more than half the population resides in the Seoul Metropolitan Area (Seoul, Gyeonggi-do, and Incheon), accounting for only 11% of the country’s total land area. Consequently, if samples are collected proportionately to the actual population, there might not be enough representation from other regions, considering the limited number of samples. Therefore, we adjusted the sample proportion between metropolitan and non-metropolitan areas to 1:3 (270:785). In each area, samples were collected in proportion to the actual population size. Table S1 in the Supplementary Materials provides descriptive statistics of the collected samples.
4. Results and Discussion
4.1. Estimated WTP for Parallel Pipeline Projects in South Korea
Table 3 illustrates the response distribution from the CV survey described in Section 3. Responses are categorized into three labels: “Yes”, “No–Yes”, and “No–No”. Label “Yes” means that the respondent is willing to pay the given bid for the parallel pipeline project. Label “No–Yes” and “No–No” both mean that the respondent is unwilling to pay the given bid for the parallel pipeline project. The difference between these two labels is the respondents’ response to the follow-up question that asks them whether they have any willingness to pay for the project. Label “No–Yes” means that the respondent is willing to pay at least some amount of money for the project (nonzero WTP), while “No–No” means that the respondent is not willing to pay any amount of money for the project (zero WTP). Our results show that approximately 18% and 31% of respondents have zero WTP (label “No–No”) for the projects within and outside the region, respectively. A higher percentage of zero WTP for the project outside the region seems reasonable, as it is not directly related to the respondents’ water use, while the project within the region is. Moreover, a substantial percentage of zero WTP respondents for both projects implies that the use of the spike model is appropriate and effectively controls for zero WTP responses.
Using the CV survey results, we first estimate the basic spike model without covariates. Table 4 presents the estimation results, which show that the key parameter estimates (a, b, spike) are statistically significant. Furthermore, the mean and median WTP estimation results are stable. Specifically, the additional mean and median WTP values for parallel pipeline projects within the region are KRW 807 (USD 0.62)/1000 L and KRW 691 (USD 0.53)/1000 L, respectively. For the project outside the region, the additional mean and median WTP are KRW 8817 (USD 6.82)/year and KRW 5493 (USD 4.25)/year, respectively.
However, the WTP estimates presented in Table 4 are measured in different units, making a direct comparison challenging. Specifically, the payment vehicle for the project within the region is an additional water fee charged proportionally to water usage, whereas for the project outside the region, the payment vehicle is a fixed amount of additional annual income tax. Therefore, we adjust the estimates to comparable units. In this study, we convert the WTP for the project within the region (which is proportional to water usage) to an annual unit as the WTP for the project outside the region. To achieve this, we use the median WTP per 1000 L for the project within the region (KRW 691, approximately USD 0.53) and multiply it by the average daily water consumption per person in South Korea (196 L) and the average number of household members in South Korea (2.3) (values were retrieved from Statistics Korea (kostat.go.kr; accessed on 20 July 2023 )). Based on these values, we calculate the annual WTP as KRW 113,669 (approximately USD 87.98) (KRW 691/1000 L × 196 L × 2.3 × 365 = KRW 113,669). Compared to the annual WTP for the project outside the region (KRW 5493, approximately USD 4.25), this value is approximately 20 times higher (Figure 2).
If we simply compare the estimates, the WTP for the project outside the region may seem trivial compared to that of the project within the region. However, the WTP outside the region (value imposed by people who do not directly benefit from the project) has significant implications for decision-making associated with the implementation of water infrastructure projects (including parallel pipeline projects).
Because such projects take time to be completed and are costly, they are usually conducted after a thorough feasibility test. This study’s findings suggest that the feasibility tests should consider the value imposed by people who do not directly benefit from the project, considering the public nature of the water supply. Moreover, while households in regions directly benefiting from the project would naturally impose a higher value per household than those that do not, the combined value imposed by residents from regions that are not directly benefited by such projects could be substantial, considering the number of households in the rest of the country.
For instance, in the Daegu and Gyeongsangbuk-do regions of South Korea, which are areas with water-related conflicts [60], the number of households is approximately two million. In contrast, the number of households in the remaining regions in South Korea is approximately 20 million. Even when the WTP for projects within and outside the region differs by 20 times, considering the ten-fold number of households outside the region, the total WTP difference between residents inside and outside the regions narrows by about twice. Given the public nature of the water supply, this approach can be applied to the valuation of other water infrastructure projects.
4.2. Relative Importance Analysis Using Swing Weighting
Next, we examine the results from swing weighting, which can be used to decompose the total value of the parallel pipeline projects estimated in Table 4. Table 5 presents the results of swing weighting using the six value items defined in Section 3.4. Specifically, Table 5 provides (1) the average scores of each value item and derived relative importance and (2) the annual value per one million households (annual WTP per household × relative importance × million households). A high relative importance for a certain value item indicates that respondents impose a relatively higher importance on that particular value item in relation to the parallel pipeline project.
The results show that the ranking of scores for value items for both projects (within and outside the region) is consistent, and the derived relative importance is not significantly different. Specifically, the health and sanitation value and the value for maintaining and improving living conditions show the highest relative importance. For projects outside the region, the relative importance for community integration and industrial–economic values is slightly higher. The annual value per million households for projects within the region ranges from KRW 16.9 billion to KRW 20.7 billion (USD 13.08 million to USD 16.02 million) per value item (a maximum difference of approximately 22%). For projects outside the region, the value ranges from KRW 826 million to KRW 977 million (USD 0.64 million to USD 0.76 million) per value item (a maximum difference of approximately 18%).
4.3. Analysis Results with Covariates
Finally, we estimate the spike model with covariates to identify the factors affecting consumers’ WTP (imposed value) for parallel pipeline projects. The covariates included are (1) key demographics, including gender, age, years of education, and residential area (whether the respondent lives in the Seoul Metropolitan Area); (2) the monthly household income and number of household members; (3) whether the respondent experienced a water cut-off; (4) monthly water bills; and (5) how much respondents think the six value items regarding water projects need urgent improvement. For the last variable, we use a 5-point Likert scale to collect responses (1 = not urgent at all, 2 = not urgent, 3 = neutral, 4 = urgent, and 5 = very urgent). Table S2 in the Supplementary Materials provides descriptive statistics of the covariates. The estimation results are provided in Table 6.
The results show that for the project within the region, the WTP is higher for males, households with higher incomes, and households with more members. Moreover, a higher WTP is observed for respondents who believe that improvements in climate change response and community integration values are vital. The trend of a higher WTP for higher-income households was commonly observed in previous studies [15,24,28,35,61,62,63,64]. The higher WTP in households with more household members can be attributed to the potential inconvenience faced by households with children or elderly members if there is a disruption in the water supply. Moreover, the higher WTP among those who believe that improvements in climate change response and community integration values are vital implies that respondents are wary of damage in their regions due to climate change and hindrances in community integration. Other covariates, including age, level of education, residence in the Seoul Metropolitan Area, experience with water cut-offs, and the level of water bills, do not significantly influence respondents’ WTP. For the project outside the region, only the influence of a single covariate is significant. Specifically, a higher WTP is observed among those who believe that improvements in industrial–economic value are imperative. This suggests that the Korean public recognizes the essential nature of an adequate water supply for the country’s industry and economy and is cautious of the negative repercussions caused by disruptions in water supply.
According to the swing weighting analysis results discussed in Section 4.2, value items with the highest relative importance for the projects within and outside the region are health and sanitation value and value for maintaining and improving living conditions. However, according to the results of the analysis with covariates, the value items that influence the variation in WTP are climate change response and community integration values for the project within the region and industrial–economic value for the project outside the region. These items rank lowest according to the swing weighting analysis, suggesting that the value items that respondents consider important in water projects and the items that can leverage that value may differ.
Therefore, associated institutions in South Korea can devise strategies to leverage the value imposed by the public on parallel pipeline projects. First, for residents within the project areas, it is necessary to raise awareness about the severity of potential problems related to climate change responses and community integration that may arise from disruptions in the water supply and promote how the project can contribute to the value of climate change responses and community integration. Additionally, for residents outside the project areas, highlighting the seriousness of potential industrial and economic problems that might occur due to water supply disruptions and emphasizing the industrial-economic value that can be created through the projects’ implementation are essential. For example, according to this study’s results, the South Korean public may place higher value on water supply projects for industrial use that have a high economic impact.
5. Conclusions and Policy Implications
This study employs the CVM to measure the WTP (imposed value) of the South Korean public for parallel pipeline projects to ensure a safe and stable water supply. Specifically, we apply the CVM separately for a project within the region from which respondents have a direct benefit and for a project outside the region from which respondents have no direct benefits. We use this approach to analyze the value resulting from the projects’ implementation from two different dimensions (direct and indirect beneficiaries) and utilize the spike model to estimate the WTP. The results from the spike model show that the median WTP for the parallel pipeline project by respondents within the region is KRW 691 (USD 0.53)/1000 L, while for respondents outside the region, it is KRW 5493 (USD 4.25)/year. Calculating the annual WTP of respondents within the region based on the average water consumption per person and average household size results in approximately KRW 110,000 (USD 85.13). Even though the WTP for the project outside the region is considerably lower than that for the project within the region, the results indicate that South Koreans put some value even on the parallel pipeline project outside their region.
Moreover, we utilize the swing weighting technique to compare the relative importance of the key value items. The results indicate that the most important values perceived by respondents from parallel pipeline projects are health and sanitation, improving and maintaining living conditions, and environmental values. On the one hand, climate change response, community integration, and industrial–economic values are considered relatively less important. However, the results from the spike model with covariates indicate that the climate change response and community integration values may have a significant impact on leveraging the imposed value for the project within the region. On the other hand, for the project outside the region, the results show that industrial–economic value may have a significant impact on leveraging the imposed value for the project.
The core significance of this study lies in proposing a framework that assesses the value of parallel pipeline projects for a safe and stable water supply, not just for residents who directly benefit within the project region but also for those residing outside the region, taking into account the public nature of water supply. Additionally, this study finds a difference between the value items South Koreans consider important in relation to the project’s implementation and those that can leverage the project’s valuation. This study’s key findings can help shape South Korea’s water infrastructure policy, and this study’s framework can be referenced and utilized in valuing other public infrastructure projects.
The limitations of this study and directions for future research are as follows. First, this study analyzes the general value of parallel pipeline projects, categorized by whether they are within or outside the respondent’s region. This prevents us from setting up and evaluating projects in a general context. Future studies should consider a specific project in a particular region using detailed information related to the project’s implementation to derive more specific implications for the project. Moreover, because this study is based on a survey conducted in South Korea, caution is needed when extending the discussion to other countries or regions. Future studies should revise the research framework by considering the specific conditions of the targeted region. Furthermore, given that the CVM is one of several approaches that support decision-making, it may be beneficial to justify the evaluation of the actual implementation of the project through incorporating data from other sources. Future studies could conduct integrated analyses by including these sources. Finally, while this study focused on the general valuation of parallel pipeline projects, some may be interested in the actual contribution of the project to solving problems such as water pressure fluctuation or tree root intrusion in specific regions. Future studies may consider such aspects to provide more detailed insights about the parallel pipeline projects.
Supplementary Materials
Author Contributions
Investigation, Y.H., J.S. and J.A.; data curation, Y.H.; writing—original draft, Y.H. and H.C.; conceptualization, J.S. and J.A.; resources, J.S.; validation, J.S.; supervision, J.S.; writing—review and editing, J.S. and J.A.; methodology, H.C.; formal analysis, H.C.; software, H.C.; visualization, H.C. All authors have read and agreed to the published version of the manuscript.
Funding
This research was supported by the Korea Institute of Energy Technology Evaluation and Planning (KETEP), the Ministry of Trade, Industry & Energy (MOTIE) of the Republic of Korea (20224000000260), and the National Research Foundation of Korea (NRF) grant provided by the Korean government (MSIT) (No. RS-2022-00165886).
Data Availability Statement
Authors do not have right to share the data.
Acknowledgments
This study is partially based on “Development of Policy Effectiveness Indicators Reflecting the Social Value of Water Projects”, which was conducted with the support of the Ministry of Environment of the Republic of Korea and K-water in 2022.
Conflicts of Interest
The authors declare that there are no competing interests.
References
- Wilson, C.; Athukorala, W.; Torgler, B.; Gifford, R.; Garcia-Valiñas, M.A.; Managi, S. Willingness to pay to ensure a continuous water supply with minimum restrictions. Empirical Econ. 2021, 61, 1519–1537. [Google Scholar] [CrossRef]
- Stock, A.; Davidson, R.A.; Kendra, J.; Martins, V.N.; Ewing, B.; Nozick, L.K.; Starbird, K.; Leon-Corwin, M.; Leon-Corwin, M. Household impacts of interruption to electric power and water services. Nat. Hazards 2023, 115, 2279–2306. [Google Scholar] [CrossRef]
- Aubuchon, C.P.; Morley, K.M. The economic value of water: Providing confidence and context to FEMA’s methodology. J. Homel. Secur. Emerg. Manag. 2013, 10, 245–265. [Google Scholar] [CrossRef]
- Piratla, K.R. Investigation of sustainable and resilient design alternatives for water distribution networks. Urban. Water J. 2016, 13, 412–425. [Google Scholar] [CrossRef]
- Guzmán, D.A.; Mohor, G.S.; Mendiondo, E.M. Multi-driver ensemble to evaluate the water utility business interruption cost induced by hydrological drought risk scenarios in Brazil. Urban. Water J. 2023, 20, 1517–1531. [Google Scholar] [CrossRef]
- Brozović, N.; Sunding, D.L.; Zilberman, D. Estimating business and residential water supply interruption losses from catastrophic events. Water Resour. Res. 2007, 43, W08423. [Google Scholar] [CrossRef]
- Heflin, C.; Jensen, J.; Miller, K. Understanding the economic impacts of disruptions in water service. Eval. Program. Plan. 2014, 46, 80–86. [Google Scholar] [CrossRef]
- Rasoulkhani, K.; Mostafavi, A.; Cole, J.; Sharvelle, S. Resilience-based infrastructure planning and asset management: Study of dual and singular water distribution infrastructure performance using a simulation approach. Sustain. Cities Soc. 2019, 48, 101577. [Google Scholar] [CrossRef]
- Araya, N.; Lucay, F.A.; Cisternas, L.A.; Gálvez, E.D. Design of desalinated water distribution networks: Complex topography, energy production, and parallel pipelines. Ind. Eng. Chem. Res. 2018, 57, 9879–9888. [Google Scholar] [CrossRef]
- Fu, H.; Ling, K.; Pu, H. Identifying two-point leakages in parallel pipelines based on flow parameter analysis. J. Pipeline Sci. Eng. 2022, 2, 100052. [Google Scholar] [CrossRef]
- Dell’Aira, F.; Cancelliere, A.; Creaco, E.; Pezzinga, G. Novel comprehensive approach for phasing design and rehabilitation of water distribution networks. J. Water Resour. Plan. Manag. 2021, 147, 04021001. [Google Scholar] [CrossRef]
- Halhal, D.; Walters, G.A.; Ouazar, D.; Savic, D.A. Water network rehabilitation with structured messy genetic algorithm. J. Water Resour. Plan. Manag. 1997, 123, 137–146. [Google Scholar] [CrossRef]
- Kim, T.; Shin, J.; Hyung, J.; Kim, K.; Koo, J.; Cha, Y. Willingness to pay for improved water supply services based on asset management: A contingent valuation study in South Korea. Water 2021, 13, 2040. [Google Scholar] [CrossRef]
- Tussupova, K.; Berndtsson, R.; Bramryd, T.; Beisenova, R. Investigating willingness to pay to improve water supply services: Application of contingent valuation method. Water 2015, 7, 3024–3039. [Google Scholar] [CrossRef]
- Hao, Q.; Xu, S.; Liao, Y.; Qiao, D.; Shi, H.; Xu, T. Determinants of residents’ willingness to pay for water quality improvements in Haikou, China: Application of CVM and ISM approaches. Water 2023, 15, 1305. [Google Scholar] [CrossRef]
- Bogale, A.; Urgessa, B. Households’ willingness to pay for improved rural water service provision: Application of contingent valuation method in Eastern Ethiopia. J. Hum. Ecol. 2012, 38, 145–154. [Google Scholar] [CrossRef]
- Sehreen, F.; Masud, M.M.; Akhtar, R.; Masum, M.R.A. A contingent valuation approach to evaluating willingness to pay for an improved water pollution management system in Dhaka City, Bangladesh. Environ. Monit. Assess. 2019, 191, 457. [Google Scholar] [CrossRef]
- Douglas, A.J.; Harpman, D.A. Lake Powell management alternatives and values: CVM estimates of recreation benefits. Water Int. 2004, 29, 375–383. [Google Scholar] [CrossRef]
- Jimenez-Redal, R.; Arana-Landín, G.; Landeta, B.; Larumbe, J. Willingness to pay for improved operations and maintenance services of gravity-fed water schemes in Idjwi Island (Democratic Republic of the Congo). Water 2021, 13, 1050. [Google Scholar] [CrossRef]
- Byambadorj, A.; Lee, H.S. Household willingness to pay for wastewater treatment and water supply system improvement in a Ger area in Ulaanbaatar City, Mongolia. Water 2019, 11, 1856. [Google Scholar] [CrossRef]
- Aslam, H.; Liu, J.; Mazher, A.; Mojo, D.; Muhammad, I.; Fu, C. Willingness to pay for improved water services in mining regions of developing economies: Case study of a coal mining project in Thar Coalfield, Pakistan. Water 2018, 10, 481. [Google Scholar] [CrossRef]
- Lee, S.; Nguyen, T.T.; Kim, H.N.; Koellner, T.; Shin, H.J. Do consumers of environmentally friendly farming products in downstream areas have a WTP for water quality protection in upstream areas? Water 2017, 9, 511. [Google Scholar] [CrossRef]
- Kriström, B. Spike models in contingent valuation. Am. J. Agric. Econ. 1997, 79, 1013–1023. [Google Scholar] [CrossRef]
- Kwak, S.Y.; Yoo, S.H.; Kim, C.S. Measuring the willingness to pay for tap water quality improvements: Results of a contingent valuation survey in Pusan. Water 2013, 5, 1638–1652. [Google Scholar] [CrossRef]
- Kontogianni, A.; Langford, I.H.; Papandreou, A.; Skourtos, M.S. Social preferences for improving water quality: An economic analysis of benefits from wastewater treatment. Water Resour. Manag. 2003, 17, 317–336. [Google Scholar] [CrossRef]
- Paola, V.; Mustafa, A.A.; Giacomo, Z. Willingness to pay for recreational benefit evaluation in a wastewater reuse project. Analysis of a case study. Water 2018, 10, 922. [Google Scholar] [CrossRef]
- Choi, I.C.; Kim, H.N.; Shin, H.J.; Tenhunen, J.; Nguyen, T.T. Willingness to pay for a highland agricultural restriction policy to improve water quality in South Korea: Correcting anomalous preference in contingent valuation method. Water 2016, 8, 547. [Google Scholar] [CrossRef]
- Sewunet, B.; Gizeyatu, A.; Lingerew, M.; Girma, H.; Keleb, A.; Malede, A.; Adane, M.; Woretaw, L.; Adane, B.; Mulu, B.; et al. On the use of contingent valuation method to assess factors affecting the contribution of local people for the management of water hyacinth in Lake Tana, northwestern Ethiopia. Environ. Sci. Pollut. Res. Int. 2022, 29, 88147–88160. [Google Scholar] [CrossRef]
- Bui, N.T.; Darby, S.; Vu, T.Q.; Mercado, J.M.R.; Bui, T.T.P.; Kantamaneni, K.; Nguyen, T.T.H.; Truong, T.N.; Hoang, H.T.; Bui, D.D.; et al. Willingness to pay for improved urban domestic water supply system: The case of Hanoi, Vietnam. Water 2022, 14, 2161. [Google Scholar] [CrossRef]
- Vásquez, W.F.; Mozumder, P.; Hernández-Arce, J.; Berrens, R.P. Willingness to pay for safe drinking water: Evidence from Parral, Mexico. J. Environ. Manag. 2009, 90, 3391–3400. [Google Scholar] [CrossRef]
- Del Saz-Salazar, S.; García-Rubio, M.A.; González-Gómez, F.; Picazo-Tadeo, A.J. Managing water resources under conditions of scarcity: On consumers’ willingness to pay for improving water supply infrastructure. Water Resour. Manag. 2016, 30, 1723–1738. [Google Scholar] [CrossRef]
- Genius, M.; Hatzaki, E.; Kouromichelaki, E.M.; Kouvakis, G.; Nikiforaki, S.; Tsagarakis, K.P. Evaluating consumers’ willingness to pay for improved potable water quality and quantity. Water Resour. Manag. 2008, 22, 1825–1834. [Google Scholar] [CrossRef]
- Gregory, R.S. Valuing environmental policy options: A case study comparison of multiattribute and contingent valuation survey methods. Land Econ. 2000, 76, 151–173. [Google Scholar] [CrossRef]
- Choi, H.; Lee, J.; Koo, Y. Value of different electric vehicle charging facility types under different availability situations: A South Korean case study of electric vehicle and internal combustion engine vehicle owners. Energy Policy 2023, 174, 113436. [Google Scholar] [CrossRef]
- Choi, H.; Koo, Y. Using contingent valuation and numerical methods to determine optimal locations for environmental facilities: Public arboretums in South Korea. Ecol. Econ. 2018, 149, 184–201. [Google Scholar] [CrossRef]
- Lee, H.; Choi, H.; Koo, Y. Lowering customer’s switching cost using B2B services for telecommunication companies. Telemat. Inform. 2018, 35, 2054–2066. [Google Scholar] [CrossRef]
- Venkatachalam, L. The contingent valuation method: A review. Environ. Impact Assess. Rev. 2004, 24, 89–124. [Google Scholar] [CrossRef]
- Hanemann, W.M. Welfare evaluations in contingent valuation experiments with discrete responses. Am. J. Agric. Econ. 1984, 66, 332–341. [Google Scholar] [CrossRef]
- Arrow, K.; Solow, R.; Portney, P.R.; Leamer, E.E.; Radner, R.; Schuman, H. Report of the NOAA panel on contingent valuation. Fed. Regist. 1993, 58, 4601–4614. [Google Scholar]
- Lee, C.-Y.; Heo, H. Estimating willingness to pay for renewable energy in South Korea using the contingent valuation method. Energy Policy 2016, 94, 150–156. [Google Scholar] [CrossRef]
- Yoo, S.H.; Kwak, S.Y. Willingness to pay for green electricity in Korea: A contingent valuation study. Energy Policy 2009, 37, 5408–5416. [Google Scholar] [CrossRef]
- Rogers, P.; Bhatia, R.; Huber, A. Water as a social and economic good: How to put the principle into practice. In Paper Prepared for the Meeting of the Technical Advisory Committee of the Global Water Partnership in Namibia; World Bank: Washington, DC, USA, 1997. [Google Scholar]
- Turner, R.K.; Postle, M. Valuing Water: An Economic Perspective; CSERGE Working Paper WM94-08; University of East Anglia and University College London: London, UK, 1994. [Google Scholar]
- De Groot, R.S. Functions of Nature; Wolters-Noordhoff: Amsterdam, The Netherlands, 1992. [Google Scholar]
- Sivakumar, S.S. Strategies for catchment development master plan and economic aspects of water resource planning. Int. J. Sci. Res. Publ. 2014, 4, 1–5. [Google Scholar]
- Hanley, N.; Wright, R.E.; Alvarez-Farizo, B. Estimating the economic value of improvements in river ecology using choice experiments: An application to the water framework directive. J. Environ. Manag. 2006, 78, 183–193. [Google Scholar] [CrossRef] [PubMed]
- Elmasry, M.; Hawari, A.; Zayed, T. Cost benefit analysis for failure of sewer pipelines. MATEC Web Conf. 2017, 120, 08006. [Google Scholar] [CrossRef]
- Zhang, J. The impact of water quality on health: Evidence from the drinking water infrastructure program in rural China. J. Health Econ. 2012, 31, 122–134. [Google Scholar] [CrossRef]
- Harrington, W.; Krupnick, A.J.; Spofford, W.O. The economic losses of a waterborne disease outbreak. J. Urban. Econ. 1989, 25, 116–137. [Google Scholar] [CrossRef]
- Groom, B.; Koundouri, P. The economics of water resource allocation: Valuation methods and policy implications. In Water Resources Allocation; Springer: Dordrecht, The Netherlands, 2011; pp. 89–109. [Google Scholar]
- Young, R.A. Measuring Economic Benefits for Water Investments and Policies; World Bank Technical Paper No. 338; World Bank: Washington, DC, USA, 1996. [Google Scholar]
- Wu, Z.; Di, D.; Lv, C.; Guo, X.; Wang, H. Defining and evaluating the social value of regional water resources in terms of emergy. Water Policy 2019, 21, 73–90. [Google Scholar] [CrossRef]
- Lv, H.; Yang, L.; Zhou, J.; Zhang, X.; Wu, W.; Li, Y.; Jiang, D. Water resource synergy management in response to climate change in China: From the perspective of urban metabolism. Resour. Conserv. Recy 2020, 163, 105095. [Google Scholar] [CrossRef]
- Fisher, F.M.; Arlosoroff, S.; Eckstein, Z.; Haddadin, M.; Hamati, S.G.; Huber-Lee, A.; Jarrar, A.; Jayyousi, A.; Shamir, U.; Wesseling, H. Optimal water management and conflict resolution: The Middle East water project. Water Resour. Res. 2002, 38, 25-1–25-17. [Google Scholar] [CrossRef]
- Moosdorf, N.; Oehler, T. Societal use of fresh submarine groundwater discharge: An overlooked water resource. Earth Sci. Rev. 2017, 171, 338–348. [Google Scholar] [CrossRef]
- Dinar, S.; Katz, D.; De Stefano, L.; Blankespoor, B. Climate change, conflict, and cooperation: Global analysis of the effectiveness of international river treaties in addressing water variability. Pol. Geogr. 2015, 45, 55–66. [Google Scholar] [CrossRef]
- Mesa-Jurado, M.A.; Martin-Ortega, J.; Ruto, E.; Berbel, J. The economic value of guaranteed water supply for irrigation under scarcity conditions. Agric. Water Manag. 2012, 113, 10–18. [Google Scholar] [CrossRef]
- Wei, J.; Wei, Y.; Western, A. Evolution of the societal value of water resources for economic development versus environmental sustainability in Australia from 1843 to 2011. Glob. Environ. Chang. 2017, 42, 82–92. [Google Scholar] [CrossRef]
- Krinsky, I.; Robb, A.L. On approximating the statistical properties of elasticities. Rev. Econ. Stat. 1986, 68, 715–719. [Google Scholar] [CrossRef]
- Daegu-Gumi Water Dispute, Promised to Resolve through a Shift in Perspective, But. KBS News. 24 August 2022. Available online: https://news.kbs.co.kr/news/pc/view/view.do?ncd=5540147 (accessed on 21 November 2023). (In Korean).
- Imandoust, S.B.; Gadam, S.N. Are people willing to pay for river water quality, contingent valuation. Int. J. Environ. Sci. Technol. 2007, 4, 401–408. [Google Scholar] [CrossRef]
- Birol, E.; Karousakis, K.; Koundouri, P. Using economic valuation techniques to inform water resources management: A survey and critical appraisal of available techniques and an application. Sci. Total Environ. 2006, 365, 105–122. [Google Scholar] [CrossRef] [PubMed]
- Jalilov, S.M. Value of clean water resources: Estimating the water quality improvement in Metro Manila, Philippines. Resources 2017, 7, 1. [Google Scholar] [CrossRef]
- Rahman, M.M.; Alam, K.; Karim, R.; Islam, M.K. Willingness to pay for improved water supply: A policy implication for future water security. Am. J. Environ. Resour. Econ. 2017, 2, 116–122. [Google Scholar]
Figure 1.
Research framework of this study.
Figure 1.
Research framework of this study.
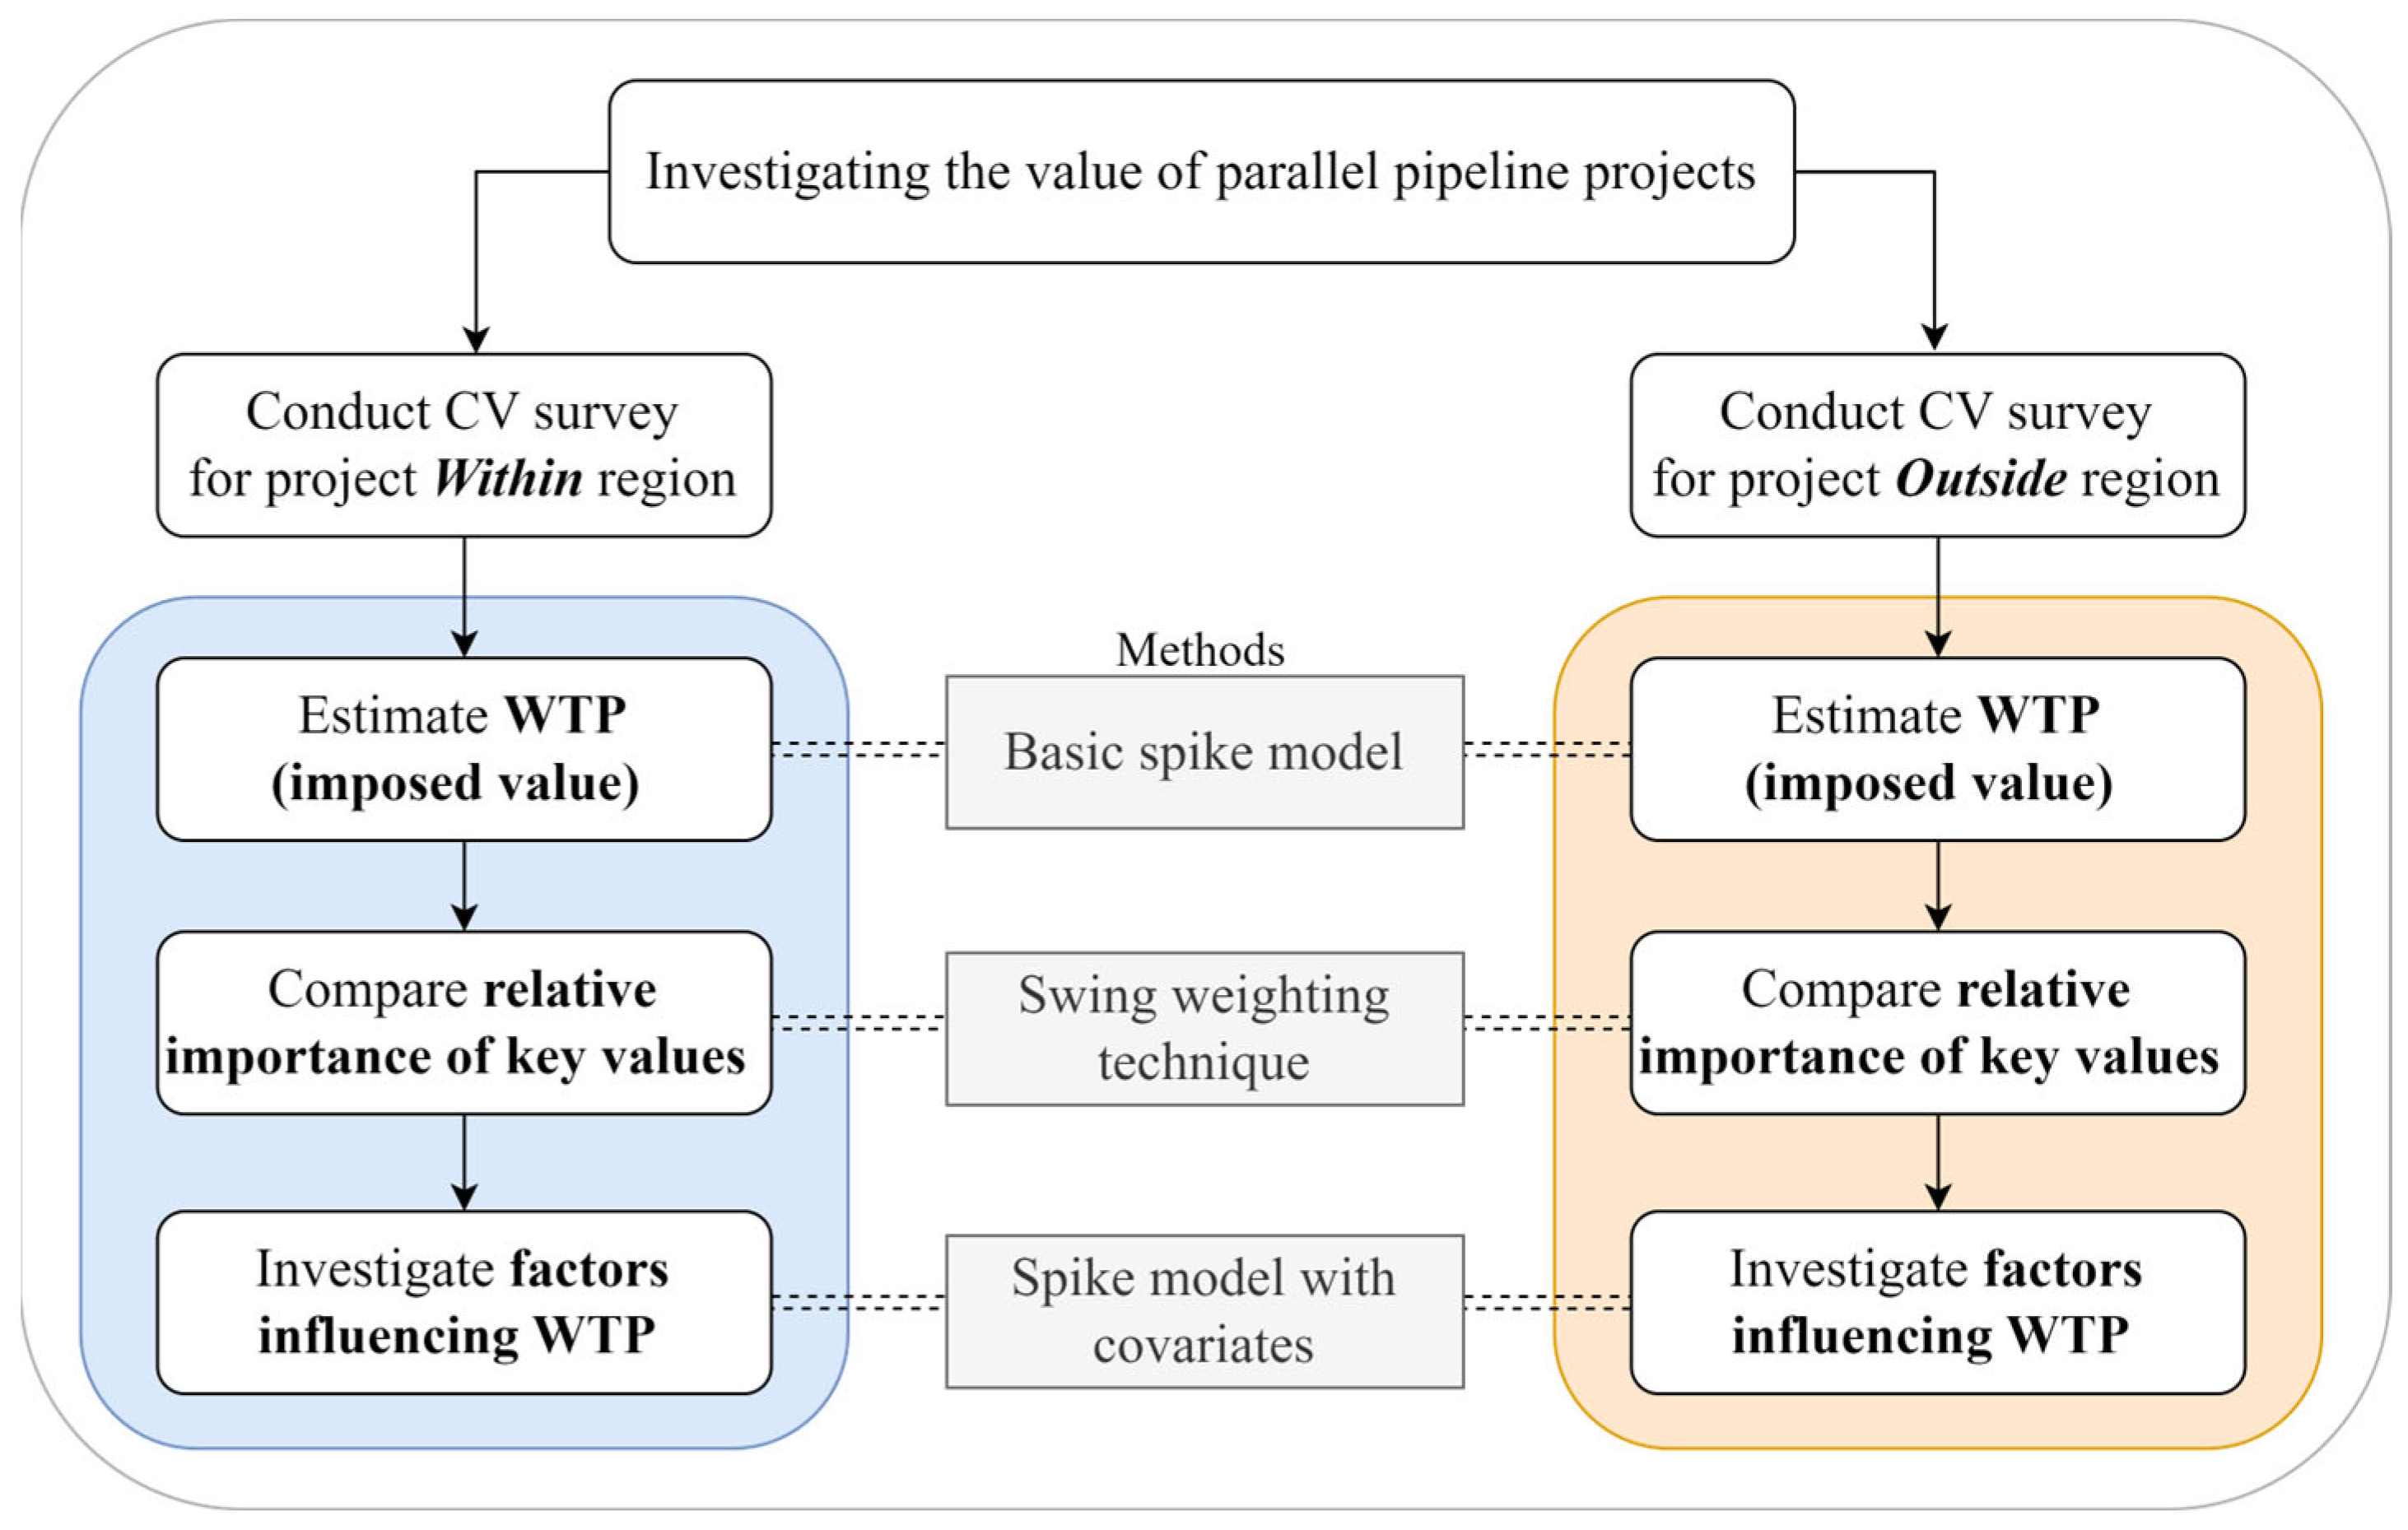
Figure 2.
Annual willingness to pay per household for projects within and outside region.
Figure 2.
Annual willingness to pay per household for projects within and outside region.
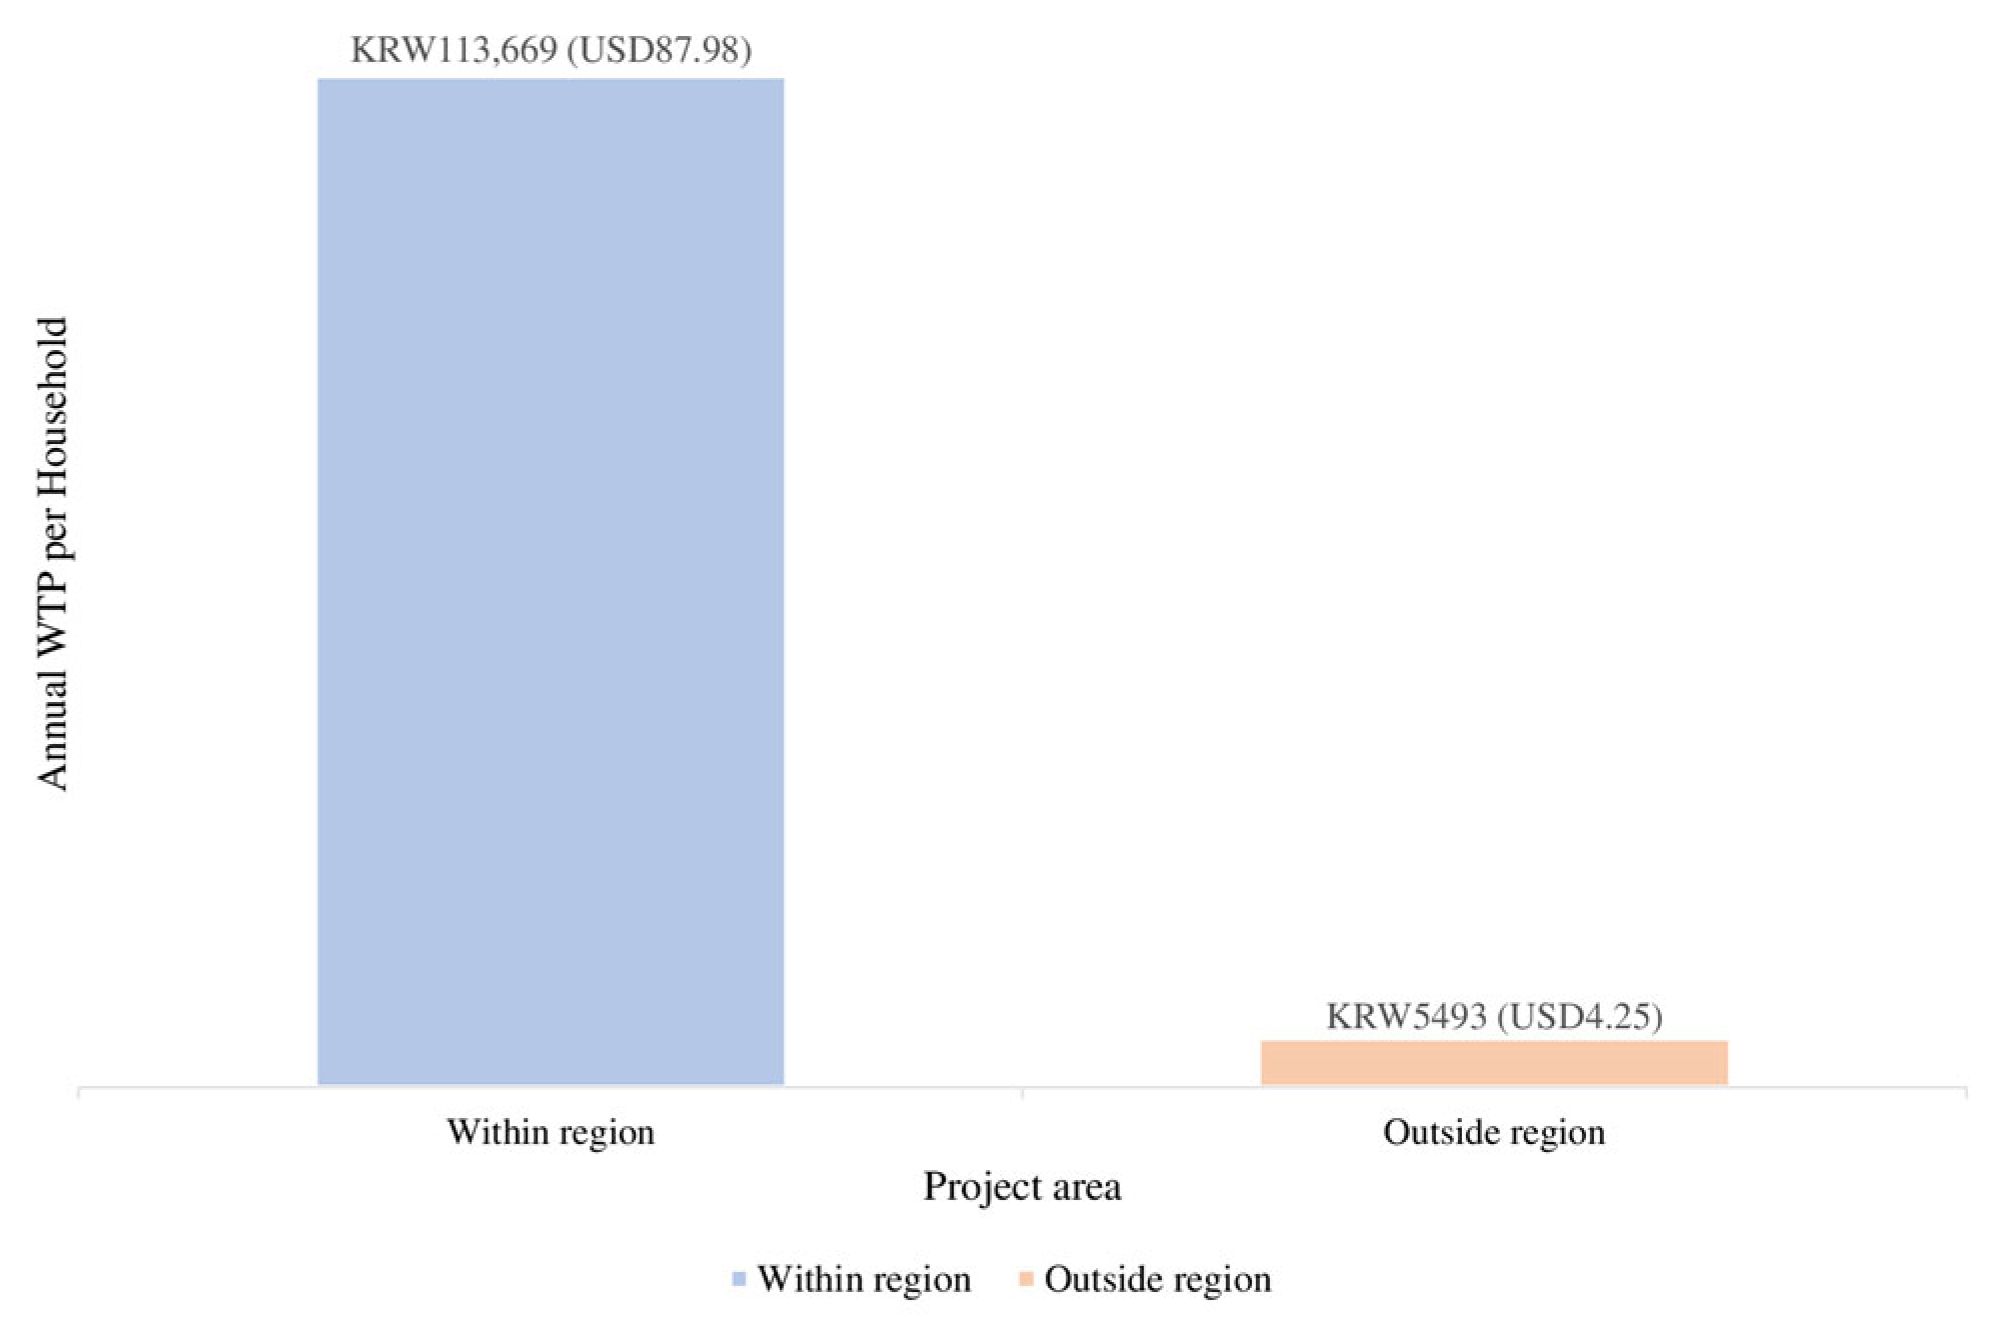
Table 2.
Social value items assumed for swing weighting technique.
Table 2.
Social value items assumed for swing weighting technique.
| Key Value Items | Description | References |
|---|---|---|
| Environmental | Improving water quality and the environment surrounding water resources and infrastructure | [42,43,44,45,46] |
| Health and sanitation | Preventing diseases and maintaining a sanitary environment | [47,48,49] |
| Climate change response | Effectively corresponding to increasing natural disasters (e.g., floods, droughts, and fires) and reducing carbon emissions. | [50,51,52,53] |
| Community integration | Resolving inter-regional water conflicts, protecting the vulnerable groups, and strengthening the community consciousness | [42,54,55,56] |
| Industrial–economic | Maintaining and invigorating the local and national economy and accumulating and promoting related knowledge and research | [42,44,52,57] |
| Maintaining and improving living conditions | Preventing inconveniences related to infrastructure maintenance and preserving the basic standard of living | [45,49,58] |
Table 3.
Response distribution of the contingent valuation survey.
Table 3.
Response distribution of the contingent valuation survey.
| Case | Bid (KRW) |
Number of Samples |
Responses | ||
|---|---|---|---|---|---|
| Yes | No–Yes | No–No (Zero WTP) |
|||
| Within region | 100 | 230 | 152 (66.1%) | 38 (16.5%) | 40 (17.4%) |
| 200 | 204 | 147 (72.1%) | 28 (13.7%) | 29 (14.2%) | |
| 300 | 195 | 125 (64.1%) | 32 (16.4%) | 38 (19.5%) | |
| 500 | 216 | 107 (49.5%) | 60 (27.8%) | 49 (22.7%) | |
| 1000 | 210 | 116 (55.2%) | 59 (28.1%) | 35 (16.7%) | |
| Total | 1055 | 647 (61.3%) | 217 (20.6%) | 191 (18.1%) | |
| Outside region | 1000 | 209 | 115 (55%) | 48 (23%) | 46 (22%) |
| 3000 | 216 | 102 (47.2%) | 55 (25.5%) | 59 (27.3%) | |
| 6000 | 223 | 97 (43.5%) | 53 (23.8%) | 73 (32.7%) | |
| 10,000 | 208 | 87 (41.8%) | 56 (26.9%) | 65 (31.3%) | |
| 20,000 | 199 | 58 (29.1%) | 60 (30.2%) | 81 (40.7%) | |
| Total | 1055 | 459 (43.5%) | 272 (25.8%) | 324 (30.7%) | |
Table 4.
Estimation results of the basic spike model.
Table 4.
Estimation results of the basic spike model.
| Within Region | Outside Region | |
|---|---|---|
| Intercept (a) | 1.3594 *** (18.64) |
0.6782 *** (10.87) |
| Bid (b) | −1.9687 *** (−17.51) |
−0.1235 *** (−18.78) |
| Spike a | 0.2043 *** (17.23) |
0.3367 *** (24.15) |
| Number of observations | 1055 | 1055 |
| Log-likelihood | −1032.8503 | −1235.851 |
| Mean WTP (KRW) b | 807 | 8817 |
| 95% Confidence interval c | [724, 894] | [7787, 10,028] |
| Median WTP (KRW) d | 691 | 5493 |
| 95% Confidence interval c | [614, 768] | [4517, 6574] |
Table 5.
Results from the swing weighting.
Table 5.
Results from the swing weighting.
| Value Items | Within | Outside | ||
|---|---|---|---|---|
| Relative Importance (Average Score) |
Annual Value from One Million Households (Unit: One Billion KRW) |
Relative Importance (Average Score) |
Annual Value from One Million Households (Unit: One Billion KRW) |
|
| 1. Environmental | 17.6% (78.5) |
20.0 | 17.3% (78.1) |
0.942 |
| 2. Health and sanitation | 18.2% (81.3) |
20.7 | 18.0% (81.0) |
0.977 |
| 3. Climate change response | 16.5% (73.9) |
18.8 | 16.4% (73.9) |
0.891 |
| 4. Community integration | 15.3% (68.3) |
17.4 | 15.6% (70.4) |
0.849 |
| 5. Industrial–economic | 14.8% (66.4) |
16.9 | 15.2% (68.5) |
0.826 |
| 6. Maintaining and improving living conditions | 17.6% (78.9) |
20.1 | 17.6% (79.2) |
0.955 |
| Total | 113.7 | 5.439 | ||
Table 6.
Estimation results of the spike model with covariates.
Table 6.
Estimation results of the spike model with covariates.
| Within Region | Outside Region | ||
|---|---|---|---|
| Constant (a) | −0.2063 (−0.34) |
−0.0096 (−0.01) |
|
| Gender (male: 1, female: 0) | 0.2808 ** (2.14) |
0.0880 (0.73) |
|
| Age (unit: year) | −0.0019 (−0.37) |
−0.0044 (−0.89) |
|
| Education (unit: year) | −0.0114 (−0.38) |
0.0205 (0.75) |
|
| Resides in the Seoul Metropolitan Area (1: yes, 0: no) |
0.0386 (0.25) |
0.0357 (0.26) |
|
| Monthly household income (unit: million KRW) |
0.0798 ** (2.53) |
0.0207 (0.72) |
|
| Household members (unit: person) | 0.1188 * (1.92) |
0.0549 (0.95) |
|
| Monthly water bill (unit: KRW) |
−0.0183 (−0.43) |
0.0409 (1.03) |
|
| Water cut-off experience (experienced: 1, not experienced: 0) |
0.1392 (1.07) |
0.1802 (1.51) |
|
| Urgent improvement is required for the following values: | 1. Environmental | −0.0401 (−0.40) |
−0.1418 (−1.54) |
| 2. Health and sanitation | −0.0839 (−0.86) |
−0.1068 (−1.20) |
|
| 3. Climate change response | 0.1974 ** (2.23) |
0.0018 (0.02) |
|
| 4. Community integration | 0.1758 * (1.71) |
0.0957 (1.02) |
|
| 5. Industrial–economic | −0.0575 (−0.57) |
0.1642 * (1.77) |
|
| 6. Maintaining and improving living conditions | 0.0711 (0.68) |
0.0138 (0.14) |
|
| Bid (b) | −2.0253 *** (−17.49) |
−0.1252 *** (−18.78) |
|
| Spike a | 0.1965 (16.59) | 0.3341 (23.82) |
|
| Number of observations | 1055 | 1055 | |
| Log-likelihood | −1014.20 | −1224.87 | |
| Mean WTP (KRW) b | 803 | 8572 | |
| Mean WTP 95% C.I. c | [718, 897] | [7736, 9866] | |
| Median WTP (KRW) d | 695 | 5505 | |
| Median WTP 95% C.I. c | [618, 788] | [4610, 6505] | |
|
Disclaimer/Publisher’s Note: The statements, opinions and data contained in all publications are solely those of the individual author(s) and contributor(s) and not of MDPI and/or the editor(s). MDPI and/or the editor(s) disclaim responsibility for any injury to people or property resulting from any ideas, methods, instructions or products referred to in the content. |
[ad_2]