Methodology for Monitoring Border Crossing Delays with Connected Vehicle Data: United States and Mexico Land Crossings Case Study
1. Introduction
In 2022, the United States trade in goods with Mexico accounted for USD 779 billion [1,2]. Mexico is the United States’ top trade partner [3], and these countries have strong free trade agreements such as the United States–Mexico–Canada Agreement (USMCA), which substituted the previous North America Free Trade Agreement (NAFTA) [4,5]. Land border ports between the US and Mexico are some of the busiest ports [6]. More than 73 million passenger vehicles and 7 million trucks cross these land borders annually. Time spent waiting in traffic queues at border crossings constitutes a loss of value and productivity for millions of these passengers, and time delay is often used as an important metric for assessing the performance of these border crossings. Techniques to longitudinally track such delays at scale are lacking. The purpose of this study is to demonstrate novel easily scalable methodologies to monitor such travel time delays at border crossings by analyzing more than 166 billion records from connected vehicles. However, some delay at border crossings is necessary to ensure appropriate checks and balances are provided to ensure mutual compliance with agricultural, business, and government policies of both countries. This paper does not make any recommendations on what the appropriate delay is; it merely focuses on techniques to collect that delay information to inform stakeholders and decision makers.
2. Literature Review
2.1. Land Border Crossing Performance Measurement Technology
A diverse range of equipment, methodologies and techniques have been utilized by researchers and practitioners in the past to collect, assess and report travel time delays on roadways [7,8,9,10]. In the early 1990s, researchers proposed prediction models to estimate vehicle delays and subsequently provided this insight to motorist information systems. These techniques, however, inherently involve manual traffic data collection procedures [11]. The Federal Highway Administration’s (FHWA) Travel Time Data Collection Handbook provided an excellent overview of several such data collection techniques, as of its publication in March 1998 [12], broadly categorized under test vehicles, license plate matching [13,14,15,16], intelligent transportation system (ITS) probe vehicles [17,18,19,20,21,22] and emerging techniques [23].
License plate matching techniques for recording travel times are able to capture observations from a large sample of vehicles and involve equipment that is relatively portable. However, this technique is dependent upon deploying infrastructure such as cameras and is cost-prohibitive for systemwide analysis. Furthermore, there is substantial maintenance required to maintain cameras and update software as license plate motifs evolve [23,24].
Bluetooth detectors have traditionally been a low cost and easy-to-install option for detecting travel times on roadway segments [25]. However, they may detect unnecessary ramp traffic and are dependent on the vehicles having Bluetooth-enabled devices onboard. Secondly, as this technique only records a specific media access control (MAC) address for a Bluetooth-enabled device and the time at which it passed a sensor, it may not be able to accurately detect the travel mode (vehicular or pedestrian, for example) and require further clustering and classification, as demonstrated by the existing literature [26].
Other techniques including floating car runs [27,28,29,30], video detection [31,32,33], and cell phone tracking [25,34,35,36], while providing valuable insights into travel time distributions, are either time, labor or cost-intensive for system-level deployment, spatially and/or temporally constrained, and heavily dependent on the accuracy of data collection and analysis procedures. Most of the existing approaches to travel time measurements rely on records captured at fixed checkpoints or sensor placement locations and rarely provide waypoint-level information to track impacts of mid-route delays on traffic flow characteristics.
Agencies have used a variety of methods to report border crossing wait times in the past [37], including visual reports, driver surveys [38], license plate recognition, radio frequency identifiers [39], aerial surveys and anecdotal evidence from customs and border protection personnel [40]. However, these techniques are often resource-intensive and significantly cost-prohibitive to scale up. Similar efforts using field data collection procedures at customs and immigration plazas were utilized to model travel time delays at border crossings in northern New York [41].
Over the past decade, emerging sources of crowdsourced segment-based probe vehicle data have shown great promise in helping monitor roadway mobility performance at the system level. While effective in recording travel times over longer distances, some sources tend to mask localized travel time delays within a segment due to coarse segment lengths. Secondly, segment-based data naturally involves pre-processing which results in reporting latencies which may cause concerns for real-time applications, such as dynamic message boards and signs displaying travel time information for motorists [42]. Finally, pre-defined thresholds of minimum trip counts and confidence scores established by data providers may result in the mischaracterization of roadway closures during active incidents, which could potentially be remedied using raw vehicle trajectory data in place of aggregated segment-based data.
2.2. Emerging Connected Vehicle Technology
Recently, emerging, anonymized connected vehicle (CV) trajectory data have emerged as an attractive data source due to the granular waypoint-level information, near real-time availability, and lack of requirement for deploying fixed ITS sensor infrastructure. Such data have already shown great promise and applicability in a variety of domains [43], monitoring work zone operations [44,45], evaluating work zone safety solutions [46], assessing traffic signal performance [47], evaluating the impact of inclement weather on roadway mobility [48,49], monitoring volume trends [50], and monitoring detour activity. The fundamental benefit of CV data is the waypoint-level fidelity which allows for a CV journey to be tracked continuously as it passes through a study location. Multiple studies have shown the representativeness of this data in a number of US states including Delaware [51], Florida [52], Indiana [53], Iowa [54], New Jersey [55], Ohio and Pennsylvania [56], among others.
A recent study explored the use of CV trajectory data to estimate border crossing times at the Paso Del Norte International Bridge in El Paso, Texas, and compared results with Bluetooth readers to demonstrate highly similar results from both techniques (a high correlation coefficient of 0.89) [57,58]. However, a scalable methodology for a nationwide system level analysis of travel times using CV data across multiple border crossing points has not been proposed in the existing literature.
3. Paper Objective
The objective of this paper is to address the need to provide the monitoring of land border crossing travel time delays. The research problem is then designed to use emerging CV data to formulate novel and easily scalable methodologies for this purpose that can be applied in a systematic manner across all land border crossings. This is important at the individual site level to manage staffing and at the regional and national level to monitor both short-term and long-term trends to most effectively allocate resources in a manner that holistically considers security and economic efficiency. The use of such methodologies is demonstrated using the land border crossings between the US and Mexico as a case study. The paper is organized as follows:
-
Border crossings and select locations analyzed during this study (Section 4).
-
Connected Vehicle data attributes available for analysis (Section 5).
-
Scalable methodology for identifying trips and corresponding travel time (Section 6).
-
Results from the analysis and graphics for agencies (Section 7).
-
Summary of trips detected by location and direction (Section 7.1).
-
Estimating travel time delay individually for identified trips (Section 7.2).
-
Comparison of travel delays at border crossings (Section 7.3)
-
Ranking the border crossings using four metrics (Section 7.4)
-
Metric 3—Top Five border crossings with most trips with delays greater than 5 min (Section 7.4.3).
-
-
Actionable insights from delay trends by Time of Day and Day of Week (Section 7.5).
-
4. Study Locations
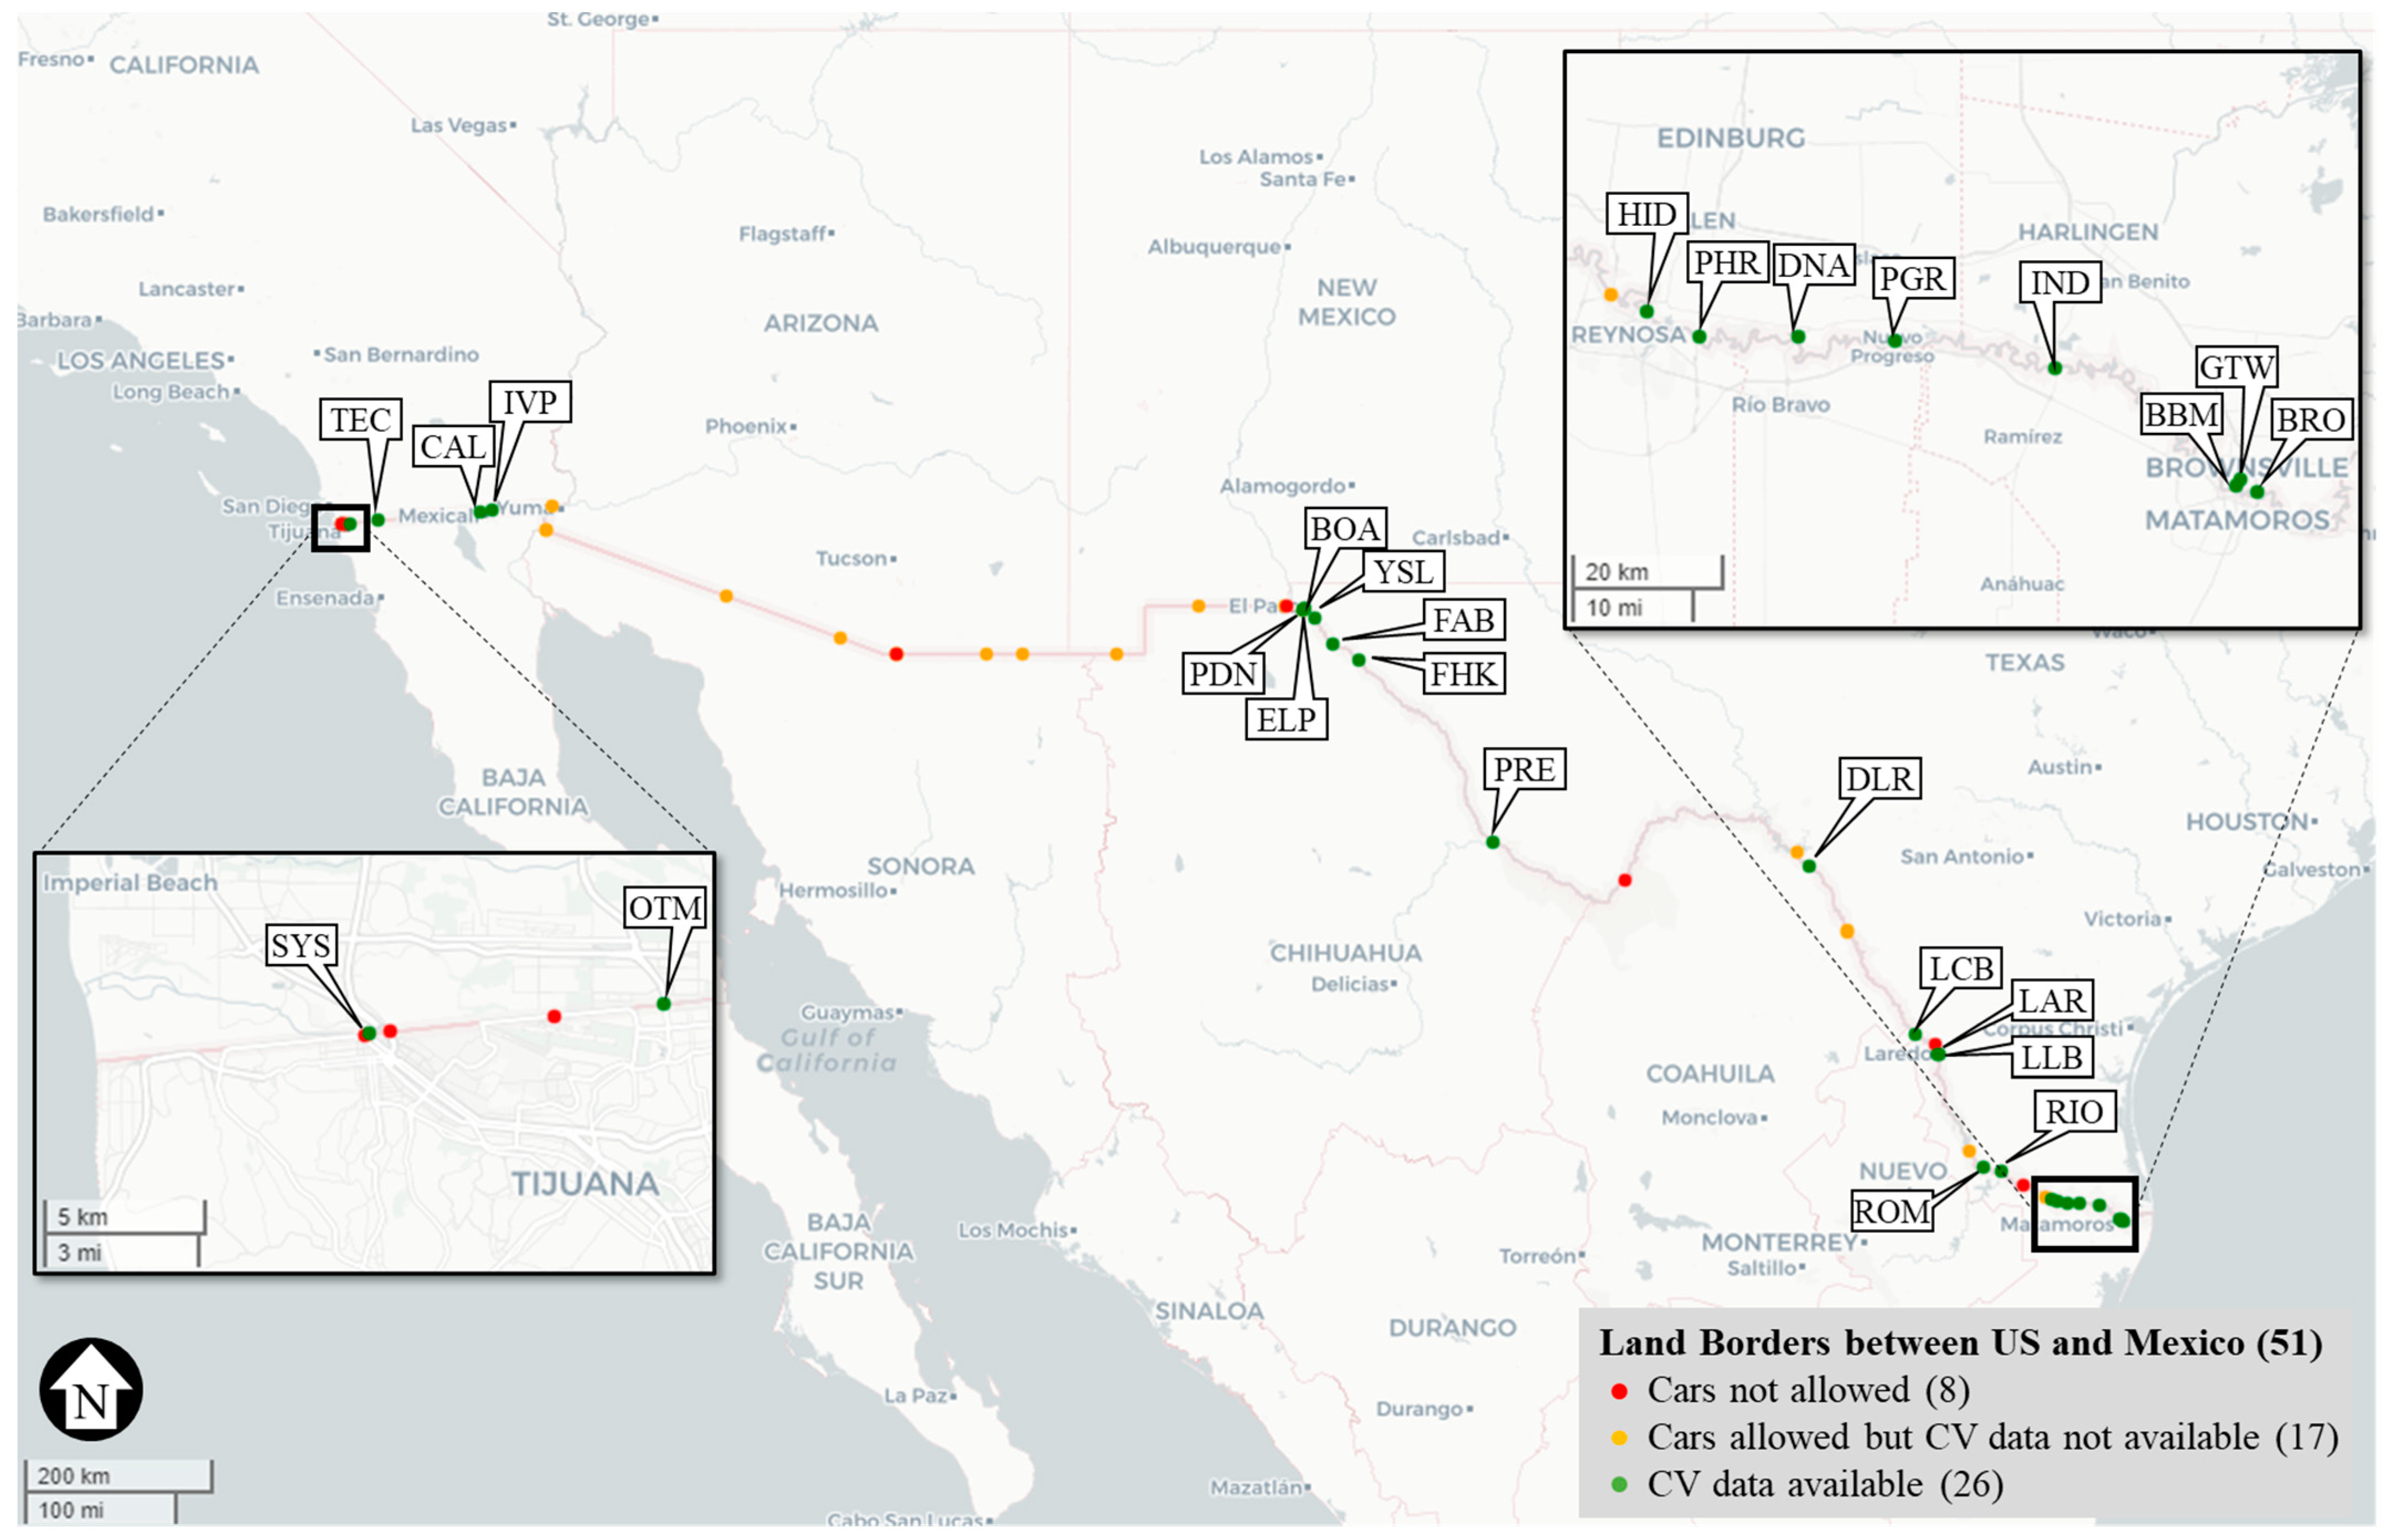
There are approximately fifty-one vehicle and pedestrian crossing locations between the United States (US) and Mexico (MX) [59]. These border crossings include four US border states: California, Arizona, New Mexico and Texas (Figure 1). Eight of these locations are dedicated for pedestrians only, shown as red dots in Figure 1.
CV data used for analysis during this study are available for the majority of California and Texas. Due to the availability of the CV data, study locations are limited to 26 border crossings where both cars are allowed and CV data are available in these two states, highlighted by green dots in Figure 1. Each of the border crossings is denoted by a callout with its respective three letter code for the US port of entry [60]. Summary details for these 26 border crossings are presented in Table 1. Of the 26 crossings, 5 are in the state of California and 21 in Texas. PDN [61] and LAR [62] crossings in Texas were allowed only one-way northbound traffic, i.e., trips from MX to the US. All the California crossings connect to Baja California state in MX. Crossings in Texas connect to Chihuahua, Coahuila, Nuevo León and Tamaulipas states in MX. Details about roads connecting to these crossings and the year since they have been operational are also presented in Table 1.
5. Data Description
Anonymized trajectory data were provided by a third party with information about each of the connected vehicles. A connected vehicle is defined as any vehicle that frequently transmits information to its original equipment manufacturer (OEM). A third party combines and anonymizes such data from multiple OEMs before distribution. Every connected vehicle provides a waypoint with the attribute information at intervals of 3 to 5 s. The attributes of each waypoint comprise an anonymous journey identifier, speed, location, heading and ignition status. The ignition status provides information about the vehicle after it has just been turned on or if the waypoint is mid-journey. A new anonymous journey identifier is generated every time the connected vehicle is turned on.
Previous studies that looked at the percentage of the vehicles that are captured in this dataset show that the penetration rate in Texas is 4.1–5.2% and, in California, 2.6–3.2% [53]. Another study presented the volume of such CV data with more than 48 billion monthly records in Texas and 29 billion monthly records in California [66]. CV data available around the border areas for 25 days, from 1 August to 25 August 2020, are used for analysis during this study. It is important to note that the analysis period overlaps with the impact that COVID might have had on the traffic. However, the methodologies presented in this study are applicable and scalable for any datasets that provide granular trajectory-based information.
6. Methodology
Origin and destination locations are defined manually for each of the 26 border crossings for both directions of trips going to MX and to the US. If alternate roadway segments join at the same border port of entry/exit, multiple origins or destinations are defined for the same travel direction at a crossing. Origins are chosen such that delays are captured and roadway segments are extended until an intersection is encountered from a point of entry. Figure 2 shows the origin and destination location for a crossing at San Ysidro (CA-SYS) in California. The origin for trips to MX is denoted by OMX1 and the destination by DMX1. Only one pair of O-D was required for trips to MX. On the other hand, trips to the US required 3 origins (denoted by OUS1, OUS2 and OUS3) and 3 destinations (denoted by DUS1, DUS2 and DUS3) due to multiple possible points of entry and exits. Along with origins and destinations, another intermediate point was defined for each direction that is at the junction of the roadway and the US-MX border. In Figure 2, the intermediate points are denoted by the directional arrows US → MX and MX → US, respectively. A radius is also defined for each of these points that would cover the entire width of the roadway segment, shown by blue or green circles. The waypoints from CV data are detected such that they are within these radii for origin, destination, and intermediate points. All such detected waypoints for a sample day are shown in Figure 2.
For a trip with the journey id (j) detected at all three locations (i.e., origin, destination and intermediate), the travel time is given by Equation (1).
where and are the number of origin and destination locations defined for the crossing. represents travel time from origin to destination for journey id j. represents the recorded times at origin for journey id j. represents the recorded times at destination for journey id j. represents the times at the intermediate location for journey id j.
All trips with the respective travel times were identified across all locations in both directions of travel over the 25-day analysis period. Table 2 shows sample data with the respective origin–destination (OD) pair at the CA-SYS crossing with travel time and delay information as calculated in Equation (2). If the journey id associated with a vehicle trip changes midway before crossing the destination, the trip would fail to be matched at origin and destination and would therefore have to be ignored. This may occur if a vehicle waiting in a queue at the border crossing turns off the vehicle to save fuel. The occurrence of these events may lead to the underestimation of actual delay and is more likely to occur at locations with long wait times.
7. Results
Twenty-six border crossings between the US and MX were analyzed over a 25-day period from August 1 to August 25, 2020. All locations permitted travel in both directions, except for Laredo Bridge 1 (TX-LAR) and El Paso (TX-PDN) in Texas which are dedicated to trips from MX to the US only. A table similar to Table 2 shown in the methodology section, with additional attributes, was tabulated with approximately 93 thousand records.
7.1. Summary of Trips Detected
A total of 51,341 trips were detected travelling from the US to MX and 41,708 trips from MX to the US during the analysis period across all the crossings. The imbalance in trips arises from vehicles turning off and on while waiting in long queues from MX to the US. Figure 3 shows the number of trips detected for each border crossing. Crossings on the horizontal axis are arranged in geographical order from west to east along the US-MX border. The top three border crossings with most trips to MX were observed at San Ysidro (CA-SYS) with 12,773 trips, Calexico West (CA-CAL) with 5982 trips and El Paso BOTA (TX-BOA) with 5510 trips (Figure 3b). In the case of trips to the US, most trips were observed at Otay Mesa (CA-OTM) with 4978 trips, San Ysidro (CA-SYS) with 4840 trips and Calexico West (CA-CAL) with 4289 trips (Figure 3a). TX-PDN and TX-LAR are only dedicated for trips to the US; hence, 0 trips were identified for these two locations from the US to MX in Figure 3b. California clearly had more trips across land borders compared to Texas. Trips to MX at CA-SYS port were significantly greater than the trips to the US at the same location due to motorists turning off their vehicles while waiting. CA-SYS generated 83% of the entire imbalance in trips. Most trips in Texas were observed at the El Paso BOTA (TX-BOA) border crossing.
7.2. Travel Time Delay Estimation
The space mean speed for each detected trip was estimated using the travel time from Equation (1) and distance from origin to destination. The average space mean speed for trips going to MX was 11.14 mph, and for trips to the US, it was 3.9 mph. It is assumed that trips traveling below the space mean speed of 15 mph encountered a delay. The travel time delay for each of the trips was estimated using Equation (2).
where is the travel time delay in minutes for trip j, is the detected travel time in minutes for trip j from origin (O) to destination (D) and is the distance in miles between origin (O) and destination (D). The travel time delay is 0 for a trip when the detected travel time is less than the expected travel time at 15 mph.
Figure 4 shows the frequency (Figure 4a) and cumulative frequency distribution (Figure 4b) of travel time delays across all trips. Trips from the US to MX are denoted in blue and MX to the US trips in green. The average travel time delays for trips to MX was only 2.2 min compared to 34.15 min for trips to the US, denoted by the dotted line on Figure 4a. Further, 75% of the trips going to MX had delays below 2.2 min (Figure 4b). For trips to the US, 50% of trips experienced delays below 20.7 min (Figure 4b). The interquartile range (IQR) of vehicle delay from the US to MX was 2.18 min, while the IQR of delay for vehicles travelling from MX to the US was 46.1 min. Average delays experienced by trips going to the US were about 15 times higher than for trips going to MX.
7.3. Delays at Border Crossings
Time lost waiting in queues constitutes a loss of productivity for millions of passengers. Delays at border crossings were estimated using Equation (2). Almost all trips to the US (97%) experienced delays, whereas only 76% of trips going to MX experienced delays. These delays were further analyzed by location, time of the day, and day of the week to identify potential areas for improvement.
The delays were segregated into six different bins: (i) 0 min (i.e., no delay), (ii) 0–2 min, (iii) 2–5 min, (iv) 5–10 min, (v) 10–30 min and (vi) greater than 30 min. Figure 5 shows trip counts stacked by delay bins (Figure 5a), percentage of trips by delay bins (Figure 5b) and whisker plot for delays from MX to the US (Figure 5c). Overall, 41% of trips had delays of more than 30 min across all border crossings. Almost a quarter of trips (24%) incurred delays between 10 and 30 min, and 11% of trips experienced delays each between 5 and 10 min, 2 and 5 min, and 0 and 2 min. Less than 3% of trips from MX to the US had no delays at border crossings.
CA-OTM had the most trips (2783) of the total of 4978 with delays greater than 30 min. TX-BRO, at the east end of Texas, was observed to have many trips with no delays. However, TX-ELP and TX-FHK were the only two border crossing locations where more than two thirds of the trips incurred delays below 5 min. Figure 5c shows a spread of the delays at each of the border crossing locations only for trips with non-zero delays. The top of the boxplot represents the 75th percentile, the bottom represents the 25th percentile and the line in middle shows the 50th percentile delay. CA-TEC had the highest median and 75th percentile delay across all border crossing locations. CA-TEC and CA-OTM had 75th percentile delays of more than 70 min. Only TX-PDN had the highest 25th percentile delay (bottom of the boxplot) above 20 min, i.e., more than 75% trips at this location had incurred delays more than 20 min. TX-ELP had the lowest median delay. The interquartile range for delays at all crossings was greater than 10 min, except for TX-ELP, TX-FHK and TX-LAR. At the system level, these plots compare delays across various border crossings and focus improvement efforts at crossings that observe frequent or higher delays.
Figure 6 shows similar plots for trips from the US to MX. CA-SYS and TX-BOA had the most trips going from the US to MX without any delay (Figure 6a). However, these locations also had higher volumes compared to other border crossings. TX-PHR, TX-DNA, TX-IND and TX-FAB in Texas had more than two thirds of the trips cross without any delay. Overall, less than 1% of trips had delays of more than 30 min, 4% between 10 and 30 min, 6% between 5 and 10 min, 16% between 2 and 5 min and 73% up to 2 min. TX-YSL had the highest interquartile range for delay, followed by TX-PRE, TX-PHR and TX-DLR (Figure 6c). These graphics allow agencies to visualize the systemwide delays across all border crossings.
7.4. Border Crossings Rankings
Although there are many ways to rank border crossings that will vary by use case, this paper describes four ranking techniques to illustrate how performance measures extracted from the CV data can be used. These include (1) trip counts, (2) median delay (minutes), (3) delayed trip counts and (4) cumulative delay (vehicle hours).
7.4.1. Trip Counts
CV trip counts provide a measure for the passenger car traffic volume crossing at the borders. Figure 7 shows pareto-sorted total trip counts at each of the border crossings. In case of the trips crossing from MX to the US, CA-OTM had the most sampled vehicles, followed by CA-SYS (Figure 7a). Most trips were observed crossing to MX at CA-SYS (Figure 7b), with more than twice the sampled volume as that of the second highest crossing, CA-CAL. The crossing at TX-FHK observed the least passenger car volume in both directions.
7.4.2. Median Delay
The median delay is estimated as the median of all delays among the trips that had non-zero delays at a given location. Figure 8 shows the box–whisker plot of delays at border crossings pareto-sorted by median delay. Delays for trips crossing to the US (Figure 8a) were significantly higher than those for trips crossing to MX (Figure 8b). TX-ELP had the lowest median delay for trips to the US (Figure 8a). Even though volumes to MX are the highest for CA-SYS and CA-CAL (Figure 7b), median delays are one of the shortest (Figure 8b) among the 26 border crossings analyzed during this study.
7.4.3. Delayed Trip Counts
The total number of delayed trip counts provides a measure of the sampled volume of passenger cars that are experiencing delays at a particular border crossing without considering the time of delay. Table 3 shows the top five border crossings ranked by trips to the US experiencing travel time delays longer than 5 min. CA-SYS had the highest number of trips to the US (4505 out of 4840) with delays of more than 5 min. Table 4 shows the top five border crossings ranked in a similar fashion for trips to MX. Table 3 and Table 4 also show trip counts and percentages for each of the delay bins.
7.4.4. Total Cumulative Delay
According to FHWA’s Public Roads magazine, each hour of time lost in traffic values roughly at USD 17 [68]. The total cumulative delay at the border crossings is computed as the sum of all delays from all the trips. This measure shows the total amount of time spent by all the passenger cars at border crossings. Figure 9 shows the pareto-sorted ranking of border crossings by total delay experienced in vehicle-hours.
The total delays of 23,738 and 1866 vehicle-hours were incurred by CV passenger cars going to the US and to MX, respectively. Assuming an average vehicle occupancy of two, the value of time lost estimates to more than USD 1 million per day at these border crossings. CA-SYS had the most vehicle-hours of delay for trips to MX and the second most for trips to the US. The top three border crossings with the highest number of total cumulative delays for trips to the US were all in California. For trips to MX, the top border crossing by cumulative delay was in California, and the next five border crossings were all in Texas. This measure provides the breadth of delays and potential possible benefits of improving travel times at a particular location.
7.5. Delay Trends by Time of Day and Day of Week
A systemwide analysis and comparison can help agencies narrow down focus areas to allocate limited resources to potentially maximize benefits and reduce delays. Once the border crossing location of interest is identified, further delay trends by day of the week or time of the day can be assessed for tactical initiatives. Border crossing locations with the highest number of total cumulative delays for both directions of travel are further analyzed.
For passenger car trips from MX to the US, the greatest number of total delays are observed at the border crossing CA-OTM (Figure 9a). Figure 10 shows hourly trip counts and hourly box–whisker plots of delays for each day of the week at this border crossing. The horizontal axis shows the hour of the day. The analysis period of 25 days in August 2020 consisted of three Thursdays, Fridays and Saturdays and four days for the rest of the week. Figure 10a shows the hourly volume and hourly delay combined for all 25 days. The traffic volume was higher on weekends (Figure 10g,h) compared to weekdays (Figure 10b–f), which may indicate a significant number of leisure trips. Traffic delays significantly increased from 10 PM to 4 AM during most days of the week (Figure 10a). The issue was aggravated on Saturdays (Figure 10g, callout i). The top end of the box–whisker plot for delays (i.e., the 75th percentile) was greater than 4 h and the median delay more than 150 min during the two-hour period from 10 PM to midnight (callout i) on Saturdays. This change might be caused by a reduction in the number of open gates or staff assignments at the gates, since the trip count remains low in relation to peak AM and PM periods. The median delays on Sunday (Figure 10h) were more than 50 min for every hour between 7 AM and 9 PM. A two-hour window from 7 AM to 9 AM on Friday (Figure 10f, callout ii) had the least delay over the entire week.
For passenger car trips from the US to MX, the border crossing at CA-SYS had the highest total delay (Figure 9b). Figure 11 shows hourly trip counts and box–whisker plots of delays for each day of the week at this border crossing. Saturday (Figure 11g) had the most traffic compared to any other day of the week, and Sunday (Figure 11h) had the least traffic. On most days, the morning peak of crossing traffic was observed around 9 AM and the evening peak around 4 PM. Friday afternoon hours from 3 PM to 7 PM (Figure 11f, callout iii) stood out as a time period with multiple hours where delays were consistently higher compared to other hours or days. On most weekdays, the early morning hours did not have a high sample volume of traffic crossing the border. The interquartile range of delay was observed to be the highest from 6 AM to 10 AM on Saturday (Figure 11g, callout ii).
Some improvement strategies might be to have more lanes open during high volume hours, adopt different shift plans on different days of the week to reduce delays, and improve overall system productivity with the same number of resources and implementing new technologies.
8. Conclusions
This paper focuses on techniques to collect travel time delays at border crossings to inform stakeholders and decision makers. Specifically, scalable methodologies for a systemwide assessment of travel time delays at land border crossings using passenger car CV data were presented in this study. Twenty-six border crossing locations between the US and Mexico were analyzed over a 25-day period in August 2020. Performance measures such as trip counts, median delay, delayed trips and total delay were compared across locations. The median and IQR delay for vehicles travelling from the US to Mexico was 1 and 2 min, respectively. In contrast, the median and IQR delay for vehicles travelling from Mexico to the US was 21 and 46 min. Hourly trends by day of the week revealed windows of opportunities for implementing improvement strategies and for reducing travel delays across borders. The graphics presented during this study can inform agencies of critical areas with high delays that could aid in focusing improvement efforts to yield maximum benefits. These can also provide regular feedback on delay metrics across all land borders for monitoring and/or before and after analysis. The study focuses on travel time delays for passenger cars at borders but can also be applied to trucks. Agencies and researchers worldwide can use granular trajectory-based data like CV data to monitor and analyze travel times and delays across borders or between any two locations of interest.
Some delay at border crossings is necessary to ensure appropriate checks and balances are provided to ensure mutual compliance with the agricultural, business, and government policies of both countries. This paper does not make any recommendations on what an appropriate delay is.
A limitation of this study is the varying penetration of CV data. With newer vehicles coming on roads, the penetration of CV data is expected to increase, providing a higher sample to be evaluated. It is important to note that the key on/off events might skew the sample size as they create new journey identifiers for the same vehicle. However, the authors believe that the occurrence of these events is sufficiently random to still be effective for characterizing delay.
Author Contributions
Conceptualization: D.M.B. and R.S.S.; methodology: R.S.S.; formal analysis: R.S.S.; data curation: R.S.S.; writing—original draft: R.S.S. and J.D.; writing—review and editing: D.M.B., E.D.S.-C., J.D. and R.S.S.; visualization: R.S.S.; supervision: D.M.B. All authors have read and agreed to the published version of the manuscript.
Funding
This research received no external funding.
Institutional Review Board Statement
Not applicable.
Informed Consent Statement
Not applicable.
Data Availability Statement
Data are contained within the article.
Acknowledgments
The connected vehicle data in August 2020 used in this study were provided by Wejo Data Services, Inc. The contents of this paper reflect the views of the authors, who are responsible for the facts and the accuracy of the data presented herein and do not necessarily reflect the official views or policies of the sponsoring organizations. These contents do not constitute a standard, specification, or regulation.
Conflicts of Interest
The authors declare no conflicts of interest.
References
- Secretaría de Relaciones Exteriores. National Trade 2022. Available online: https://embamex.sre.gob.mx/eua/index.php/en/economic-affairs-2022/1914-trade-by-state-2022 (accessed on 29 August 2023).
- U.S. Census Bureau. Trade in Goods with Mexico. Available online: https://www.census.gov/foreign-trade/balance/c2010.html (accessed on 29 August 2023).
- U.S. Census Bureau. Top Trading Partners-June 2023. Available online: https://www.census.gov/foreign-trade/statistics/highlights/topcm.html (accessed on 29 August 2023).
- Blecker, R.A. The Mexican and U.S. Economies After Twenty Years of NAFTA. Int. J. Polit. Econ. 2015, 43, 5–26. [Google Scholar] [CrossRef]
- Office of the United States Trade Representative. Agreement between the United States of America, the United Mexican States, and Canada 7/1/20 Text. Available online: https://ustr.gov/trade-agreements/free-trade-agreements/united-states-mexico-canada-agreement/agreement-between (accessed on 17 November 2023).
- Bureau of Transportation Statistics. Border Crossing/Entry Data. Available online: https://www.bts.gov/browse-statistical-products-and-data/border-crossing-data/border-crossingentry-data (accessed on 29 August 2023).
- Polus, A. A study of travel time and reliability on arterial routes. Transportation 1979, 8, 141–151. [Google Scholar] [CrossRef]
- Lomax, T.; Turner, S.; Margiotta, R. Monitoring Urban Roadways in 2000: Using Archived Operations Data for Reliability and Mobility Measurement. FHWA-OP-02-029. 2001. Available online: https://rosap.ntl.bts.gov/view/dot/41412 (accessed on 16 November 2023).
- Haseman, R.J.; Wasson, J.S.; Bullock, D.M. Real-Time Measurement of Travel Time Delay in Work Zones and Evaluation Metrics Using Bluetooth Probe Tracking. Transp. Res. Rec. 2010, 2169, 40–53. [Google Scholar] [CrossRef]
- Miltiadou, M.; Bouhouras, E.; Basbas, S.; Mintsis, G.; Taxiltaris, C. Analysis of border crossings in South East Europe and measures for their improvement. Transp. Res. Procedia 2017, 25, 603–615. [Google Scholar] [CrossRef]
- Paselk, T.A.; Mannering, F.L. Use of duration models for predicting vehicular delay at a US/Canadian border crossing. Transportation 1994, 21, 249–270. [Google Scholar] [CrossRef]
- Turner, S.M.; Eisele, W.L.; Benz, R.J.; Holdener, D.J. Travel Time Data Collection Handbook; No. FHWA-PL-98-035; USDOT’s National Transportation Library: Washington, DC, USA, 1998. [CrossRef]
- Kazagli, E.; Koutsopoulos, H.N. Estimation of Arterial Travel Time from Automatic Number Plate Recognition Data. Transp. Res. Rec. 2013, 2391, 22–31. [Google Scholar] [CrossRef]
- Clark, S.D.; Grant-Muller, S.; Chen, H. Cleaning of Matched License Plate Data. Transp. Res. Rec. J. Transp. Res. Board 2002, 1804, 1–7. [Google Scholar] [CrossRef]
- Takaba, S.; Morita, T.; Hada, T.; Usami, T.; Yamaguchi, M. Estimation and measurement of travel time by vehicle detectors and license plate readers. In Proceedings of the Vehicle Navigation and Information Systems Conference, Troy, MI, USA, 20–23 October 1991; pp. 257–267. [Google Scholar] [CrossRef]
- Li, Z.; Li, N.; Liu, F.; Liu, Y. Short-term forecasting of travel time based on license plate matching data. In Proceedings of the 2008 IEEE International Conference on Automation and Logistics, Qingdao, China, 1–3 September 2008; pp. 1390–1395. [Google Scholar] [CrossRef]
- Jenelius, E.; Koutsopoulos, H.N. Travel time estimation for urban road networks using low frequency probe vehicle data. Transp. Res. Part B Methodol. 2013, 53, 64–81. [Google Scholar] [CrossRef]
- Li, Y.; McDonald, M. Link travel time estimation using single GPS equipped probe vehicle. In Proceedings of the IEEE 5th International Conference on Intelligent Transportation Systems, Singapore, 3–6 September 2002; pp. 932–937. [Google Scholar] [CrossRef]
- Hellinga, B.; Fu, L. Assessing Expected Accuracy of Probe Vehicle Travel Time Reports. J. Transp. Eng. 1999, 125, 524–530. [Google Scholar] [CrossRef]
- Srinivasan, K.K.; Jovanis, P.P. Determination of Number of Probe Vehicles Required for Reliable Travel Time Measurement in Urban Network. Transp. Res. Rec. J. Transp. Res. Board 1996, 1537, 15–22. [Google Scholar] [CrossRef]
- Alonso, B.; Musolino, G.; Rindone, C.; Vitetta, A. Estimation of a Fundamental Diagram with Heterogeneous Data Sources: Experimentation in the City of Santander. ISPRS Int. J. Geo-Inf. 2023, 12, 418. [Google Scholar] [CrossRef]
- McCormack, E.; Hallenbeck, M.E. ITS Devices Used to Collect Truck Data for Performance Benchmarks. Transp. Res. Rec. J. Transp. Res. Board 2006, 1957, 43–50. [Google Scholar] [CrossRef]
- Turner, S.M. Advanced Techniques for Travel Time Data Collection. Transp. Res. Rec. 1996, 1551, 51–58. [Google Scholar] [CrossRef]
- Bailey, M.D. A Computerized Travel Time Study for Northeastern Illinois: Methodology and Commentary; Chicago Area Transportation Study: Chicago, IL, USA, 1991; Volume 91.
- Sakhare, R.S.; Vanajakshi, L. Reliable corridor level travel time estimation using probe vehicle data. Transp. Lett. 2020, 12, 570–579. [Google Scholar] [CrossRef]
- Araghi, B.N.; Christensen, L.T.; Krishnan, R.; Lahrmann, H. Application of Bluetooth Technology for Mode- Specific Travel Time Estimation on Arterial Roads: Potentials and Challenges. Proc. Annu. Transp. Conf. Aalb. Univ. 2012, 19. [Google Scholar] [CrossRef]
- Erdelić, T.; Carić, T.; Erdelić, M.; Tišljarić, L.; Turković, A.; Jelušić, N. Estimating congestion zones and travel time indexes based on the floating car data. Comput. Environ. Urban Syst. 2021, 87, 101604. [Google Scholar] [CrossRef]
- Yang, Z.; Gong, B.; Lin, C. Travel Time Estimate Based on Floating Car. In Proceedings of the 2009 Second International Conference on Intelligent Computation Technology and Automation, Changsha, China, 10–11 October 2009; pp. 868–871. [Google Scholar] [CrossRef]
- Wang, Z. Using Floating Cars to Measure Travel Time Delay: How Accurate Is the Method? Transp. Res. Rec. J. Transp. Res. Board 2004, 1870, 84–93. [Google Scholar] [CrossRef]
- Croce, A.I.; Musolino, G.; Rindone, C.; Vitetta, A. Estimation of Travel Demand Models with Limited Information: Floating Car Data for Parameters’ Calibration. Sustainability 2021, 13, 8838. [Google Scholar] [CrossRef]
- Zhang, C.; Chen, B.Y.; Lam, W.H.K.; Ho, H.W.; Shi, X.; Yang, X.; Ma, W.; Wong, S.C.; Chow, A.H.F. Vehicle Re-identification for Lane-level Travel Time Estimations on Congested Urban Road Networks Using Video Images. IEEE Trans. Intell. Transp. Syst. 2022, 23, 12877–12893. [Google Scholar] [CrossRef]
- Jie, L.; Van Zuylen, H.; Chunhua, L.; Shoufeng, L. Monitoring travel times in an urban network using video, GPS and Bluetooth. Procedia-Soc. Behav. Sci. 2011, 20, 630–637. [Google Scholar] [CrossRef]
- Ma, D.; Luo, X.; Jin, S.; Guo, W.; Wang, D. Estimating Maximum Queue Length for Traffic Lane Groups Using Travel Times from Video-Imaging Data. IEEE Intell. Transp. Syst. Mag. 2018, 10, 123–134. [Google Scholar] [CrossRef]
- Wiehe, S.E.; Carroll, A.E.; Liu, G.C.; Haberkorn, K.L.; Hoch, S.C.; Wilson, J.S.; Fortenberry, J.D. Using GPS-enabled cell phones to track the travel patterns of adolescents. Int. J. Health Geogr 2008, 7, 22. [Google Scholar] [CrossRef]
- Chitraranjan, C.D.; Perera, A.S.; Denton, A.M. Tracking vehicle trajectories by local dynamic time warping of mobile phone signal strengths and its potential in travel-time estimation. In Proceedings of the 2015 IEEE International Conference on Pervasive Computing and Communication Workshops (PerCom Workshops), St. Louis, MO, USA, 23–27 March 2015; pp. 445–450. [Google Scholar] [CrossRef]
- Calabrese, F.; Colonna, M.; Lovisolo, P.; Parata, D.; Ratti, C. Real-Time Urban Monitoring Using Cell Phones: A Case Study in Rome. IEEE Trans. Intell. Transp. Syst. 2011, 12, 141–151. [Google Scholar] [CrossRef]
- Sabean, J.; Jones, C. Inventory of Current Programs for Measuring Wait Times at Land Border Crossings. Customs and Border Protection, Department of Homeland Security and Canada Border Services Agency, May 2008. Available online: https://citeseerx.ist.psu.edu/document?repid=rep1&type=pdf&doi=a7d39309dbeb991b0c97263e6ff22d4e295cda70 (accessed on 15 December 2023).
- Fitzmaurice, M.; Hartmann, O. Border Crossing Monitoring along the Northern Corridor. Sub-Saharan Africa Transport Policy Program (SSATP) Working Paper. 2013. Available online: http://hdl.handle.net/10986/16555 (accessed on 15 December 2023).
- Sharma, S.; Kang, D.H.; de Oca, J.R.M.; Mudgal, A. Machine learning methods for commercial vehicle wait time prediction at a border crossing. Res. Transp. Econ. 2021, 89, 101034. [Google Scholar] [CrossRef]
- Quintana, P.J.E.; Ganster, P.; Granados, P.E.S.; Muñoz-Meléndez, G.; Quintero-Núñez, M.; Rodríguez-Ventura, J.G. Risky Borders: Traffic Pollution and Health Effects at US–Mexican Ports of Entry. J. Borderl. Stud. 2015, 30, 287–307. [Google Scholar] [CrossRef]
- Lin, F.B.; Lin, M.W. Modeling Traffic Delays at Northern New York Border Crossings. J. Transp. Eng. 2001, 127, 540–545. [Google Scholar] [CrossRef]
- Kim, S.; Coifman, B. Comparing INRIX speed data against concurrent loop detector stations over several months. Transp. Res. Part C Emerg. Technol. 2014, 49, 59–72. [Google Scholar] [CrossRef]
- Sakhare, R.S. Integrating Connected Vehicle Data for Operational Decision Making. Ph.D. Thesis, Purdue University Graduate School, West Lafayette, IN, USA, 2023. [Google Scholar] [CrossRef]
- Sakhare, R.S.; Desai, J.; Li, H.; Kachler, M.A.; Bullock, D.M. Methodology for Monitoring Work Zones Traffic Operations Using Connected Vehicle Data. Safety 2022, 8, 41. [Google Scholar] [CrossRef]
- Nafakh, A.; Davila, F.; Zhang, Y.; Fricker, J.; Abraham, D. Safety and Mobility Analysis of Rolling Slowdown for Work Zones: Comparison with Full Closure. JTRP Tech. Rep. 2022. [Google Scholar] [CrossRef]
- Sakhare, R.S.; Desai, J.C.; Mahlberg, J.; Mathew, J.K.; Kim, W.; Li, H.; McGregor, J.D.; Bullock, D.M. Evaluation of the Impact of Queue Trucks with Navigation Alerts Using Connected Vehicle Data. J. Transp. Technol. 2021, 11, 561–576. [Google Scholar] [CrossRef]
- Saldivar-Carranza, E.D.; Li, H.; Mathew, J.K.; Desai, J.; Platte, T.; Gayen, S.; Sturdevant, J.; Taylor, M.; Fisher, C.; Bullock, D.M. Next Generation Traffic Signal Performance Measures: Leveraging Connected Vehicle Data; Purdue University Press: West Lafayette, IN, USA, 2023. [Google Scholar] [CrossRef]
- Sakhare, R.S.; Zhang, Y.; Li, H.; Bullock, D.M. Impact of Rain Intensity on Interstate Traffic Speeds Using Connected Vehicle Data. Vehicles 2023, 5, 133–155. [Google Scholar] [CrossRef]
- Ahmad, S.; Ali, A.; Ahmed, H.U.; Huang, Y.; Lu, P. Evaluating Traffic Operation Conditions during Wildfire Evacuation Using Connected Vehicles Data. Fire 2023, 6, 184. [Google Scholar] [CrossRef]
- Claros, B.; Vorhes, G.; Chitturi, M.; Bill, A.; Noyce, D.A. Filling Traffic Count Gaps with Connected Vehicle Data. In Proceedings of the International Conference on Transportation and Development 2022, Seattle, WA, USA, 31 May–3 June 2022; pp. 192–199. [Google Scholar] [CrossRef]
- Ma, Z.; Alimardani, F.; Lin, B.; Hoque, M.; Zhao, X. Applications of Connected Vehicle Trajectory Data in Transportation Operation Management: A Case Study in the State of Delaware. In Proceedings of the Transportation Research Board 102nd Annual Meeting Transportation Research Board, Washington, DC, USA, 8–12 January 2023; Available online: https://trid.trb.org/view/2107860 (accessed on 6 October 2023).
- Abdelraouf, A.; Abdel-Aty, M.; Mahmoud, N. Sequence-to-Sequence Recurrent Graph Convolutional Networks for Traffic Estimation and Prediction Using Connected Probe Vehicle Data. IEEE Trans. Intell. Transp. Syst. 2023, 24, 1395–1405. [Google Scholar] [CrossRef]
- Sakhare, R.S.; Hunter, M.; Mukai, J.; Li, H.; Bullock, D.M. Truck and Passenger Car Connected Vehicle Penetration on Indiana Roadways. J. Transp. Technol. 2022, 12, 578–599. [Google Scholar] [CrossRef]
- Kandiboina, R.; Knickerbocker, S.; Bhagat, S.; Hawkins, N.; Sharma, A. Exploring the Efficacy of Large-Scale Connected Vehicle Data in Real-Time Traffic Applications. Transp. Res. Rec. 2023, 03611981231191512. [Google Scholar] [CrossRef]
- Dimitrijevic, B.; Zhong, Z.; Zhao, L.; Besenski, D.; Lee, J. Assessing Connected Vehicle Data Coverage on New Jersey Roadways. In Proceedings of the 2022 IEEE 7th International Conference on Intelligent Transportation Engineering (ICITE), Beijing, China, 11–13 November 2022; pp. 388–393. [Google Scholar] [CrossRef]
- Hunter, M.; Mathew, J.K.; Li, H.; Bullock, D.M. Estimation of Connected Vehicle Penetration on US Roads in Indiana, Ohio, and Pennsylvania. J. Transp. Technol. 2021, 11, 597–610. [Google Scholar] [CrossRef]
- Li, X.; Jalilifar, E.; Martin, M.; Dadashova, B.; Salgado, D.; Samant, S. Exploring Crowdsourced Big Data to Estimate Border Crossing Times; 185921-00011; Center for International Intelligent Transportation Research: El Paso, TX, USA; Available online: https://static.tti.tamu.edu/tti.tamu.edu/documents/185921-00011.pdf (accessed on 16 November 2023).
- Jalilifar, E.; Li, X.; Martin, M.; Huang, X. Toward a crowdsourcing solution to estimate border crossing times using market-available connected vehicle data. In Proceedings of the 1st ACM SIGSPATIAL International Workshop on Spatial Big Data and AI for Industrial Applications, Seattle, WA, USA, 1 November 2022; GeoIndustry ’22. Association for Computing Machinery: New York, NY, USA, 2022; pp. 1–4. [Google Scholar] [CrossRef]
- The United States-Mexico Border Region at a Glance. United States-Mexico Border Health Commission. Available online: https://web.archive.org/web/20120915105245/http://www.nmsu.edu/~bec/BEC/Readings/10.USMBHC-TheBorderAtAGlance.pdf (accessed on 14 November 2023).
- Post Codes; Nationality Codes; and Port-of-Entry Codes. Available online: https://fam.state.gov/fam/09FAM/09FAM010205.html (accessed on 14 November 2023).
- Paso Del Norte Bridge. Available online: https://web.archive.org/web/20100528031049/http://www.txdot.gov/project_information/projects/border_crossing/delnorte.htm (accessed on 14 November 2023).
- Gateway to the Americas Bridge Hours Modified. Available online: https://www.cbp.gov/newsroom/local-media-release/gateway-americas-bridge-hours-modified (accessed on 14 November 2023).
- Leaflet. Available online: https://leafletjs.com/ (accessed on 13 December 2023).
- OpenStreetMap. Available online: https://www.openstreetmap.org/copyright (accessed on 13 December 2023).
- CARTO Attribution. Available online: https://carto.com/attribution/ (accessed on 13 December 2023).
- Mathew, J.K.; Desai, J.C.; Sakhare, R.S.; Kim, W.; Li, H.; Bullock, D.M. Big Data Applications for Managing Roadways. Inst. Transp. Eng. ITE J. 2021, 91, 28–35. [Google Scholar]
- World Imagery. Available online: https://www.arcgis.com/home/item.html?id=10df2279f9684e4a9f6a7f08febac2a9 (accessed on 13 December 2023).
- McElroy, R.; Taylor, R. The Congestion Problem. FHWA-HRT-07-005. Available online: https://highways.dot.gov/public-roads/julaug-2007/congestion-problem (accessed on 7 November 2023).
Figure 2.
Illustration of origins, destinations and intermediate locations at CA-SYS with identified trip waypoints between US and MX (map source: Leaflet [63] and Esri [67]).
Illustration of origins, destinations and intermediate locations at CA-SYS with identified trip waypoints between US and MX (map source: Leaflet [63] and Esri [67]).
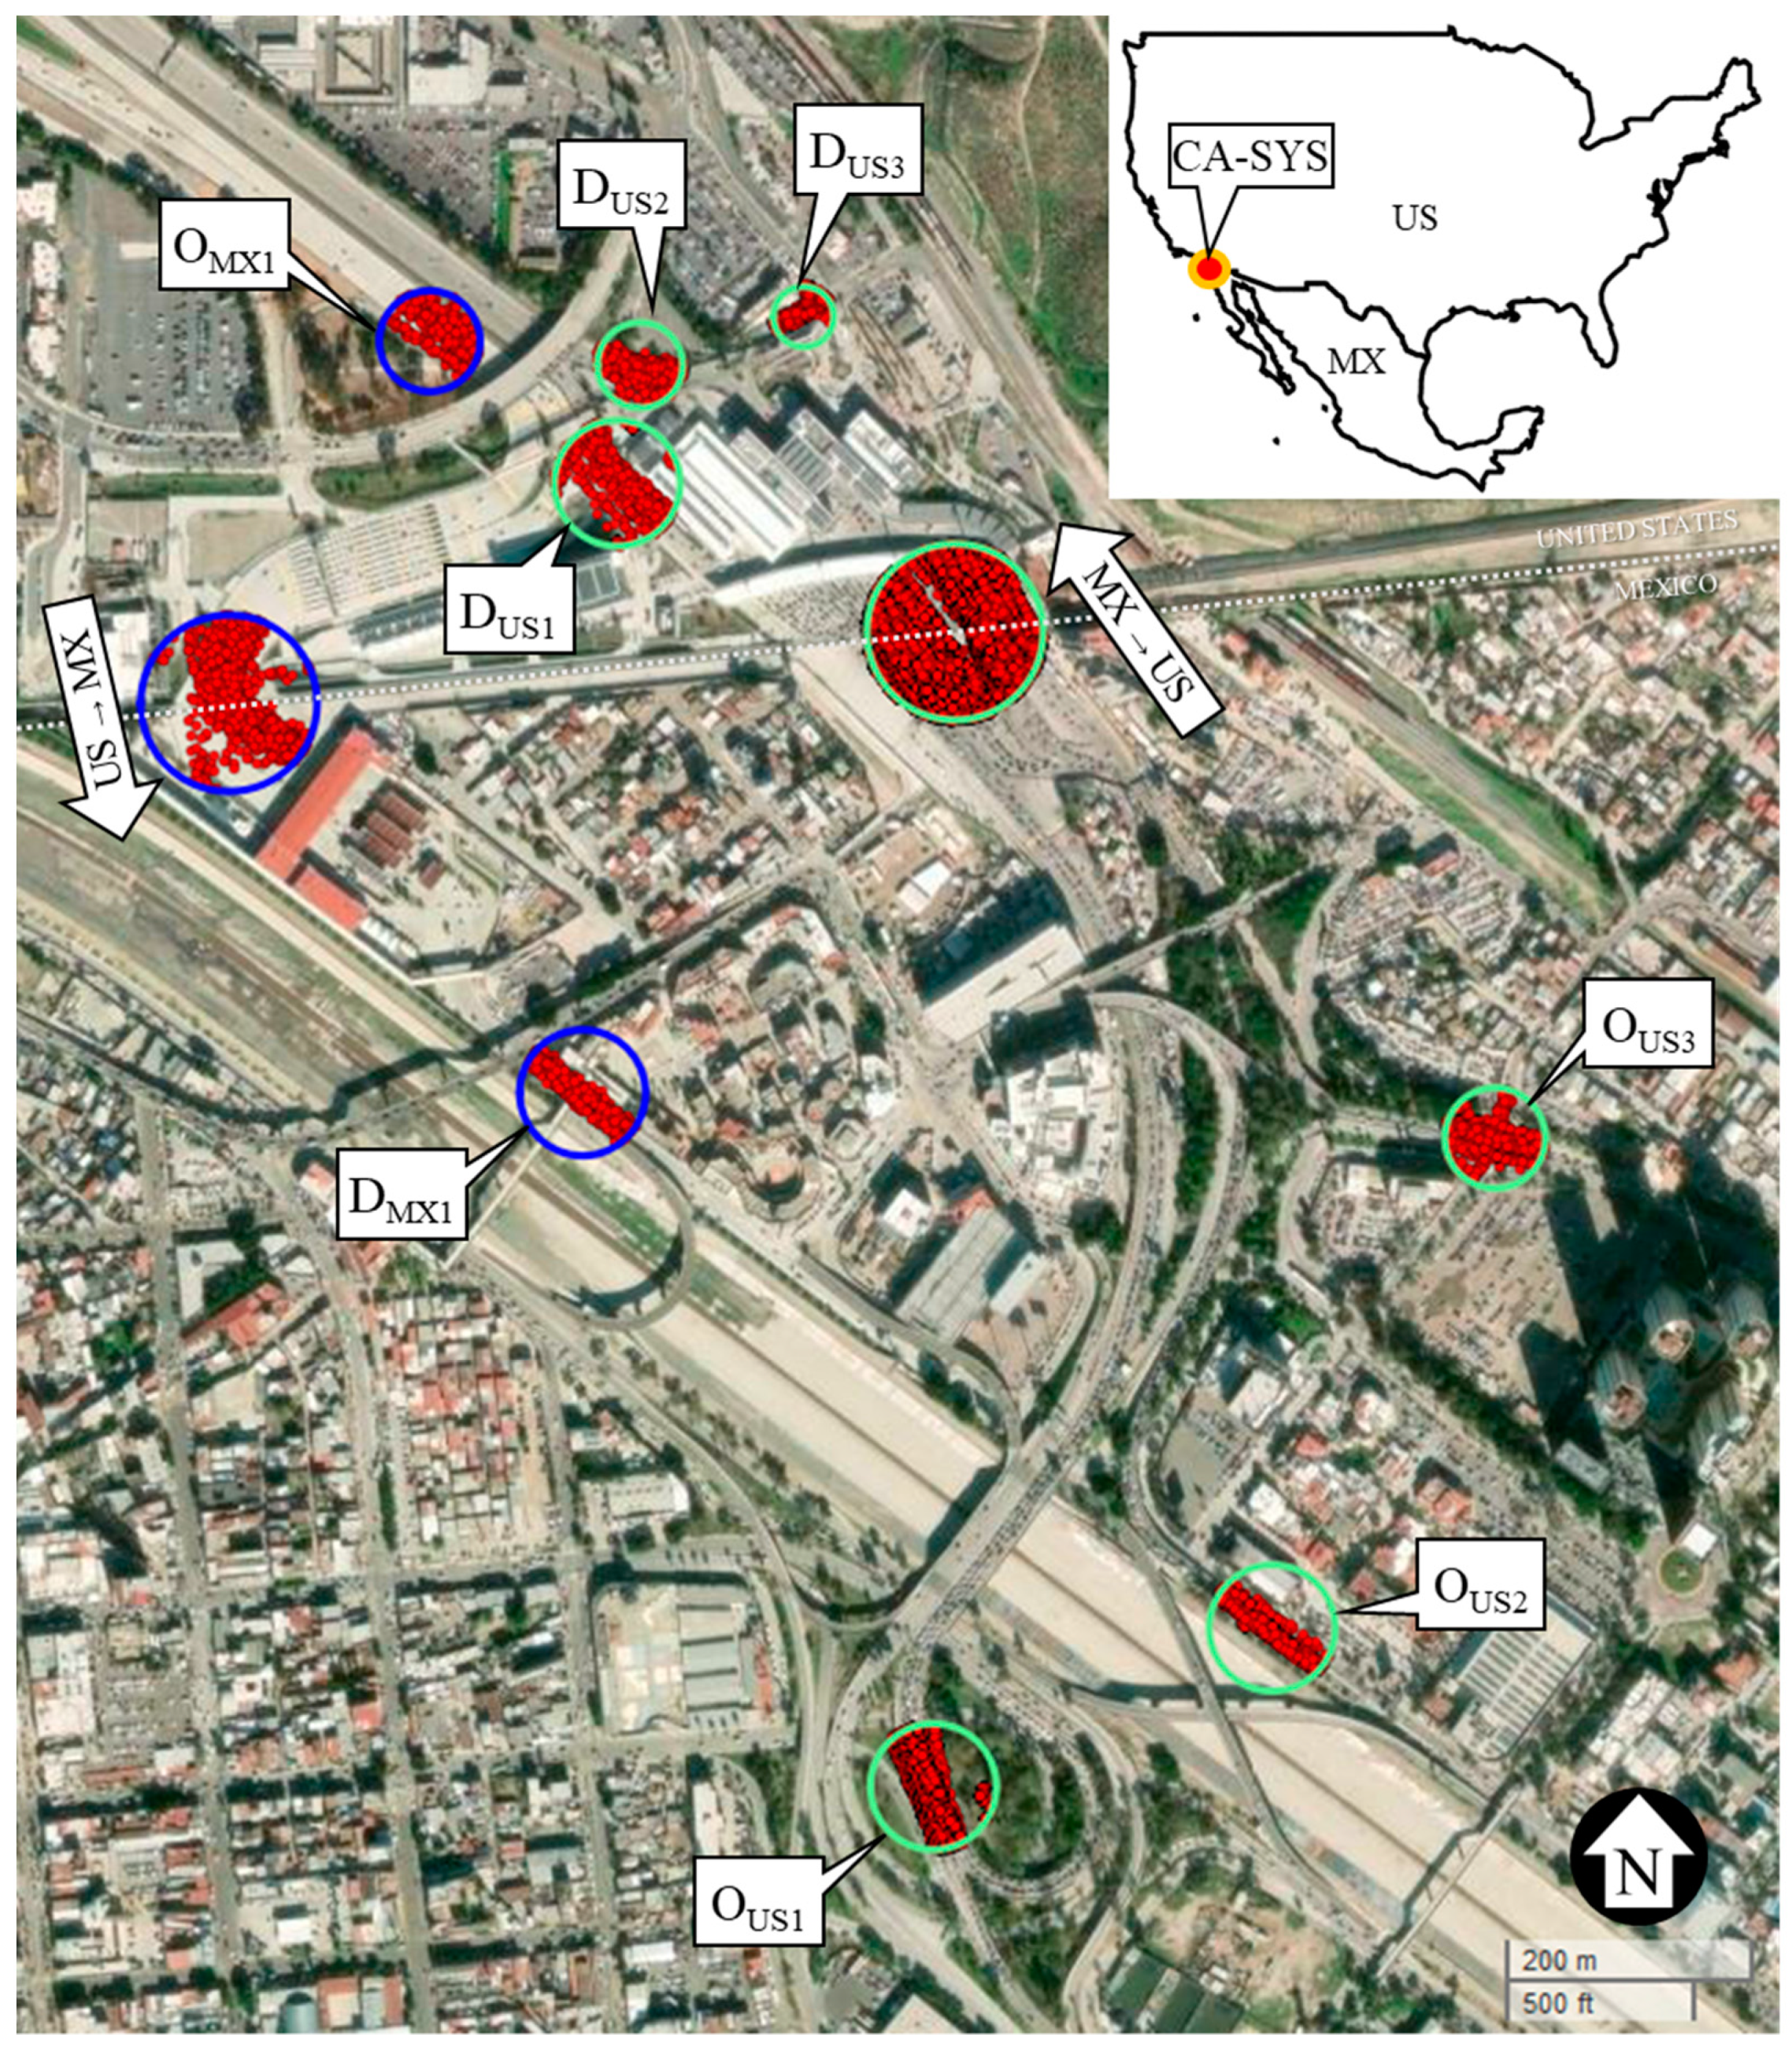
Figure 3.
Trips detected at each of the land border crossings.
Figure 3.
Trips detected at each of the land border crossings.
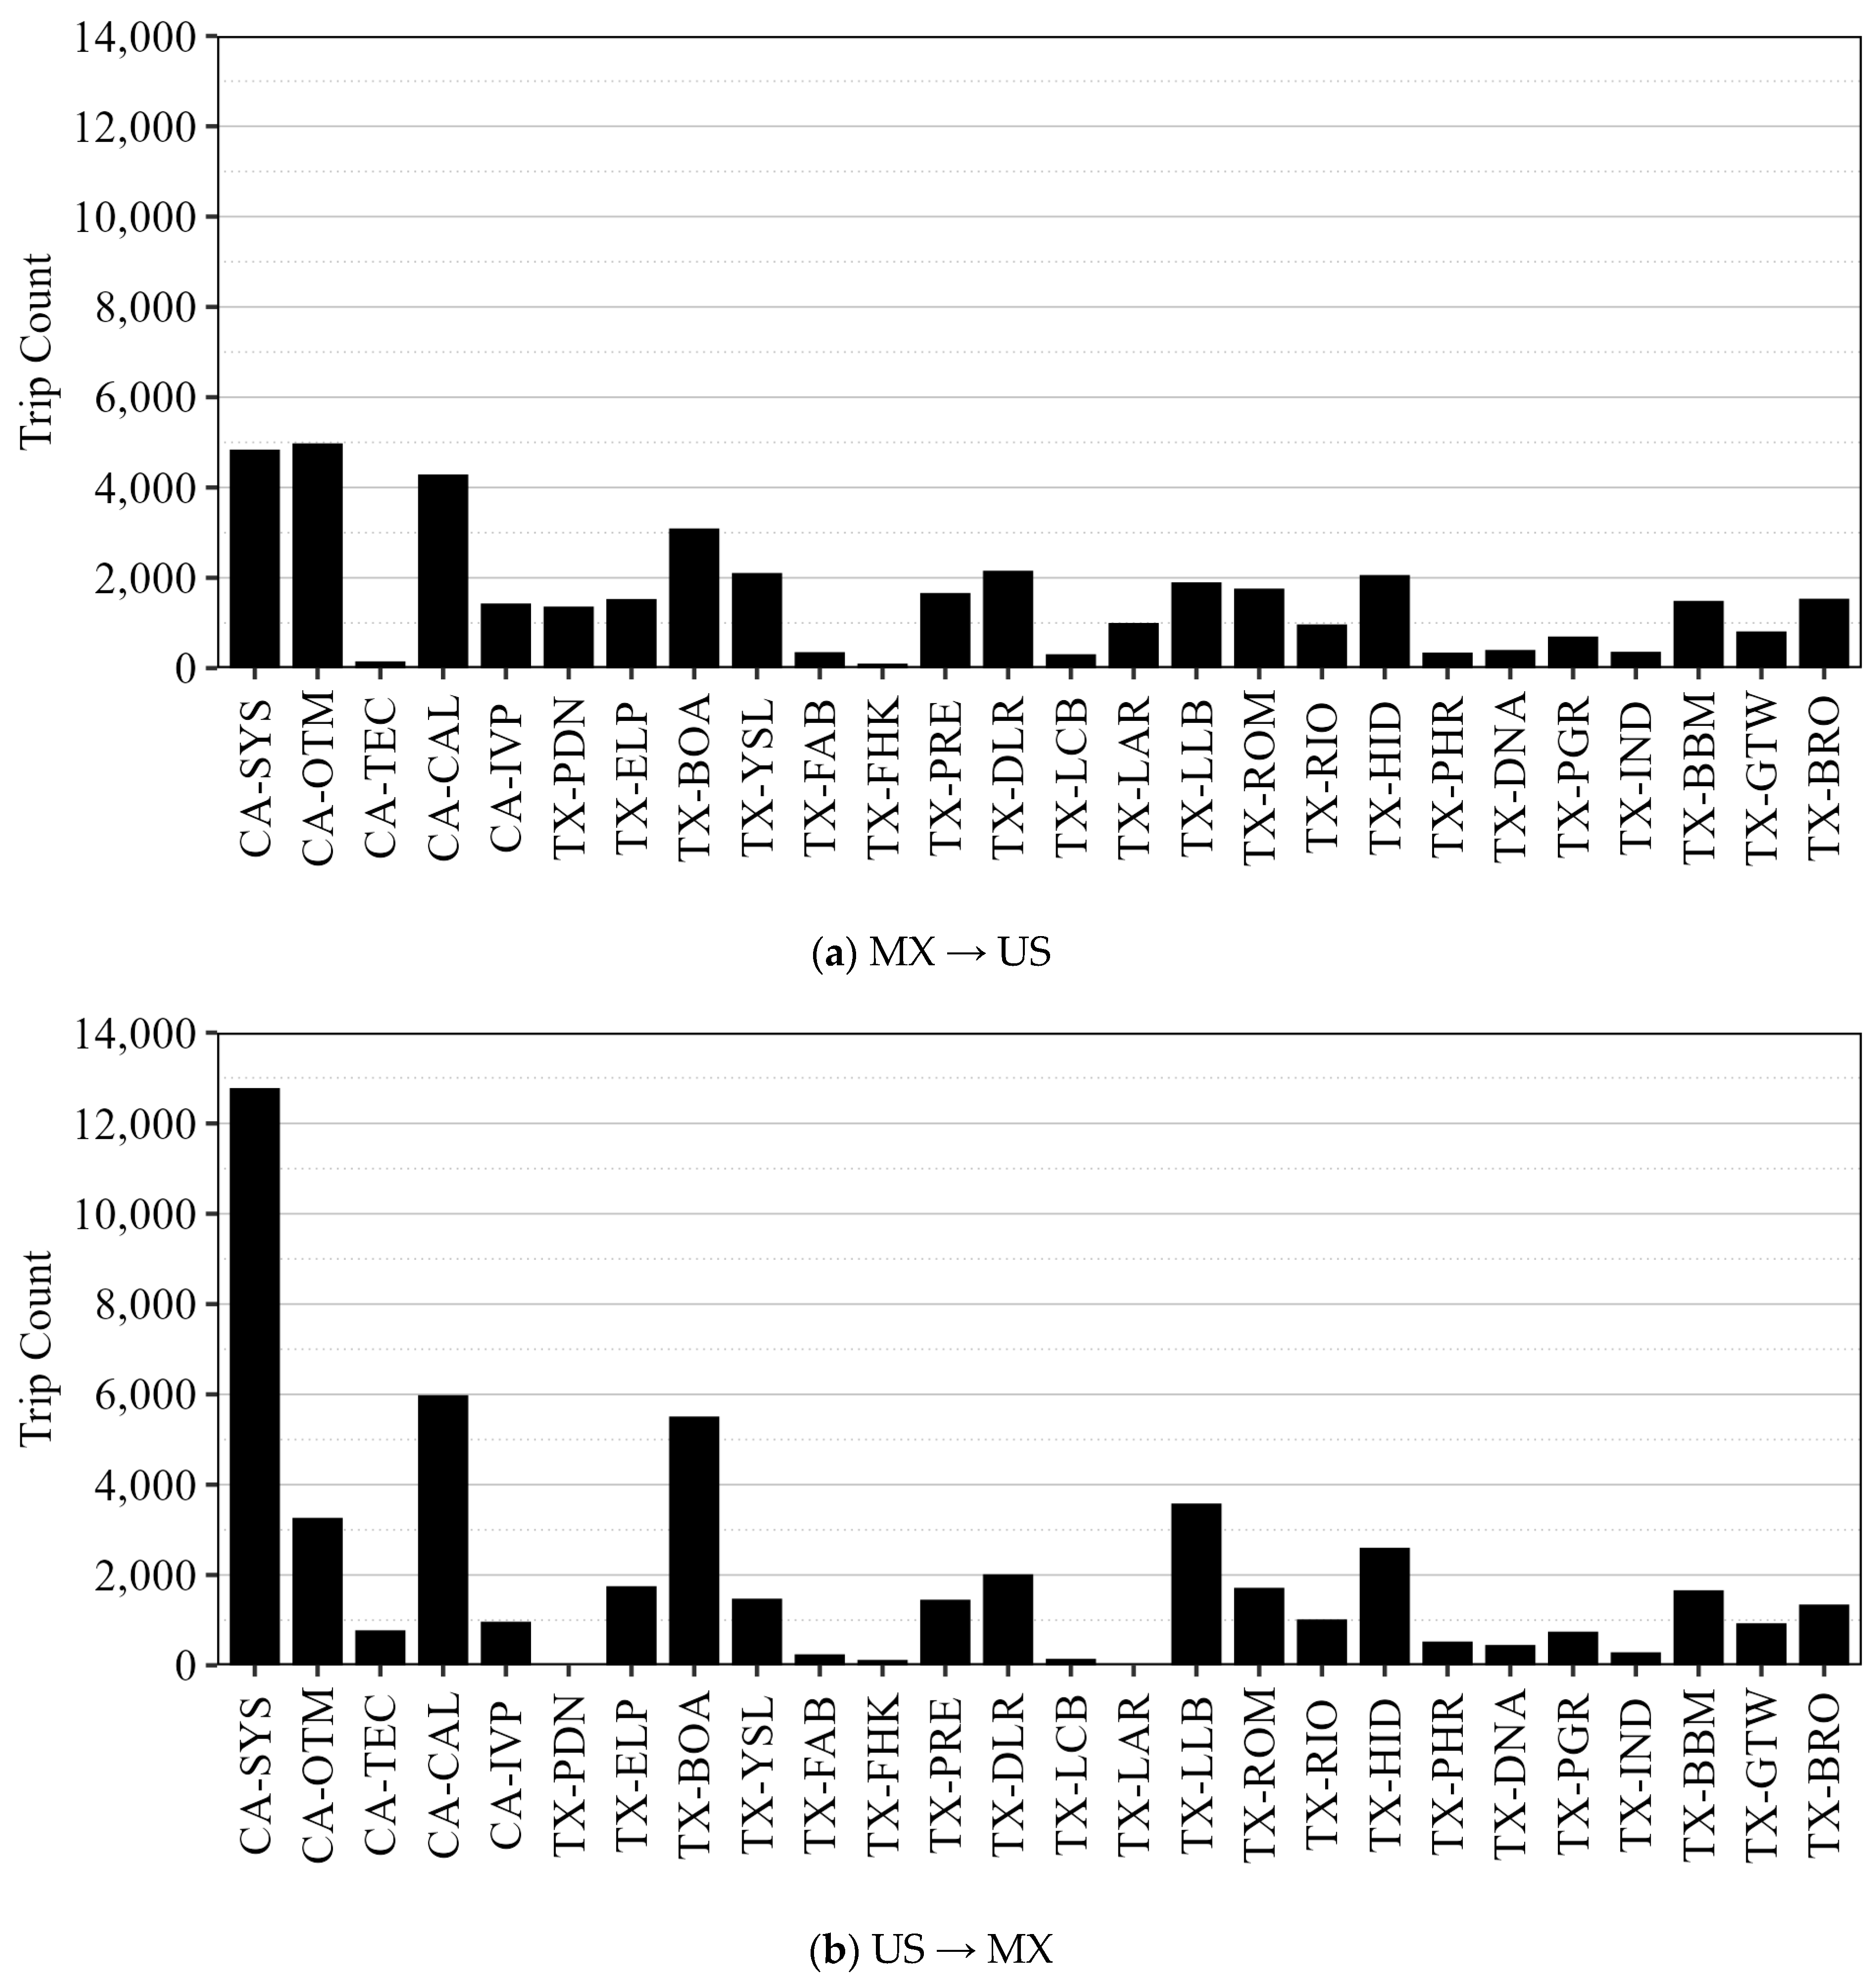
Figure 4.
Travel time delay distribution across all crossings (Blue denotes trips from the US to MX and green denotes trips from MX to the US).
Figure 4.
Travel time delay distribution across all crossings (Blue denotes trips from the US to MX and green denotes trips from MX to the US).
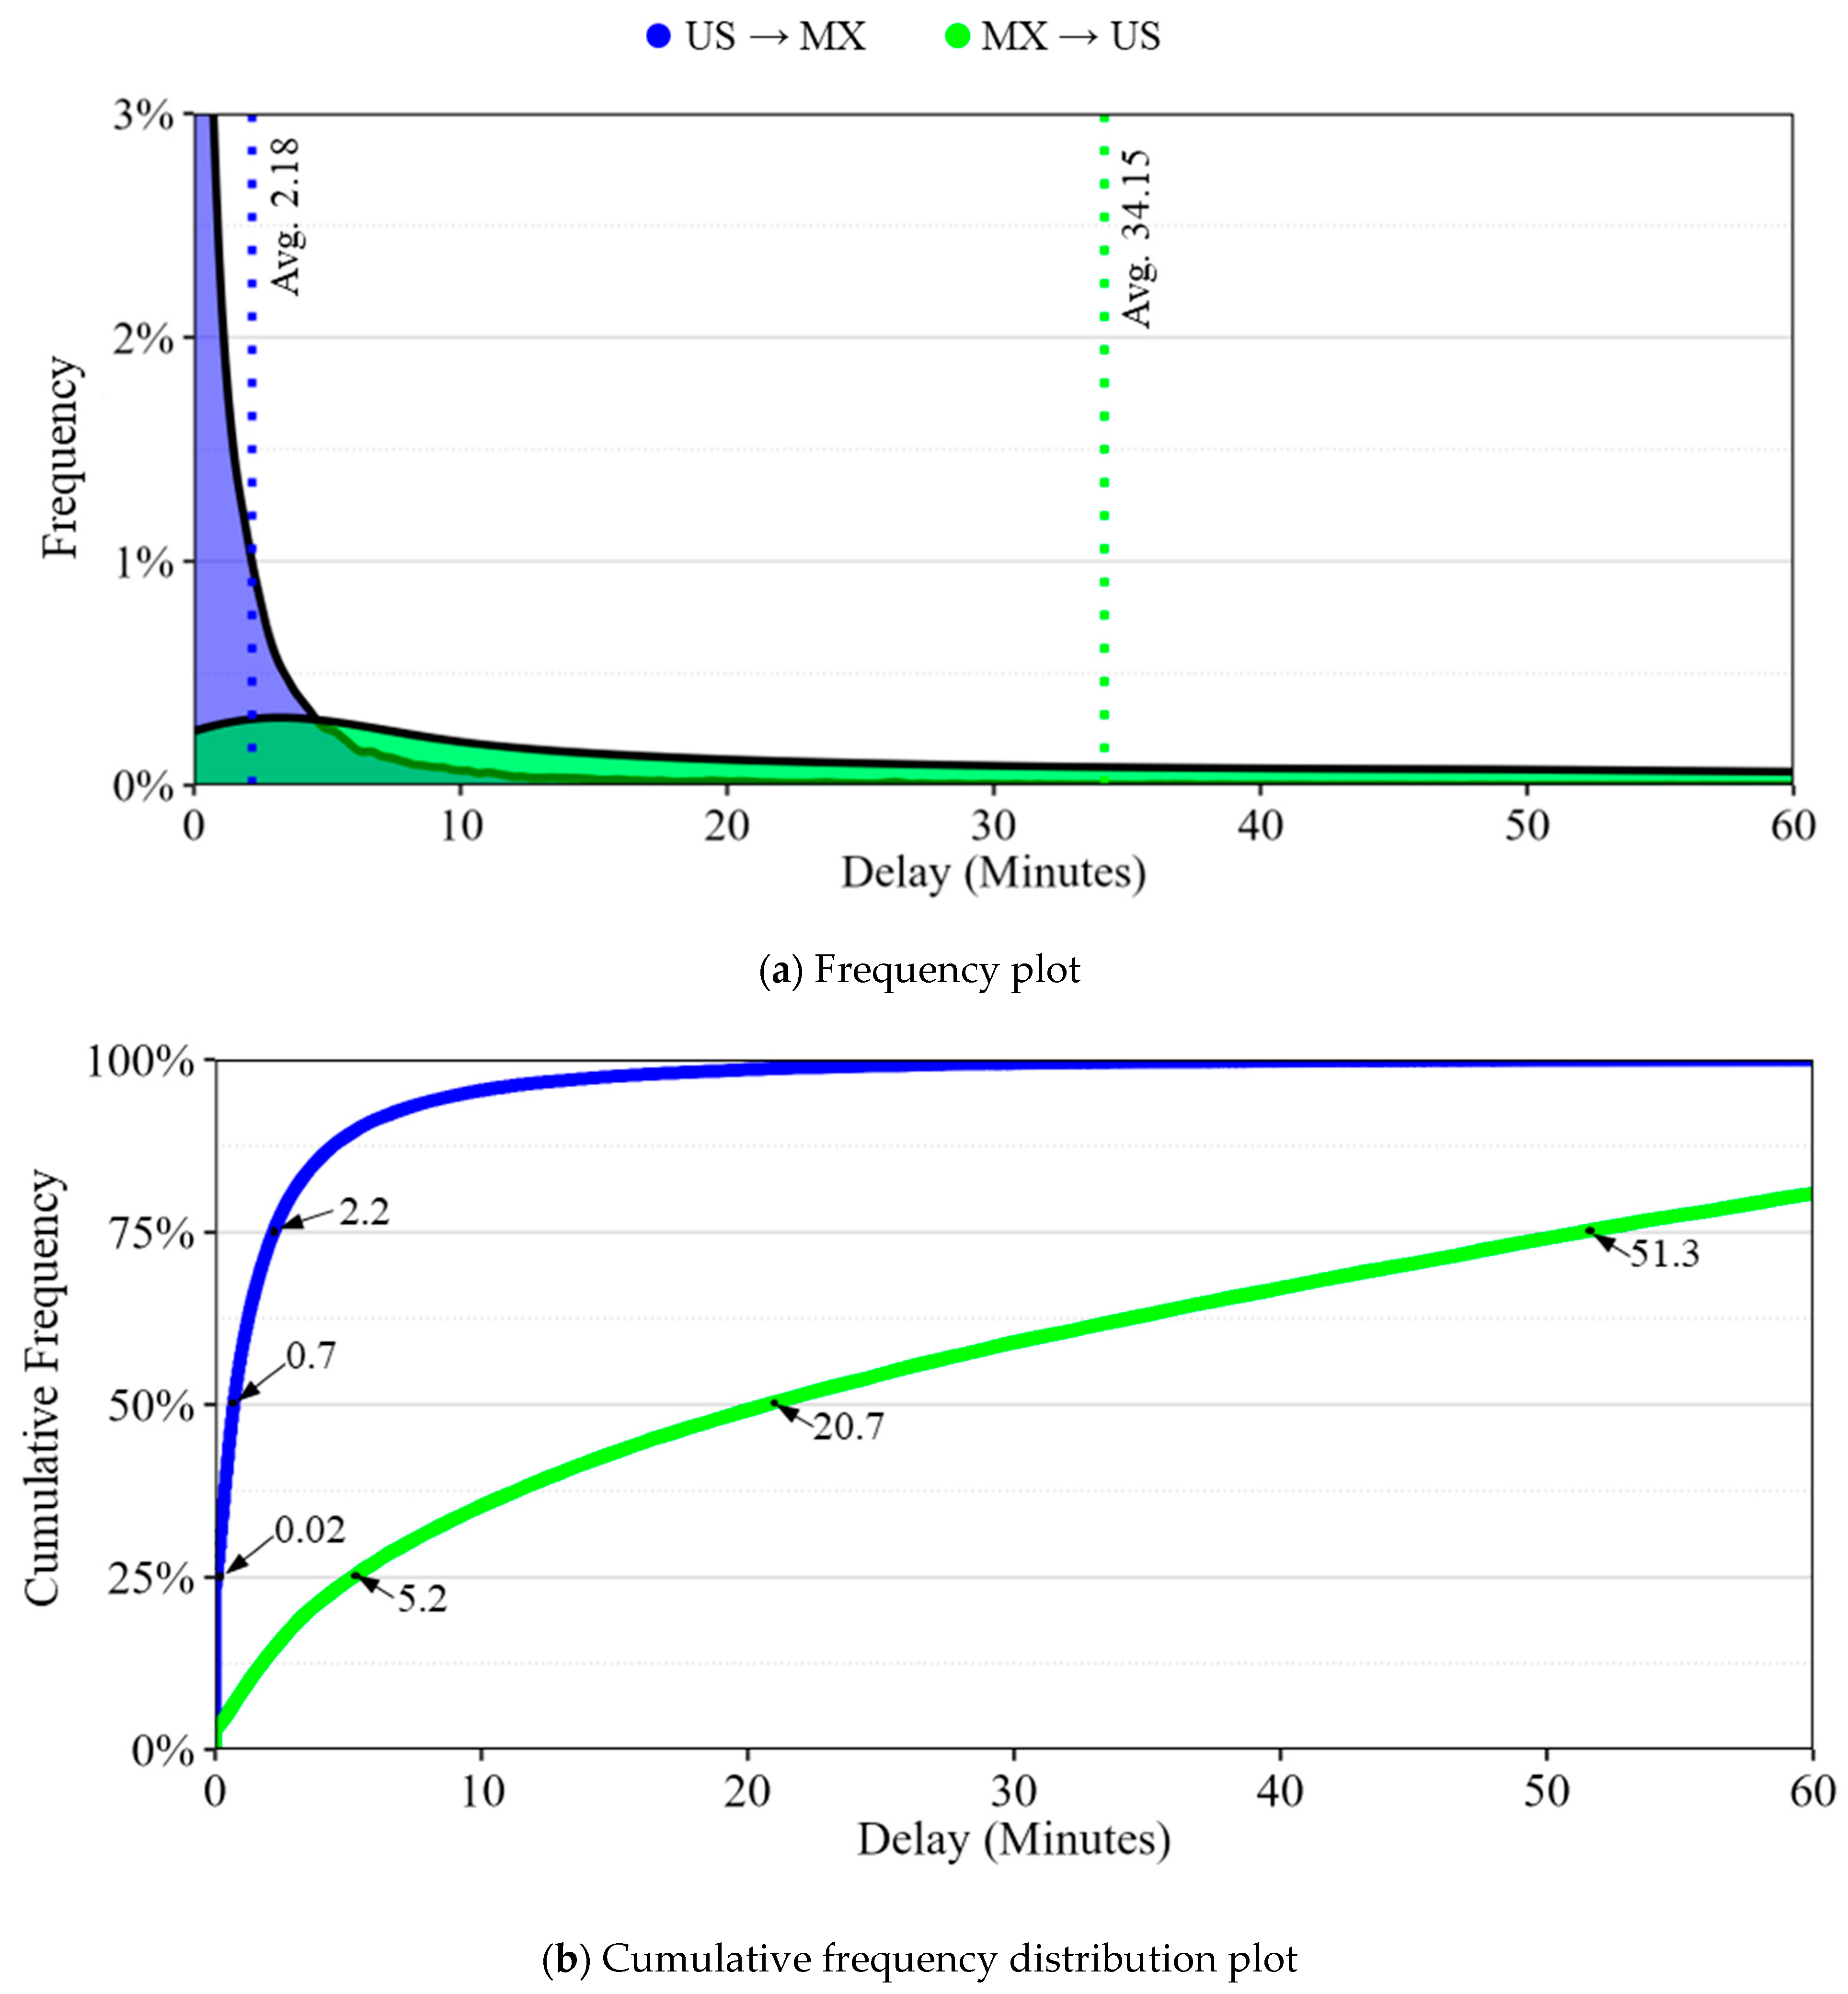
Figure 5.
Summary for trips from MX to the US (MX → US).
Figure 5.
Summary for trips from MX to the US (MX → US).
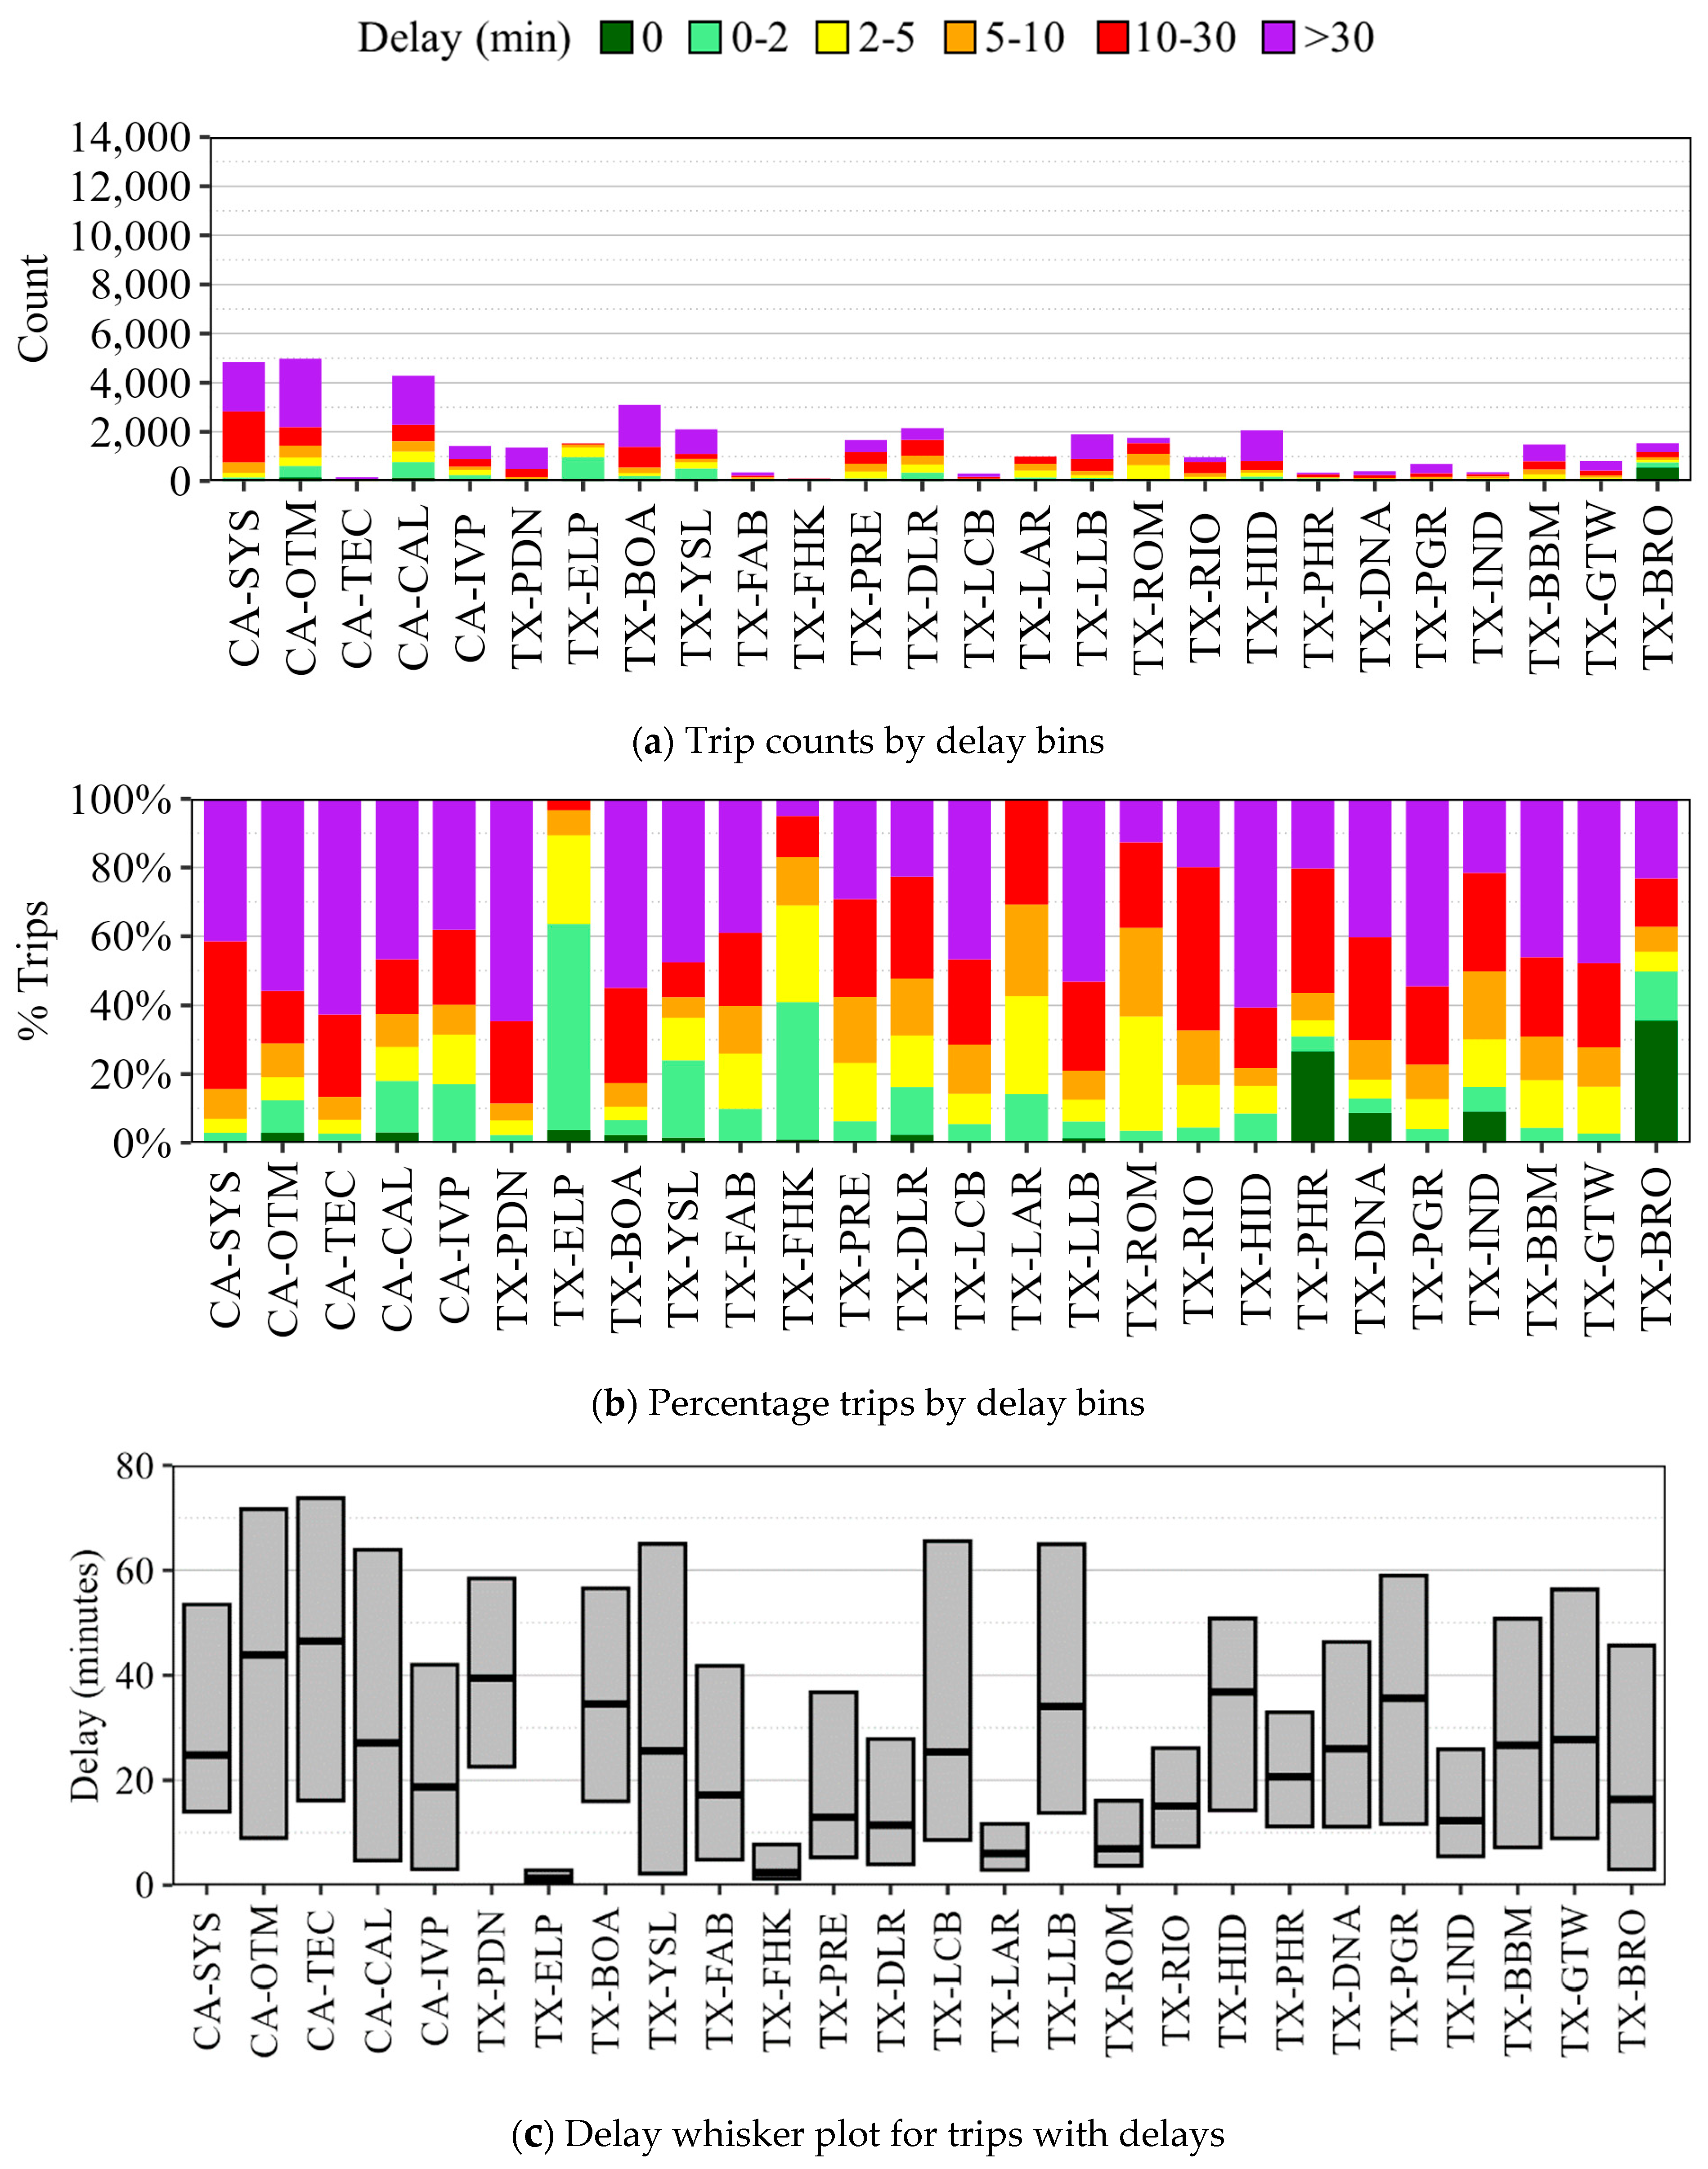
Figure 6.
Summary for trips from the US to MX (US → MX).
Figure 6.
Summary for trips from the US to MX (US → MX).
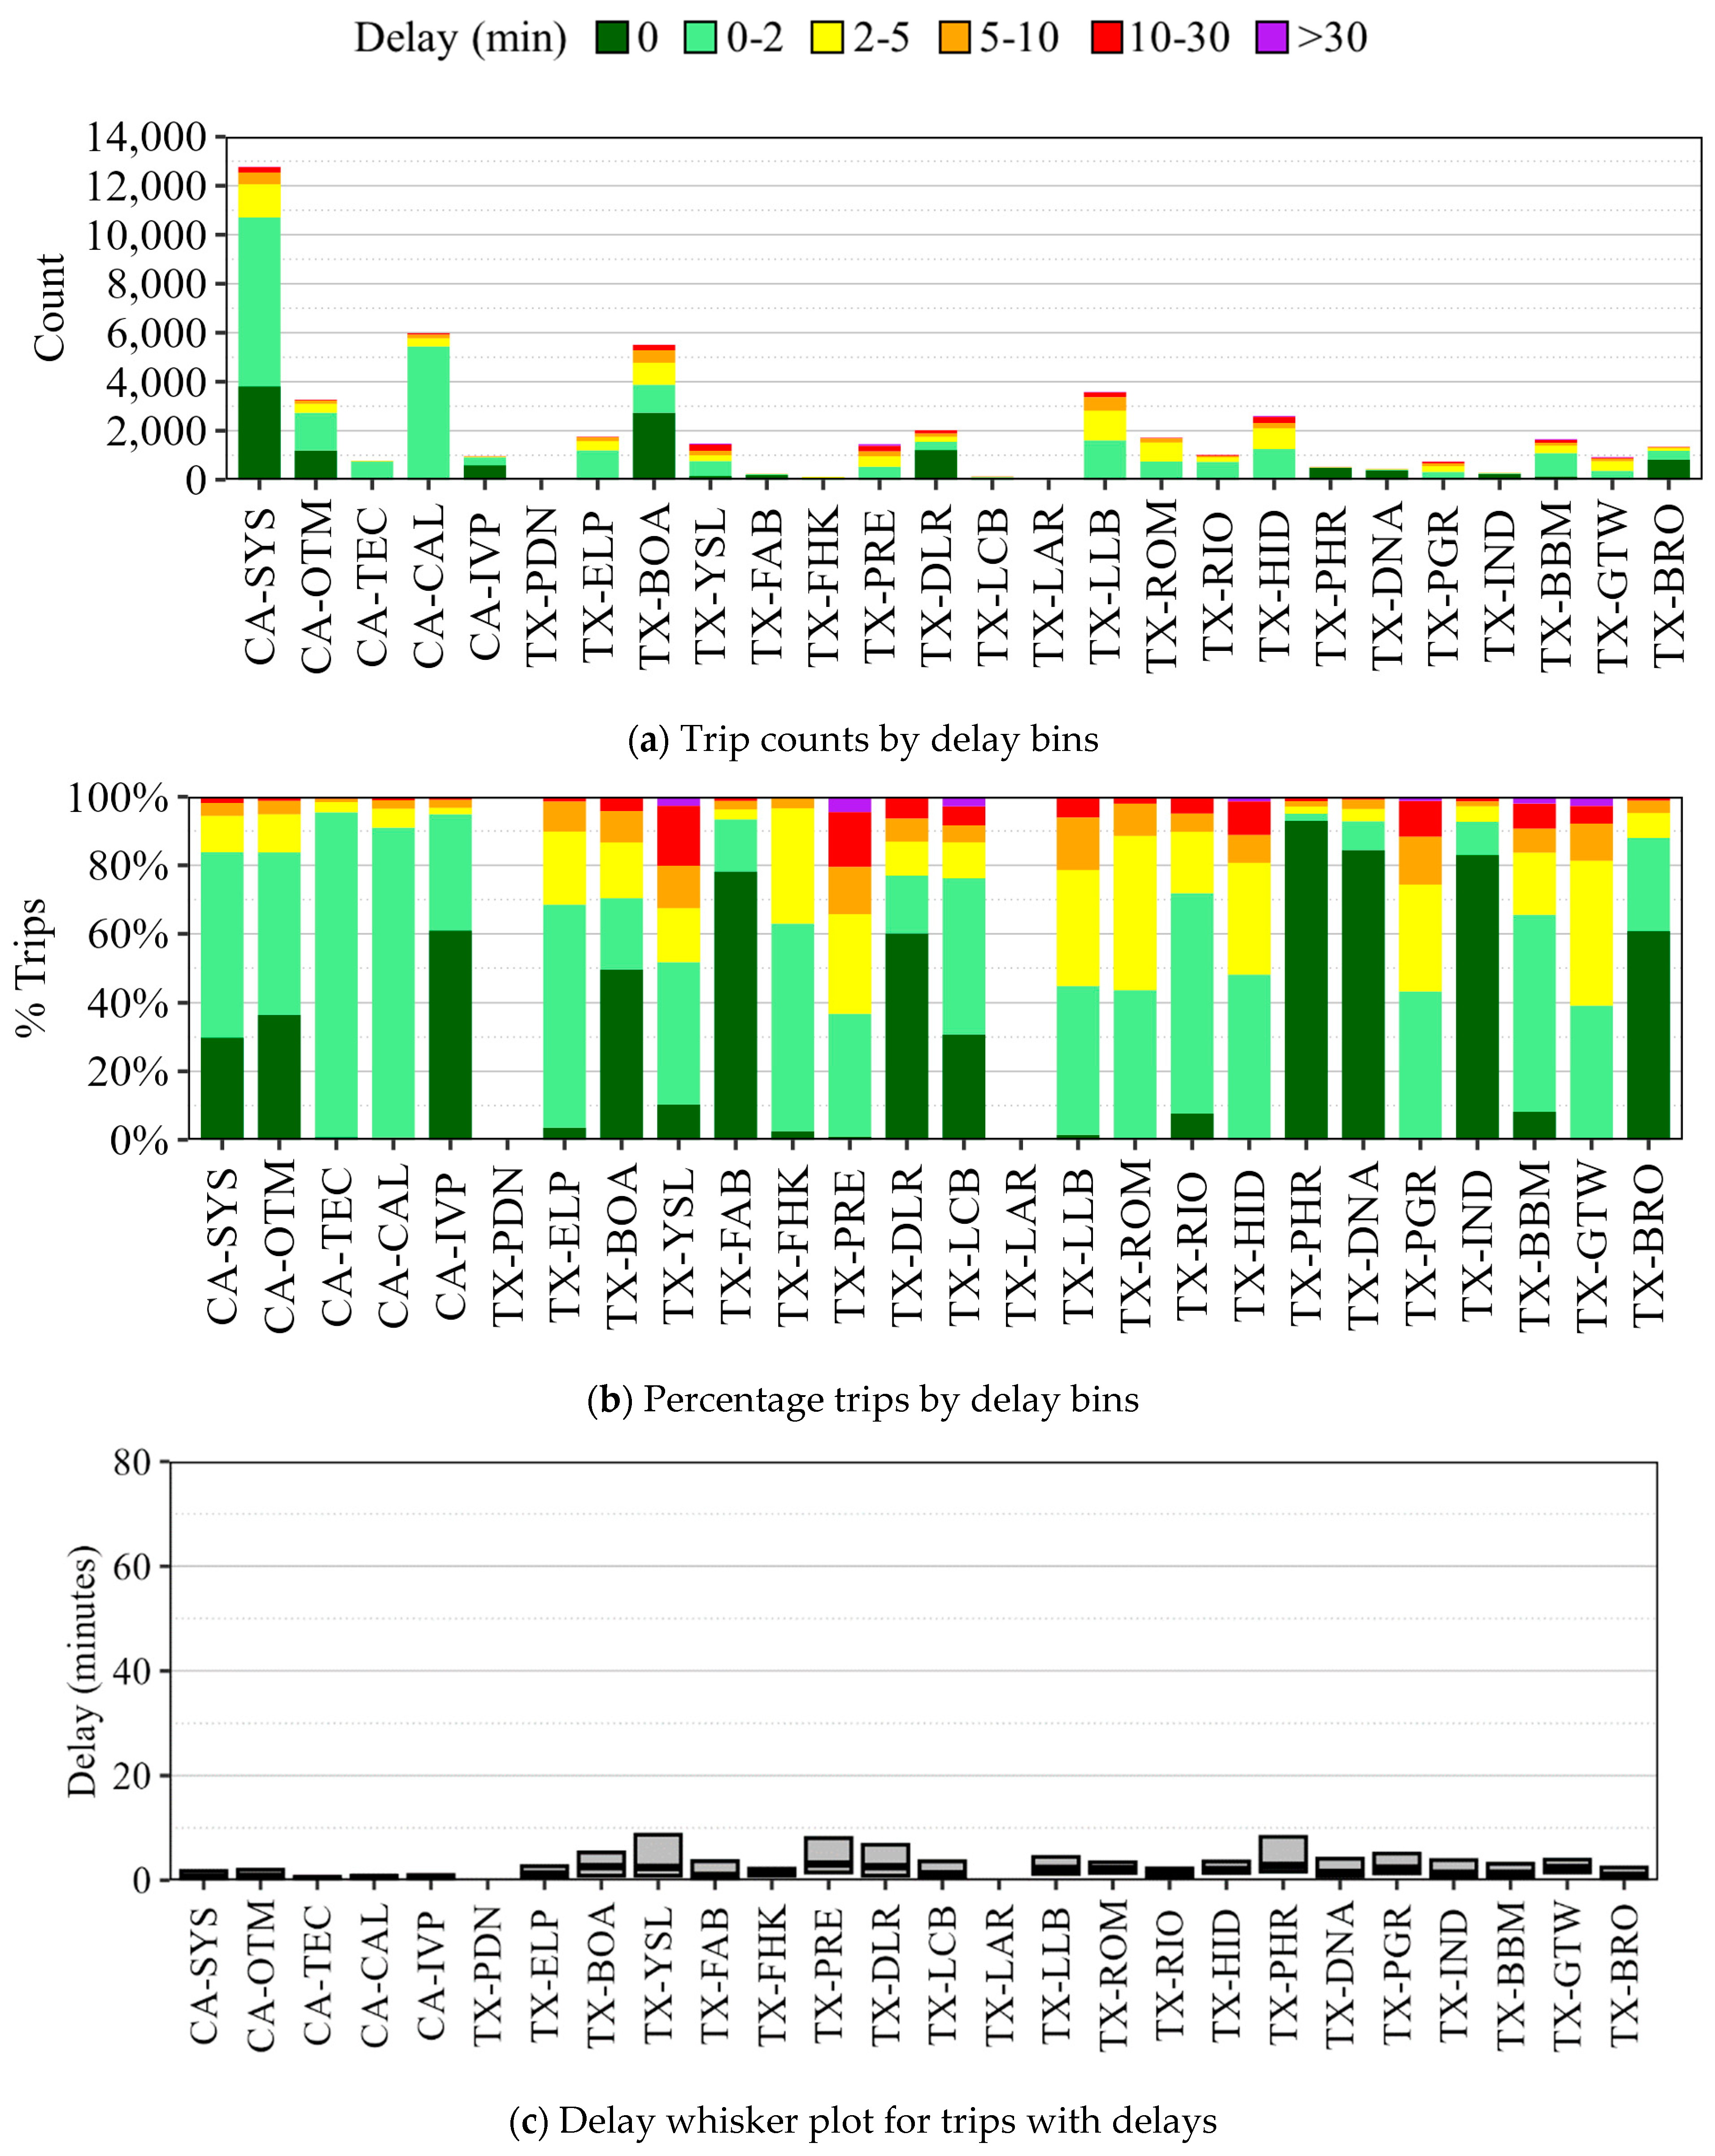
Figure 7.
Ranked border crossings by total trip count.
Figure 7.
Ranked border crossings by total trip count.
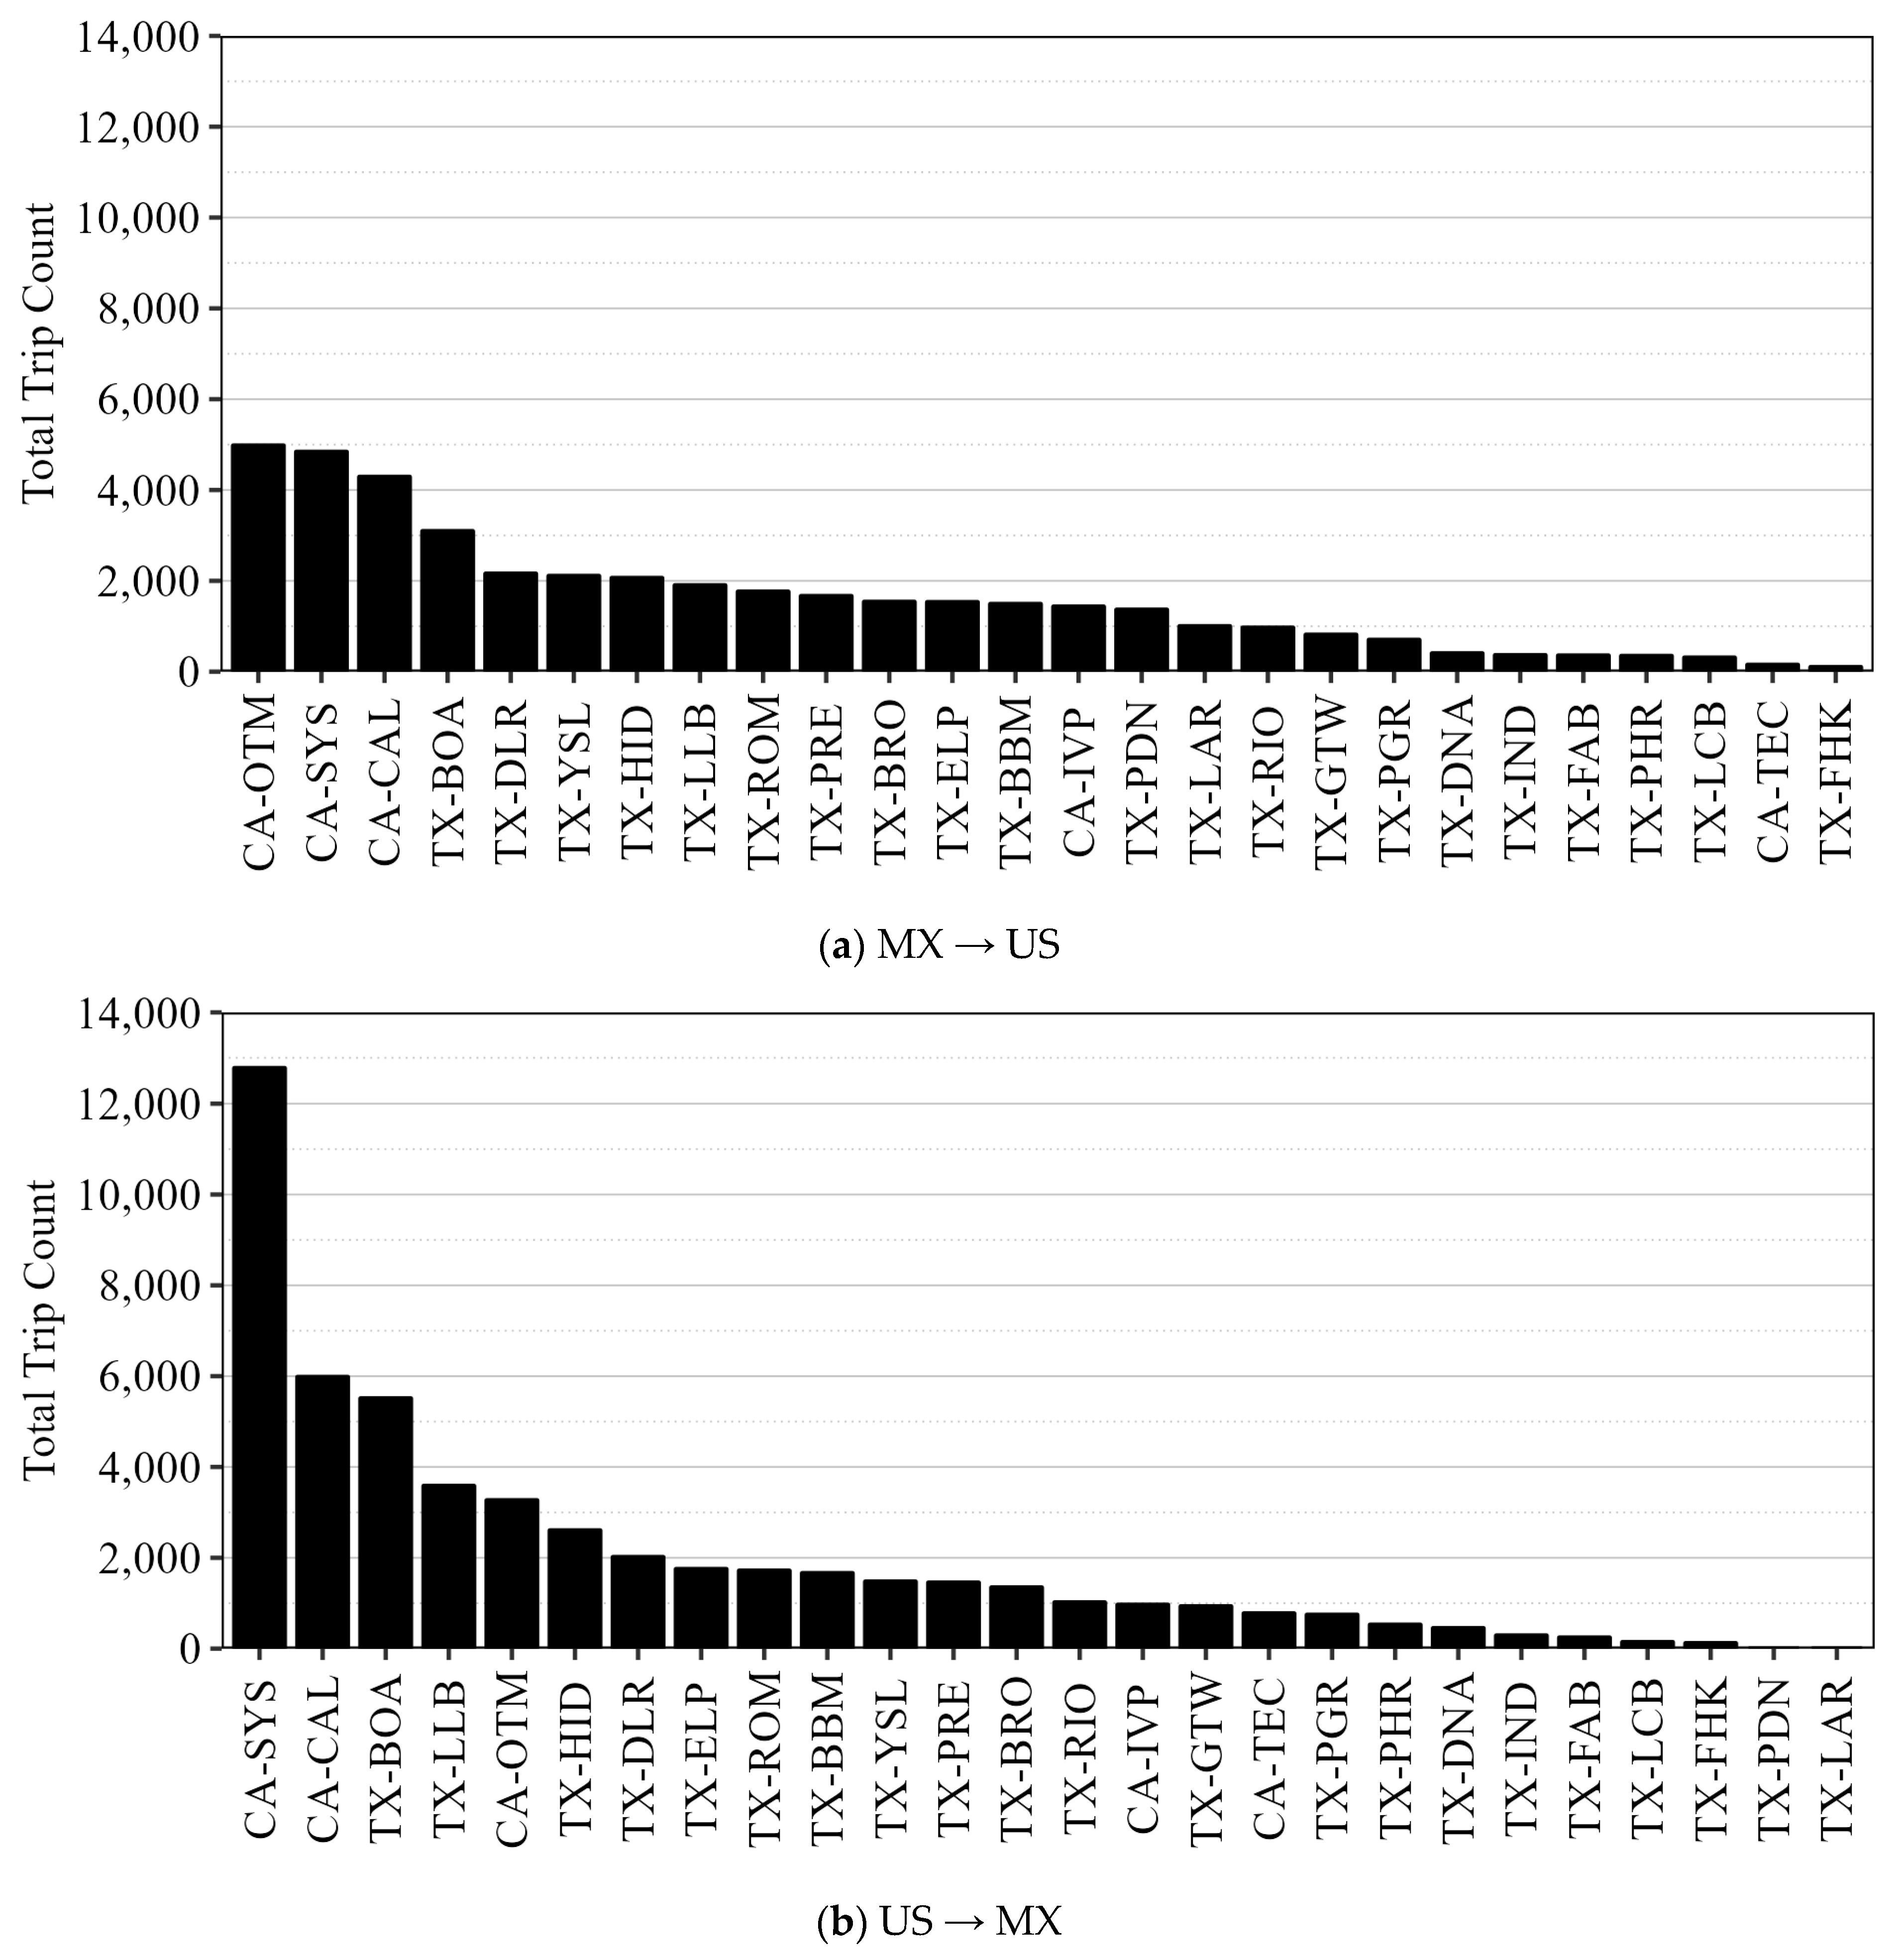
Figure 8.
Ranked border crossings by average delay for delayed trips.
Figure 8.
Ranked border crossings by average delay for delayed trips.
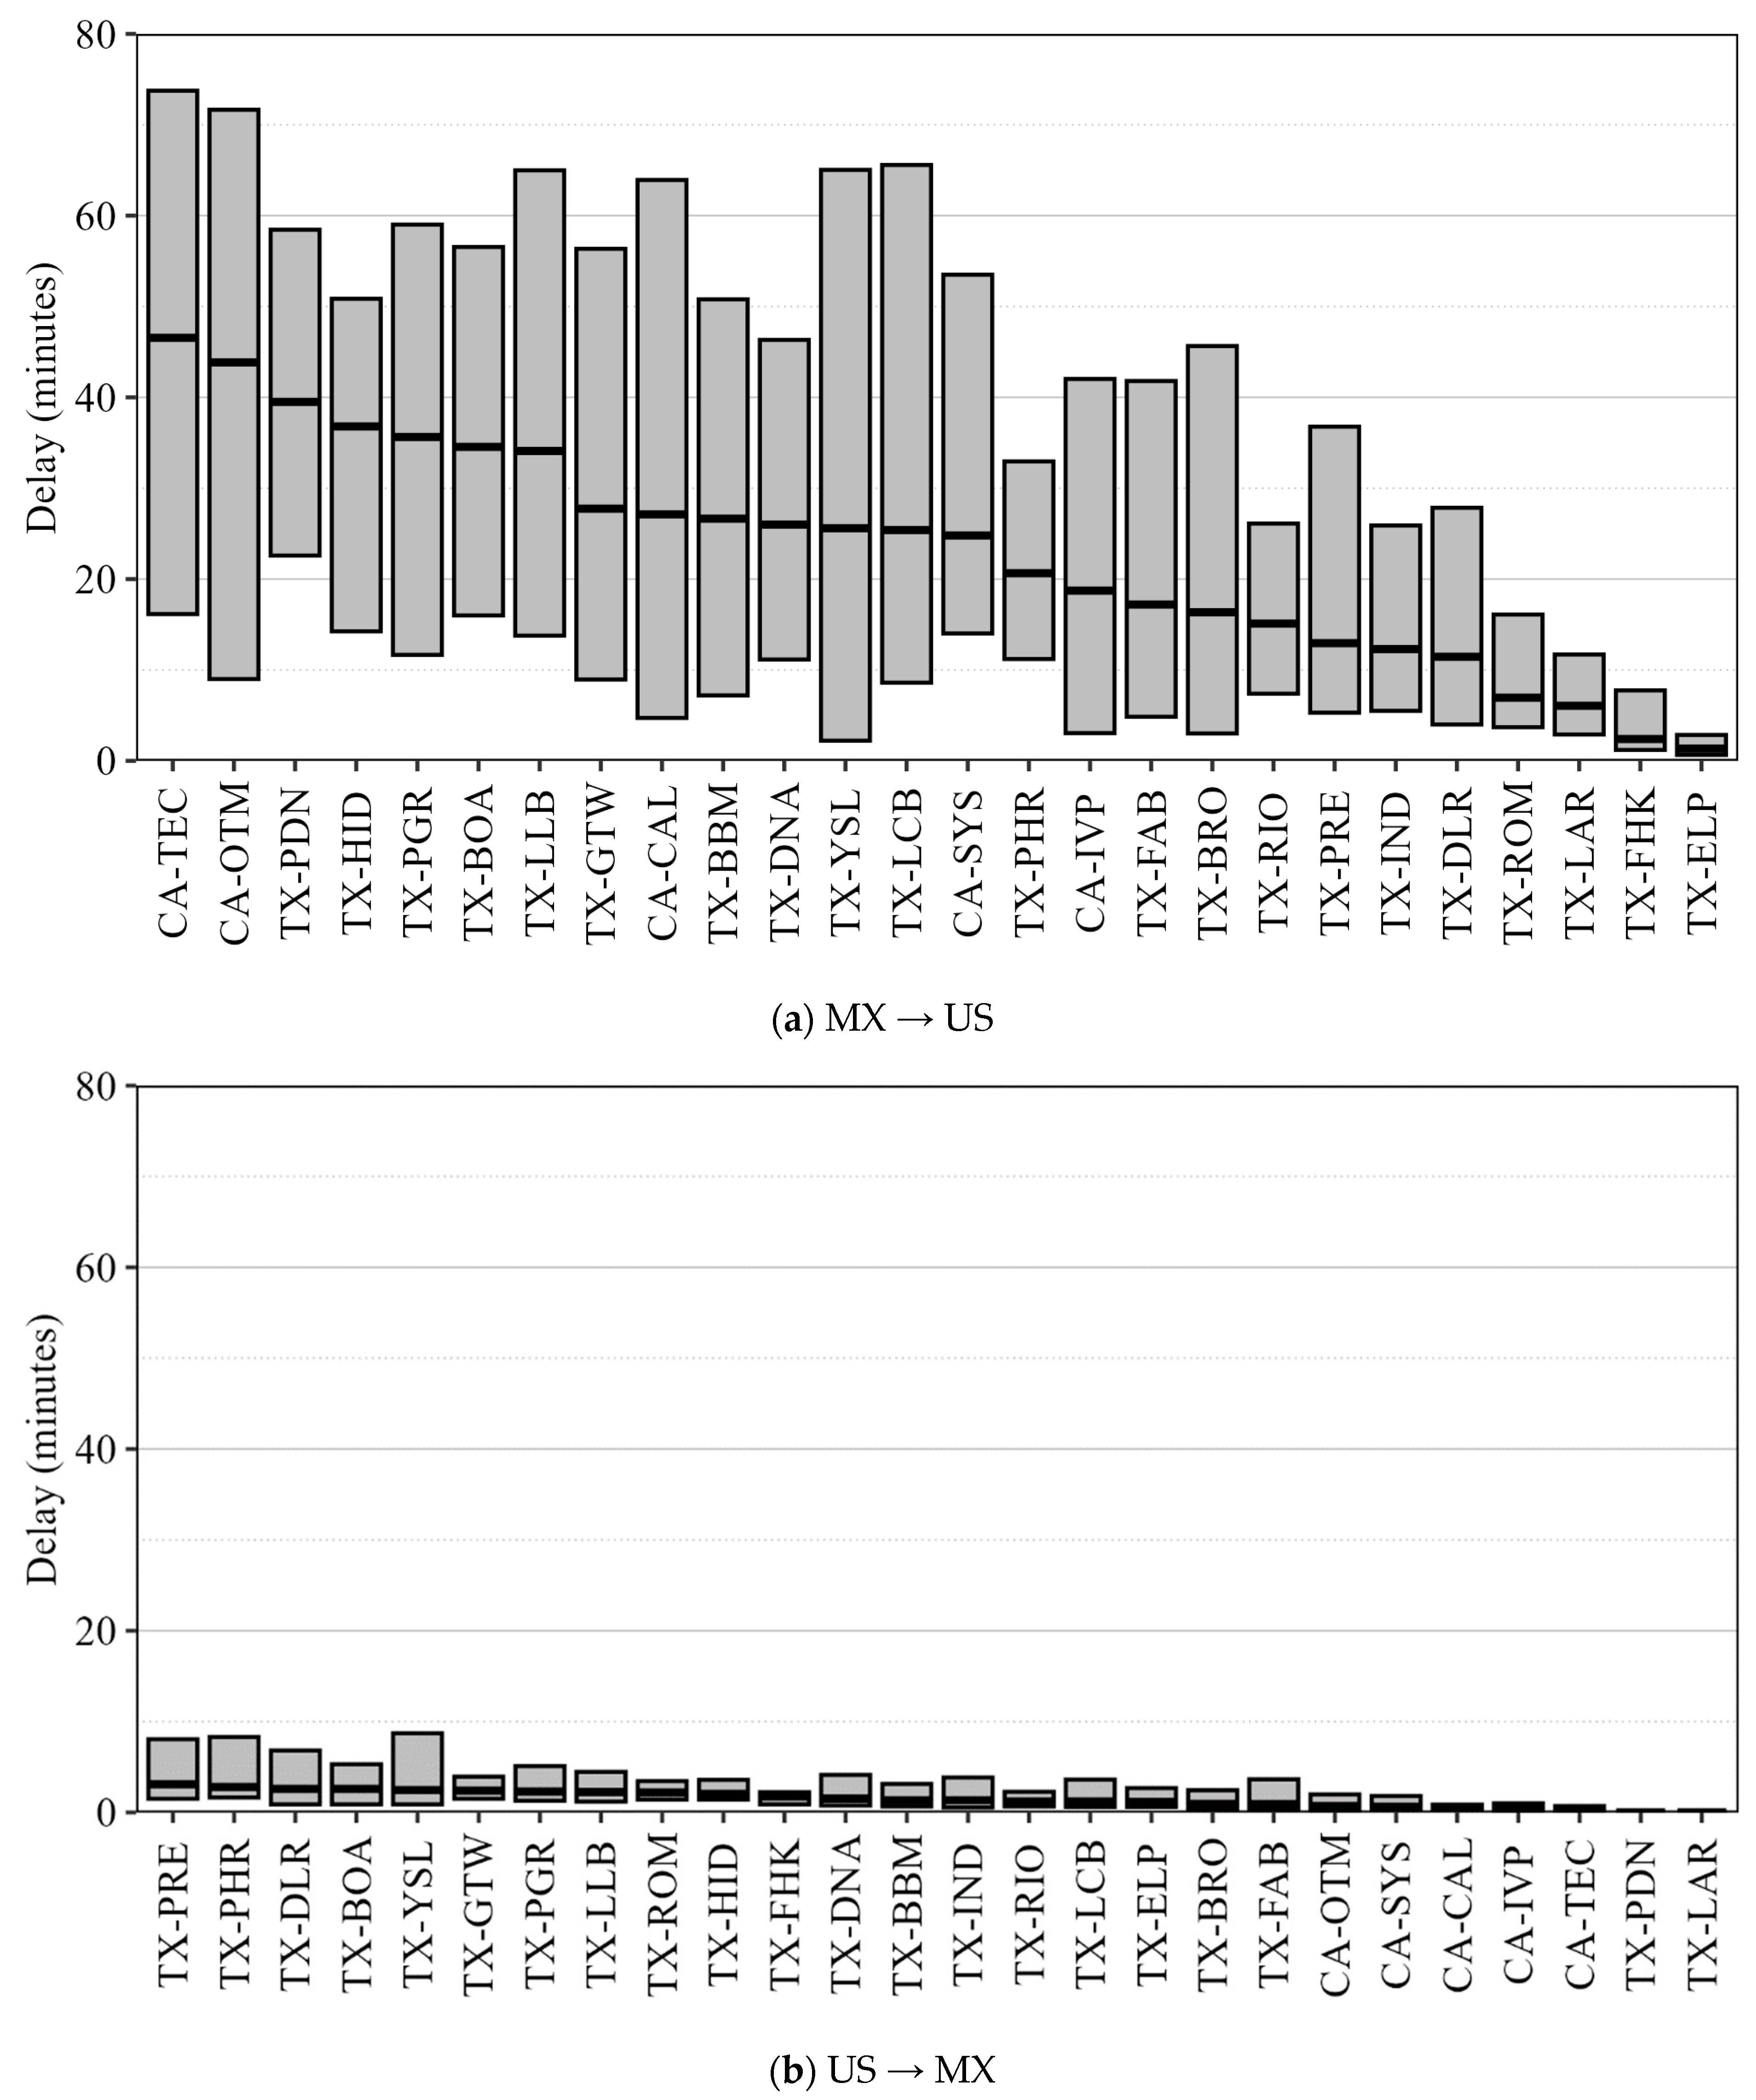
Figure 9.
Ranked border crossings by total delay for delayed trips.
Figure 9.
Ranked border crossings by total delay for delayed trips.
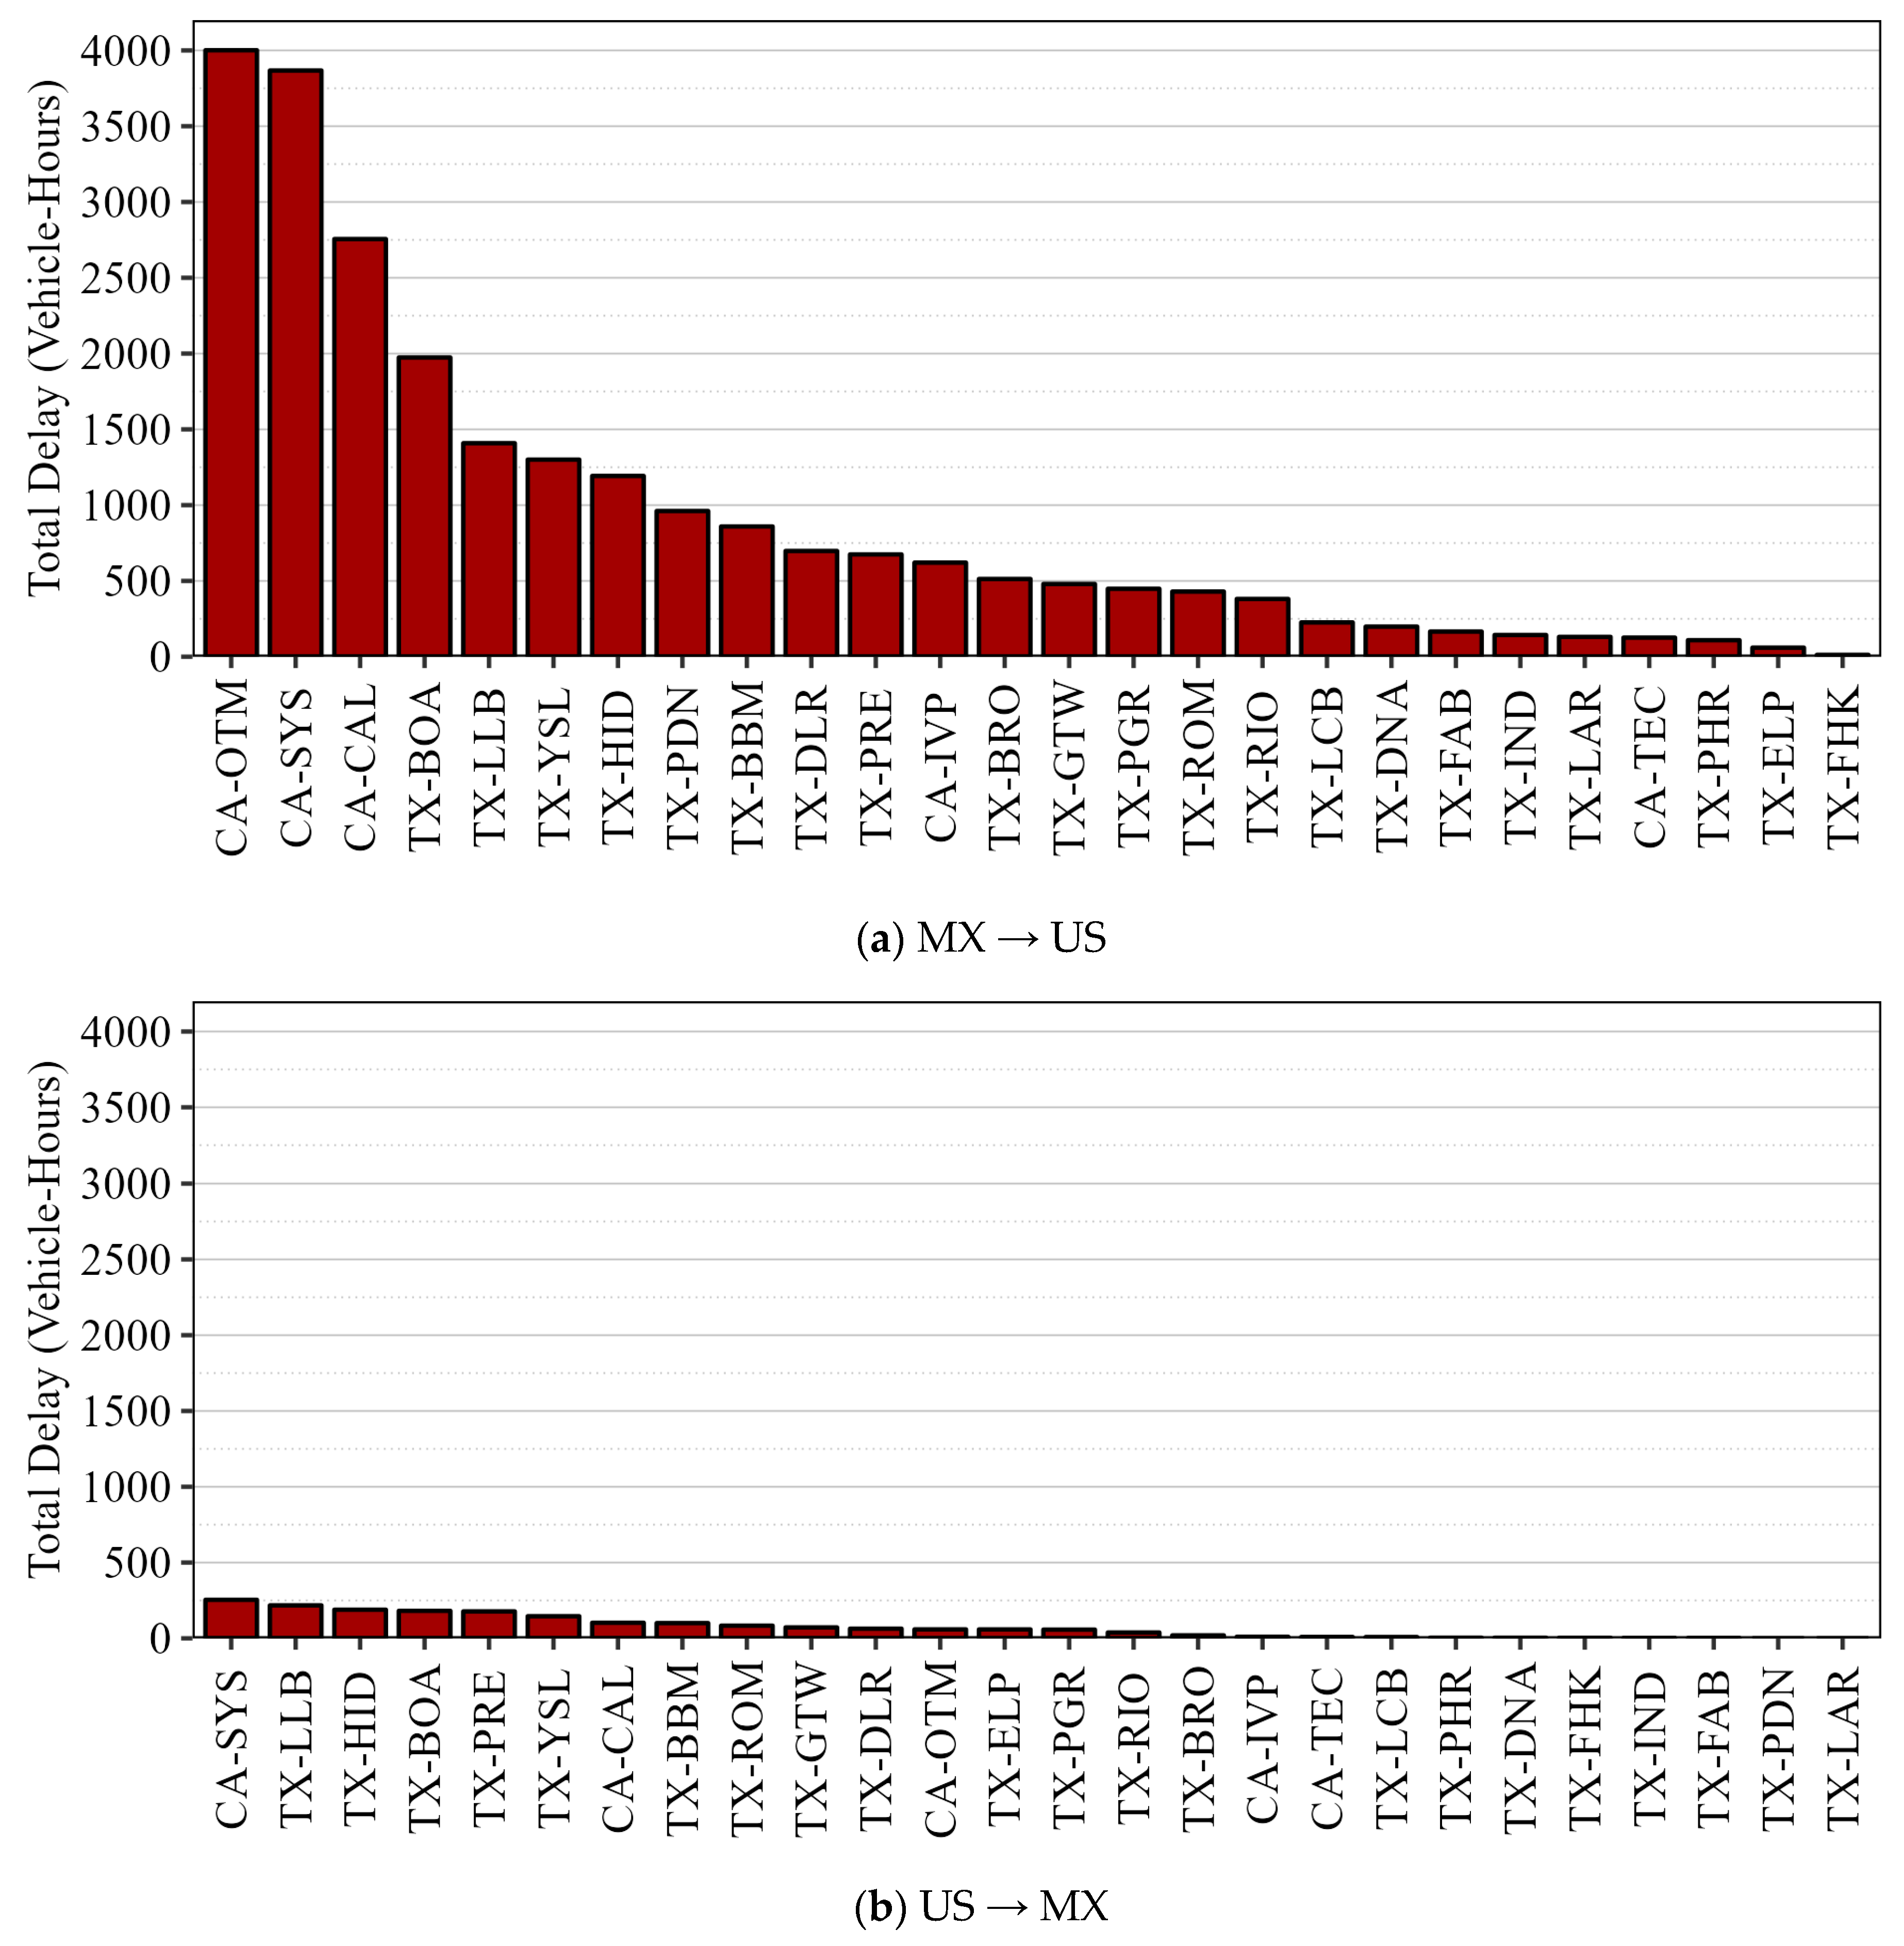
Figure 10.
Trip counts and delays by hour and day of the week at Otay Mesa (CA-OTM), California, land border (MX → US).
Figure 10.
Trip counts and delays by hour and day of the week at Otay Mesa (CA-OTM), California, land border (MX → US).
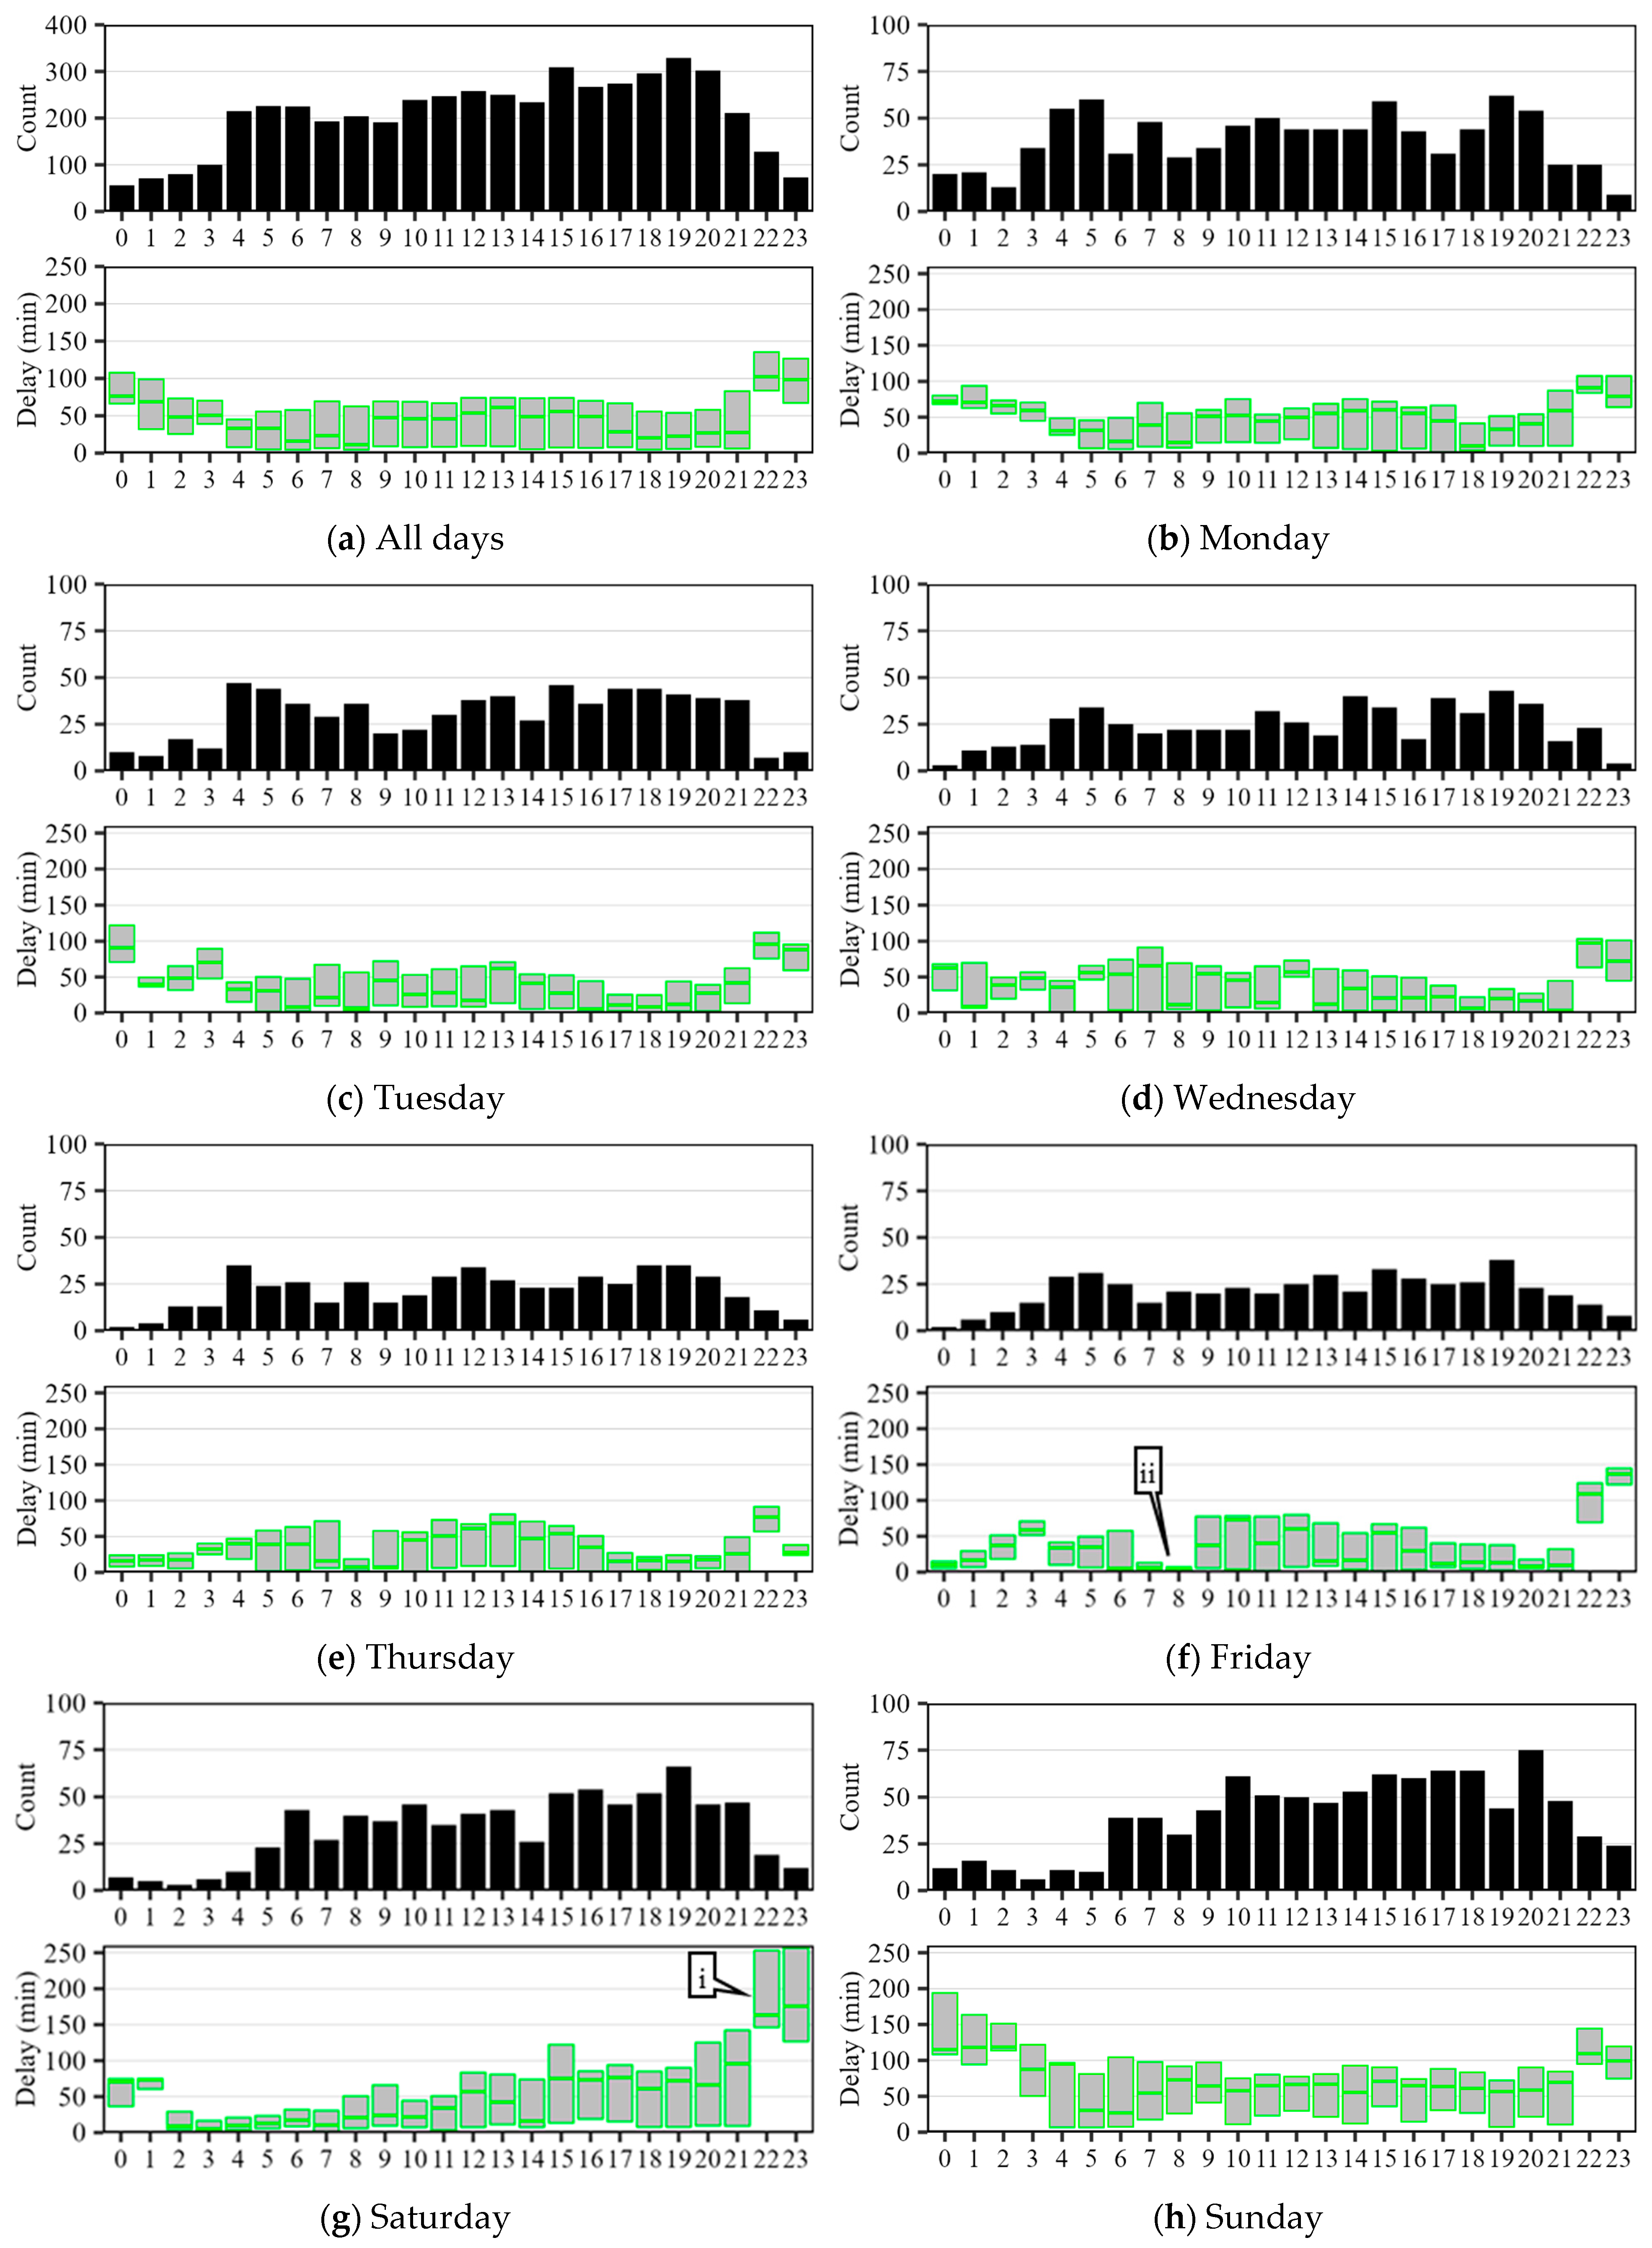
Figure 11.
Trip counts and delays by hour and day of the week at San Ysidro (CA-SYS), California, land border (US → MX).
Figure 11.
Trip counts and delays by hour and day of the week at San Ysidro (CA-SYS), California, land border (US → MX).
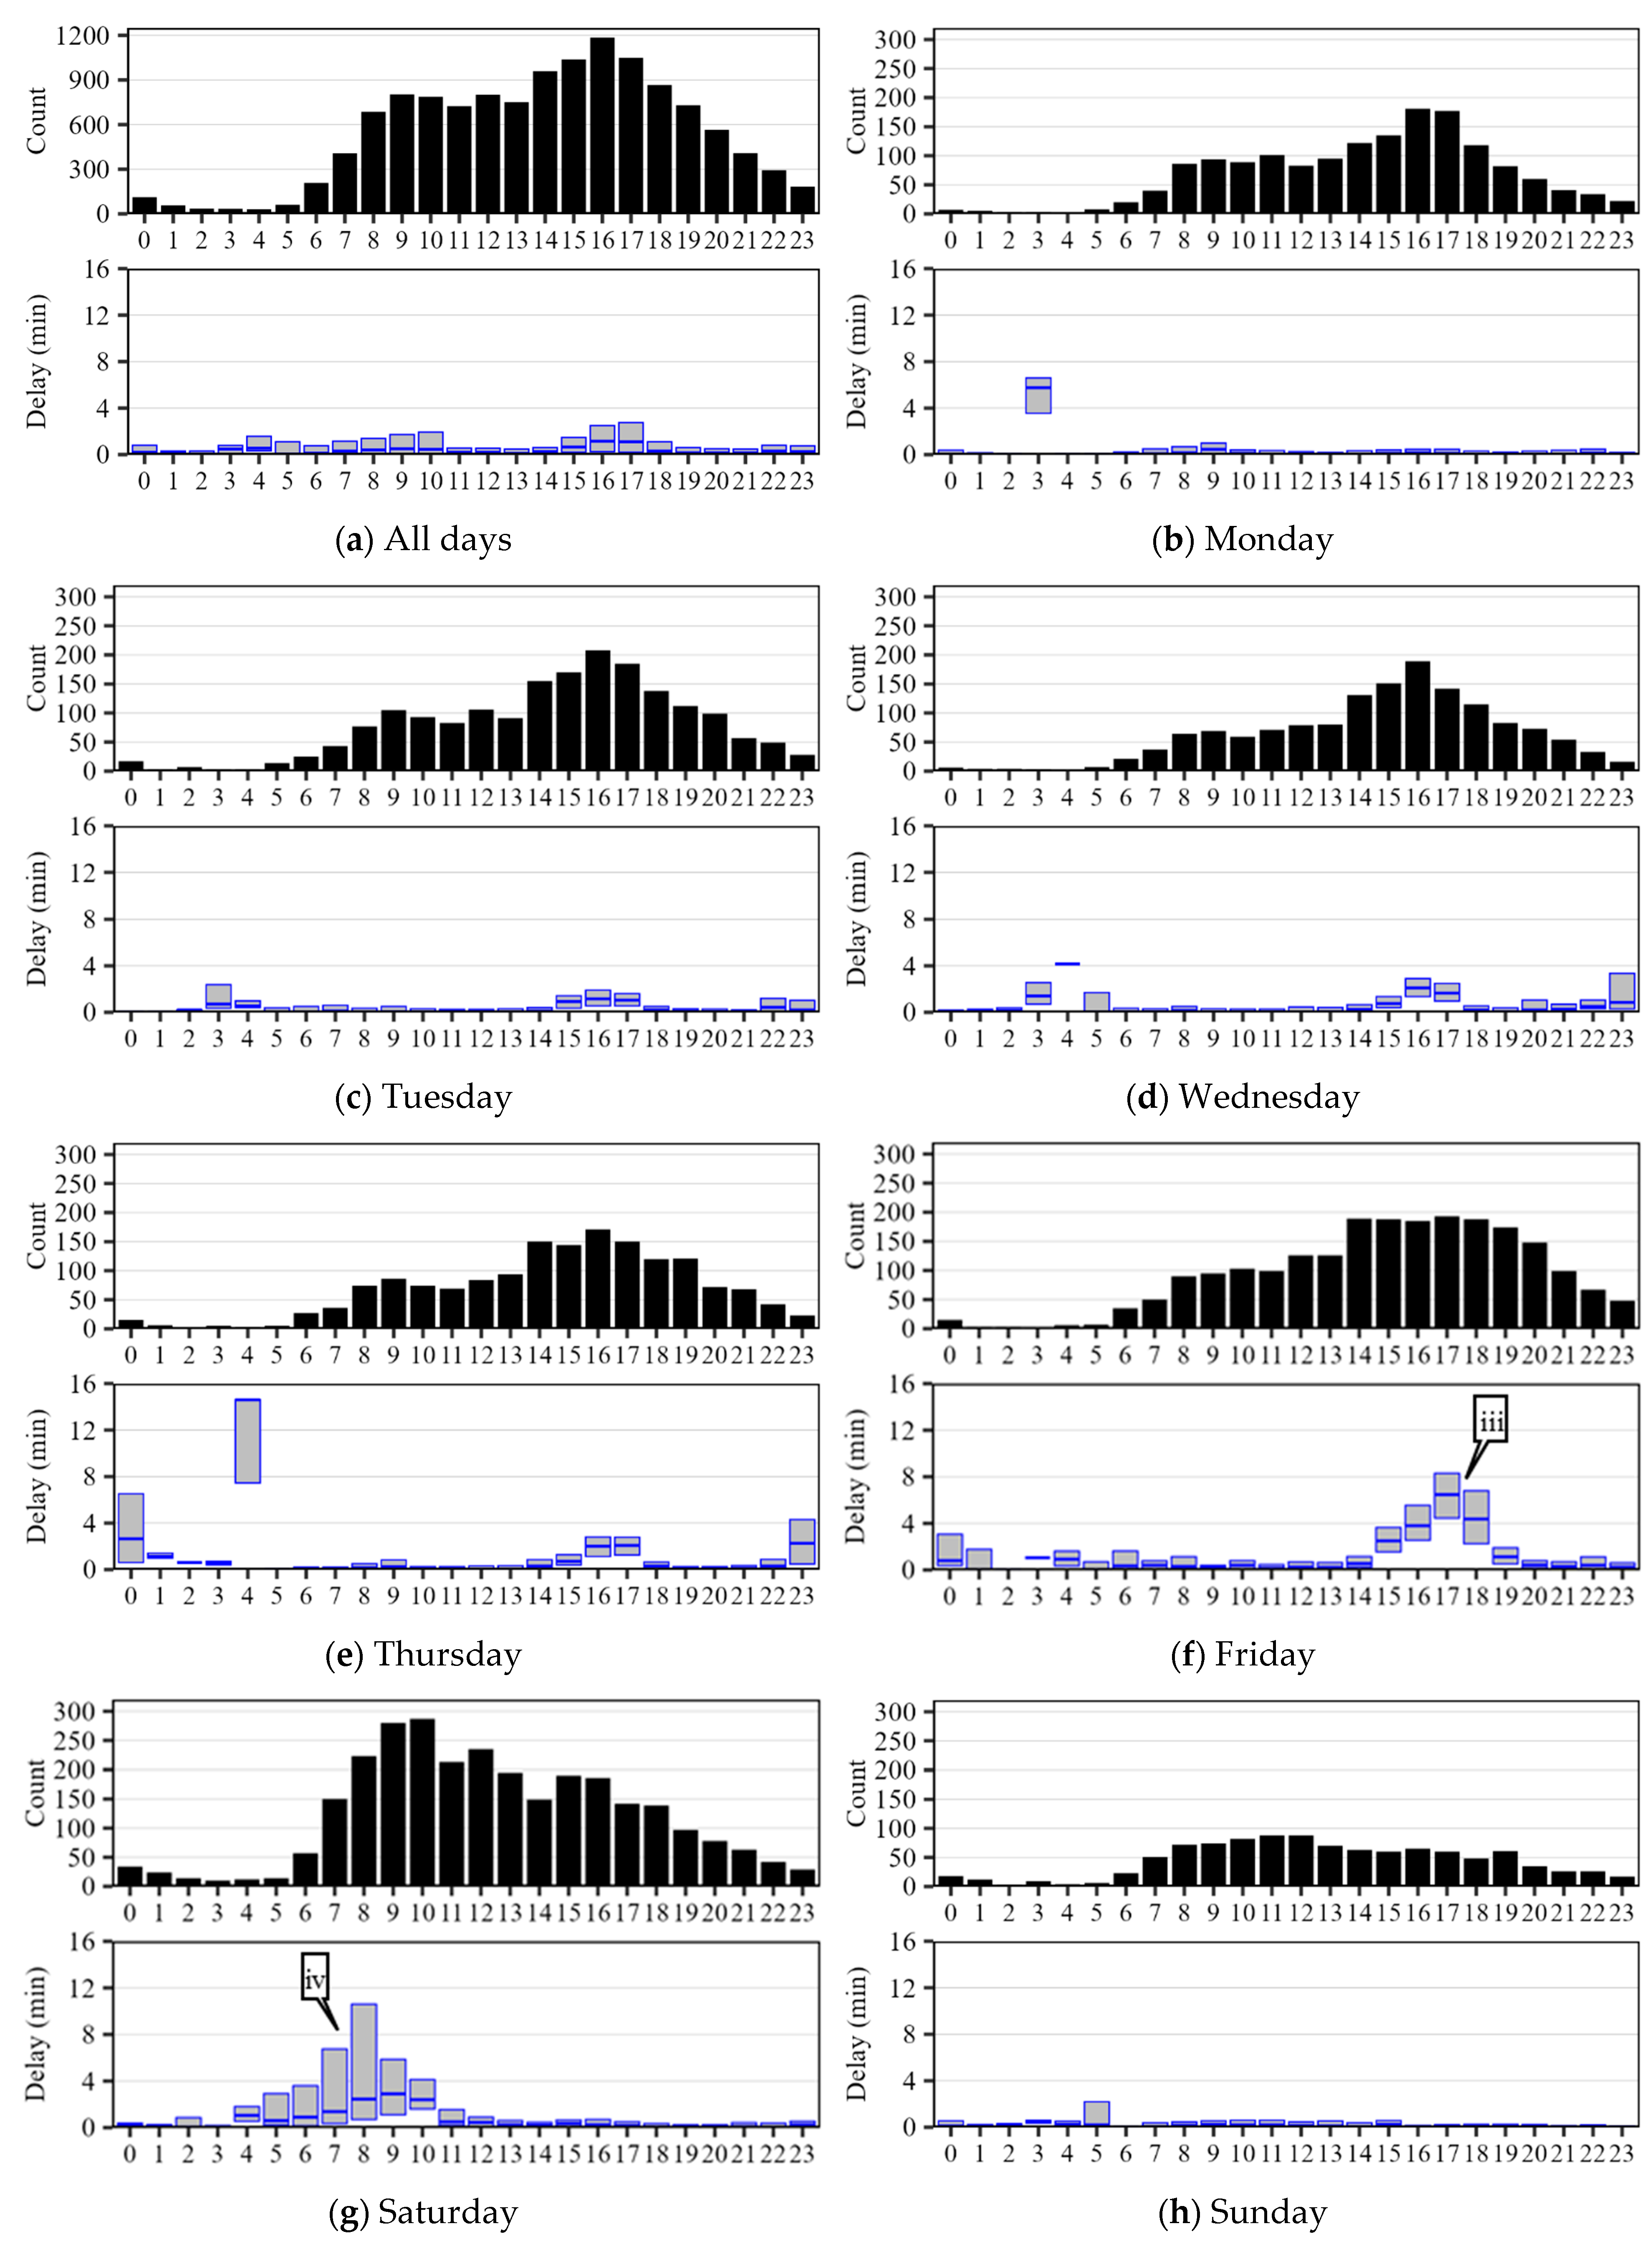
Table 1.
Summary of land border crossings between US and Mexico analyzed during this study.
Table 1.
Summary of land border crossings between US and Mexico analyzed during this study.
| US State | Mexico State | US Code | US Port of Entry | US Road/Highway | Mexico Port of Entry | Mexico Road/Highway | Opened in Year |
|---|---|---|---|---|---|---|---|
| California (CA) |
Baja California |
SYS | San Ysidro | I-5 | El Chaparral | Fed. 1 | 1906 |
| OTM | Otay Mesa | SR 905 | Mesa de Otay | Boulevard Garita de Otay | 1983 | ||
| TEC | Tecate | SR 188 | Tecate | Avenida Presidente Lázaro Cárdenas | 1919 | ||
| CAL | Calexico West | Cesar Chavez Boulevard | Mexicali | Calzada de los Presidentes | 1902 | ||
| IVP | Calexico East | SR 7 | Mexicali | Boulevard Abelardo L. Rodríguez | 1996 | ||
| Texas (TX) |
Chihuahua | PDN | El Paso—PDN | El Paso Street | Vial Juan Gabriel | Vial Juan Gabriel | 1898 |
| ELP | El Paso—Stanton | US 85 (Stanton St) | Lerdo | Calle Lerdo | 1898 | ||
| BOA | El Paso—BOTA | I-110 | Cordova | Fed. 45 (Avd. Abraham Lincoln) | 1967 | ||
| YSL | El Paso—Ysleta | Zaragoza Road | Zaragoza | Avenida Zaragoza | 1938 | ||
| FAB | Tornillo | FM 1109 | Guadalupe | Fed. 2 | 2014 | ||
| FHK | Fort Hancock | FM 1088 | El Porvenir | Praxedis Guerrero | 1936 | ||
| PRE | Presidio | US 67 | Ojinaga | Fed. 16 | 1917 | ||
| Coahuila | DLR | Del Rio | Loop 239 | Acuña | Francisco Javier Mina | 1919 | |
| Nuevo León | LCB | Laredo–Colombia Solidarity | SH 255 | Colombia | Nuevo Leon State Highway Spur 1 | 1991 | |
| Tamaulipas | LAR | Laredo Bridge 1 | Convent Ave | Nuevo Laredo | Avenida Guerrero | 1898 | |
| LLB | Laredo Juarez/ Lincoln |
I-35 (San Dario Avenue) | Nuevo Laredo | Boulevard Leandro Valle | 1976 | ||
| ROM | Roma | Estrella Street | Miguel Aleman | Avenida Venustiano Carranza | 1928 | ||
| RIO | Rio Grande City | Pete Díaz Avenue | Camargo | Boulevard Ensenada | 1905 | ||
| HID | Hidalgo | US 281 | Reynosa | Luis Echeverria Alvarez | 1905 | ||
| PHR | Pharr | South Cage Boulevard | Reynosa | Fed. 40 | 1994 | ||
| DNA | Donna | FM 493 | Río Bravo | Carretera Reynosa-Matamoros | 2010 | ||
| PGR | Progreso | FM 1015 | Nuevo Progreso | Benito Juarez | 1952 | ||
| IND | Los Indios | Cantu Road | Lucio Blanco | Carretera Reynosa-Matamoros | 1992 | ||
| BBM | Brownsville—B&M | Mexico Street | Matamoros | Las Americas | 1909 | ||
| GTW | Brownsville—Gateway | SH 4 (International Boulevard) | Matamoros | Alvaro Obregon | 1926 | ||
| BRO | Brownsville—Veterans | I-69E/US 77/US 83 | Matamoros | Avenida 5 de Mayo | 1999 |
Table 2.
Sample data for OD pairs at CA-SYS crossing with travel time.
Table 2.
Sample data for OD pairs at CA-SYS crossing with travel time.
| Date | Origin Time | OD Pair | Travel Time (min) |
|---|---|---|---|
| 3 August 2020 | 19:31:42 | 56.5 | |
| 22 August 2020 | 14:18:39 | 30 | |
| 20 August 2020 | 08:45:34 | 14 | |
| 25 August 2020 | 06:18:12 | 8.95 | |
| 7 August 2020 | 17:32:16 | 5.35 | |
| 11 August 2020 | 13:16:51 | 4.1 | |
| 2 August 2020 | 11:53:18 | 2.27 | |
| 21 August 2020 | 17:31:12 | 8.87 |
Table 3.
Top five border crossings ranked by trips to the US experiencing travel time delays longer than 5 min.
Table 3.
Top five border crossings ranked by trips to the US experiencing travel time delays longer than 5 min.
| Rank | Border Crossing | Trips (MX → US) |
Trips Delay < 2 min |
Trips Delay 2–5 min |
Trips Delay 5–10 min [a] |
Trips Delay 10–30 min [b] |
Trips Delay ≥ 30 min [c] |
Ranking by Trips Delay ≥ 5 min [a + b + c] |
|---|---|---|---|---|---|---|---|---|
| 1 | CA-SYS | 4840 | 143 (3.0%) |
192 (4.0%) |
420 (8.7%) |
2077 (42.9%) |
2008 (41.5%) |
4505 (93.1%) |
| 2 | CA-OTM | 4978 | 616 (12.4%) |
336 (6.7%) |
488 (9.8%) |
755 (15.2%) |
2783 (55.9%) |
4026 (80.9%) |
| 3 | CA-CAL | 4289 | 774 (18.0%) |
423 (9.9%) |
410 (9.6%) |
678 (15.8%) |
2004 (46.7%) |
3092 (72.1%) |
| 4 | TX-BOA | 3093 | 204 (6.6%) |
121 (3.9%) |
212 (6.9%) |
854 (27.6%) |
1702 (55.0%) |
2768 (89.5%) |
| 5 | TX-HID | 2062 | 177 (8.6%) |
165 (8.0%) |
106 (5.1%) |
364 (17.7%) |
1250 (60.6%) |
1720 (83.4%) |
Table 4.
Top five border crossings ranked by trips to MX experiencing travel time delays longer than 5 min.
Table 4.
Top five border crossings ranked by trips to MX experiencing travel time delays longer than 5 min.
| Rank | Border Crossing | Trips (US → MX) |
Trips Delay < 2 min |
Trips Delay 2–5 min |
Trips Delay 5–10 min [a] |
Trips Delay 10–30 min [b] |
Trips Delay ≥ 30 min [c] |
Ranking by Trips Delay ≥ 5 min [a + b + c] |
|---|---|---|---|---|---|---|---|---|
| 1 | TX-LLB | 3583 | 1610 (44.9%) |
1207 (33.7%) |
548 (15.3%) |
200 (5.6%) |
18 (0.5%) |
766 (21.4%) |
| 2 | TX-BOA | 5510 | 3880 (70.4%) |
895 (16.2%) |
502 (9.1%) |
228 (4.1%) |
5 (0.1%) |
735 (13.3%) |
| 3 | CA-SYS | 12,773 | 10,712 (83.9%) |
1348 (10.6%) |
478 (3.7%) |
224 (1.8%) |
11 (0.1%) |
713 (5.6%) |
| 4 | TX-HID | 2603 | 1253 (48.1%) |
848 (32.6%) |
211 (8.1%) |
256 (9.8%) |
35 (1.3%) |
502 (19.3%) |
| 5 | TX-PRE | 1453 | 535 (36.8%) |
420 (28.9%) |
200 (13.8%) |
233 (16.0%) |
65 (4.5%) |
498 (34.3%) |
|
Disclaimer/Publisher’s Note: The statements, opinions and data contained in all publications are solely those of the individual author(s) and contributor(s) and not of MDPI and/or the editor(s). MDPI and/or the editor(s) disclaim responsibility for any injury to people or property resulting from any ideas, methods, instructions or products referred to in the content. |