Personal Consumption Expenditures by State, 2022
[ad_1]
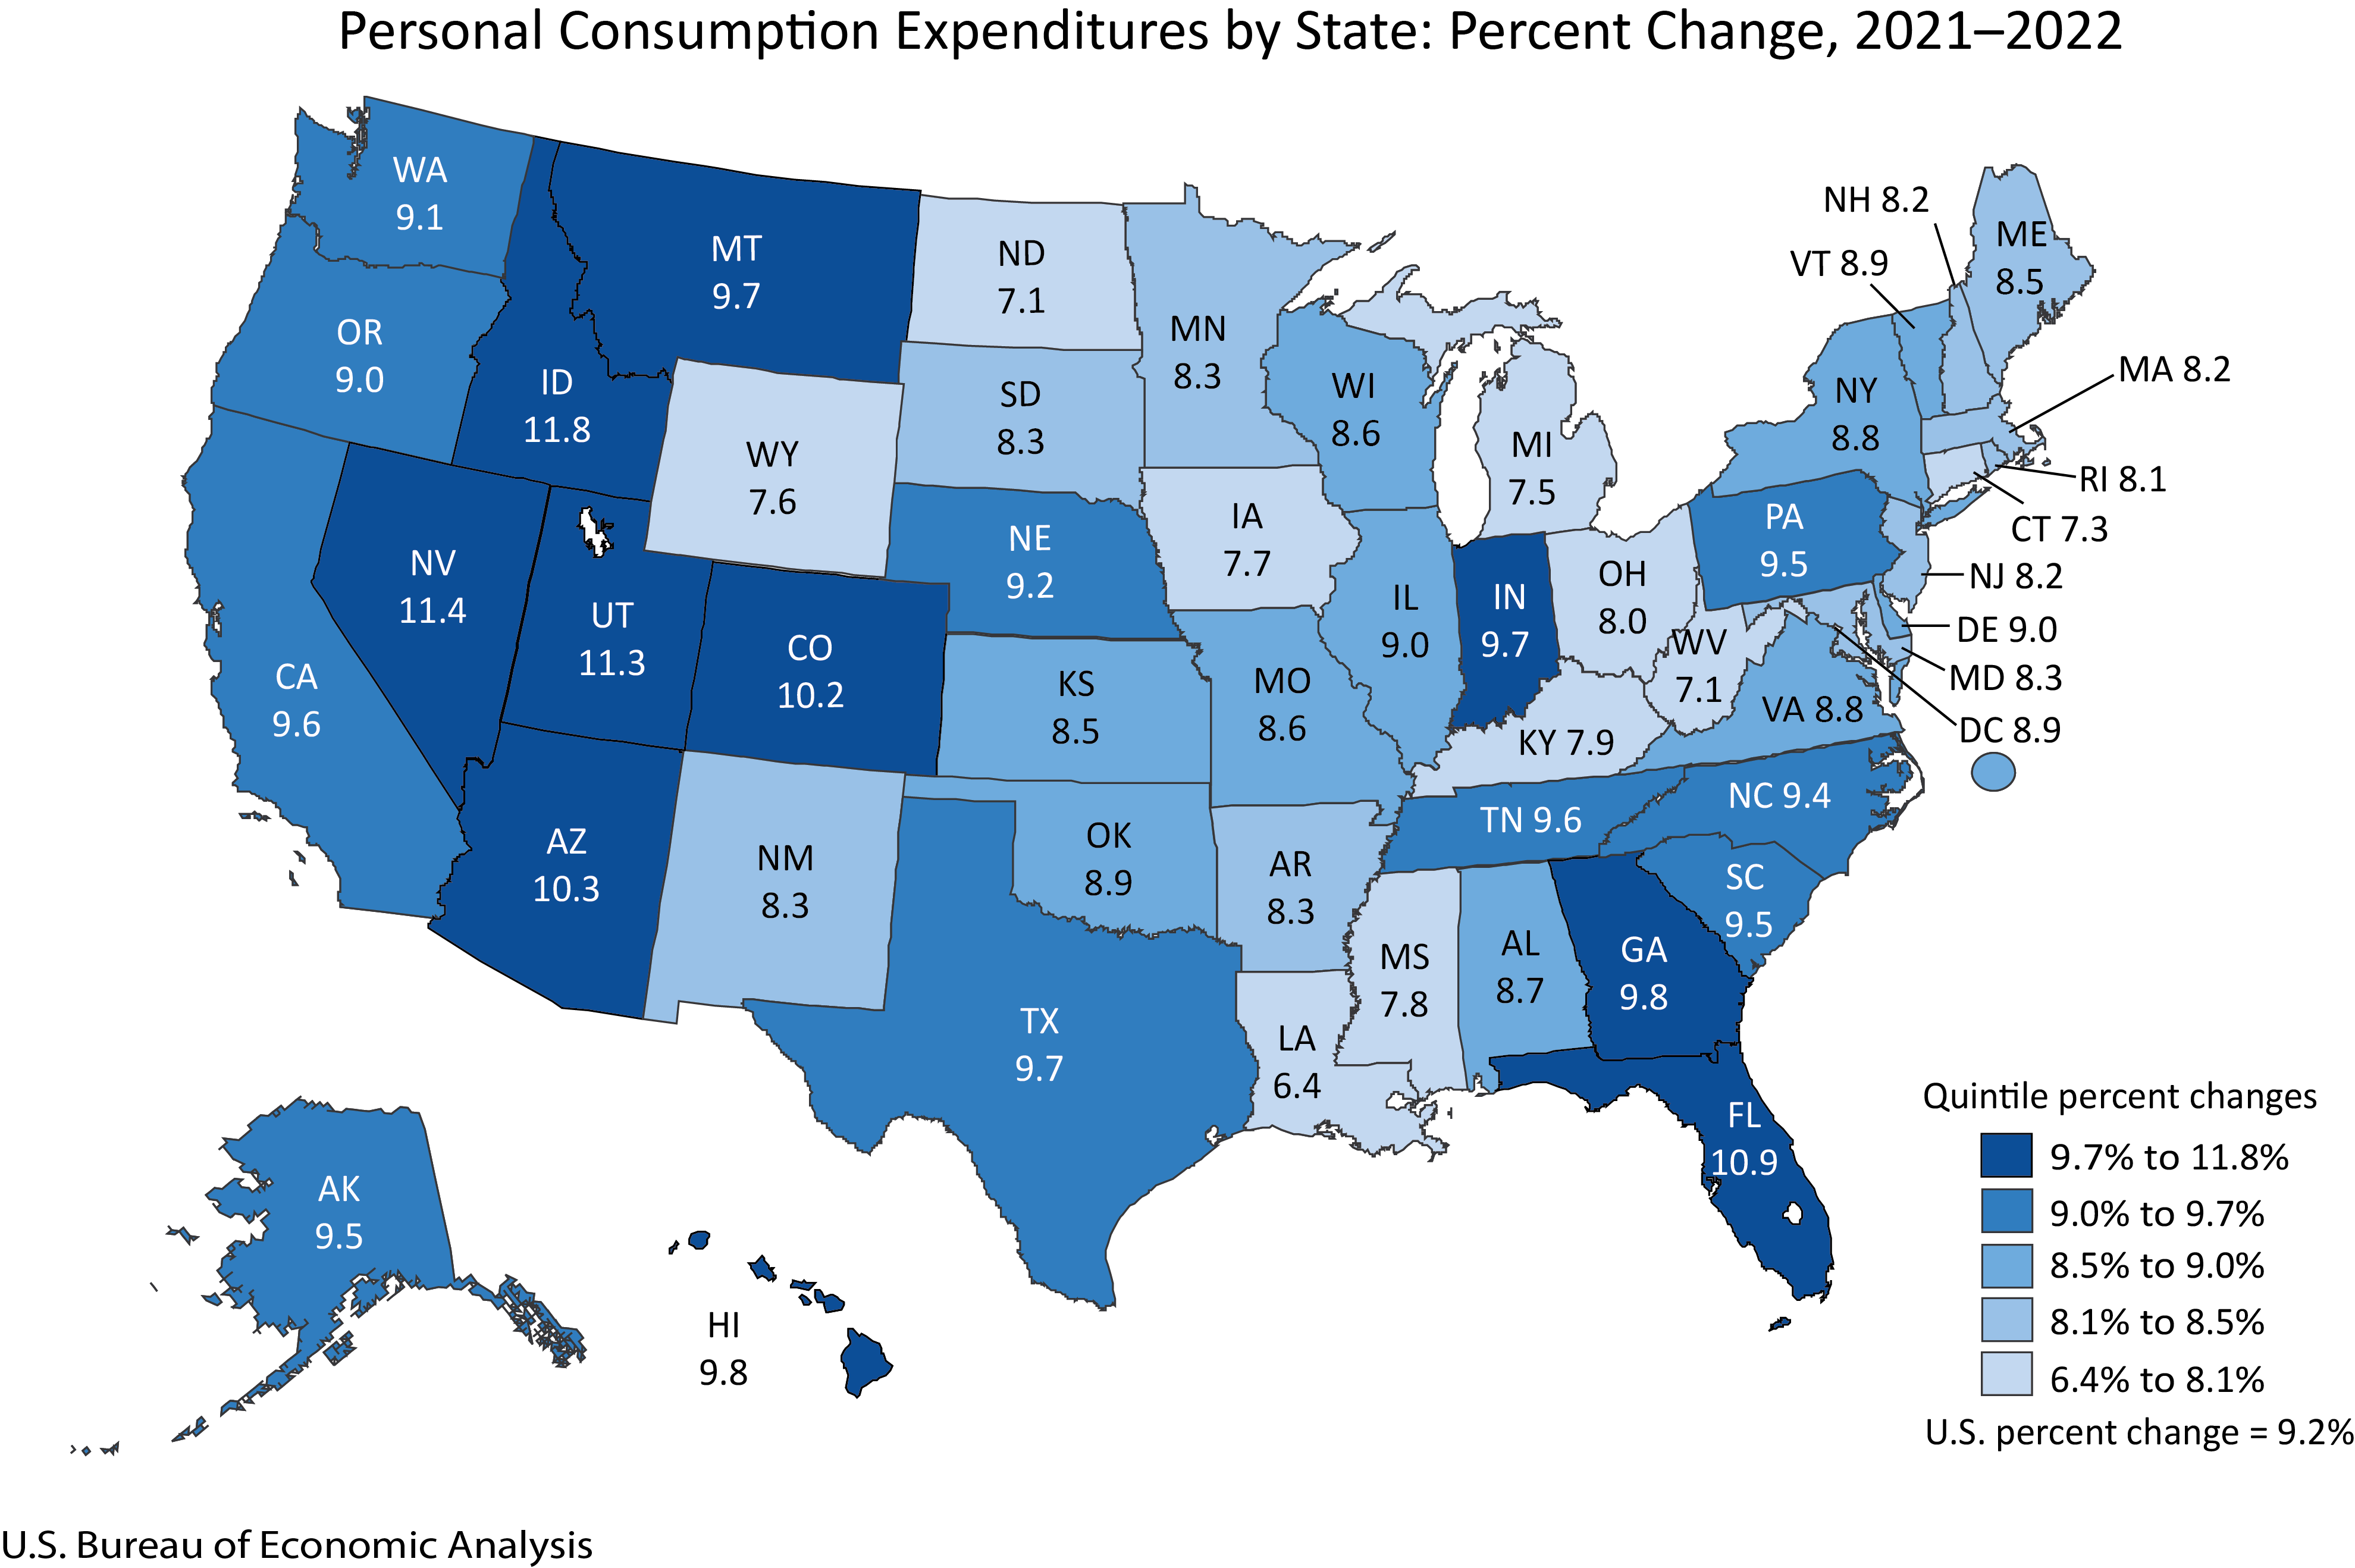
Nationally, personal consumption expenditures (PCE), in current dollars, increased 9.2 percent in 2022 after increasing 12.9 percent in 2021. PCE increased in all 50 states and the District of Columbia, with the percent change ranging from 11.8 percent in Idaho to 6.4 percent in Louisiana (table 1), according to statistics released today by the U.S. Bureau of Economic Analysis (BEA).
PCE by state highlights
Expenditures on housing and utilities, food services and accommodations, and health care were the largest contributors to the increase nationally (table 3).
- Housing and utilities increased 7.9 percent nationally (table 2) and was the largest contributor to increases in the District of Columbia and 29 states, including Idaho, Nevada, and Utah, the states with the largest increases in PCE.
- Food services and accommodations increased 17.6 percent nationally and was the largest contributor to increases in seven states.
- Health care increased 5.6 percent nationally and was the largest contributor to increases in nine states.
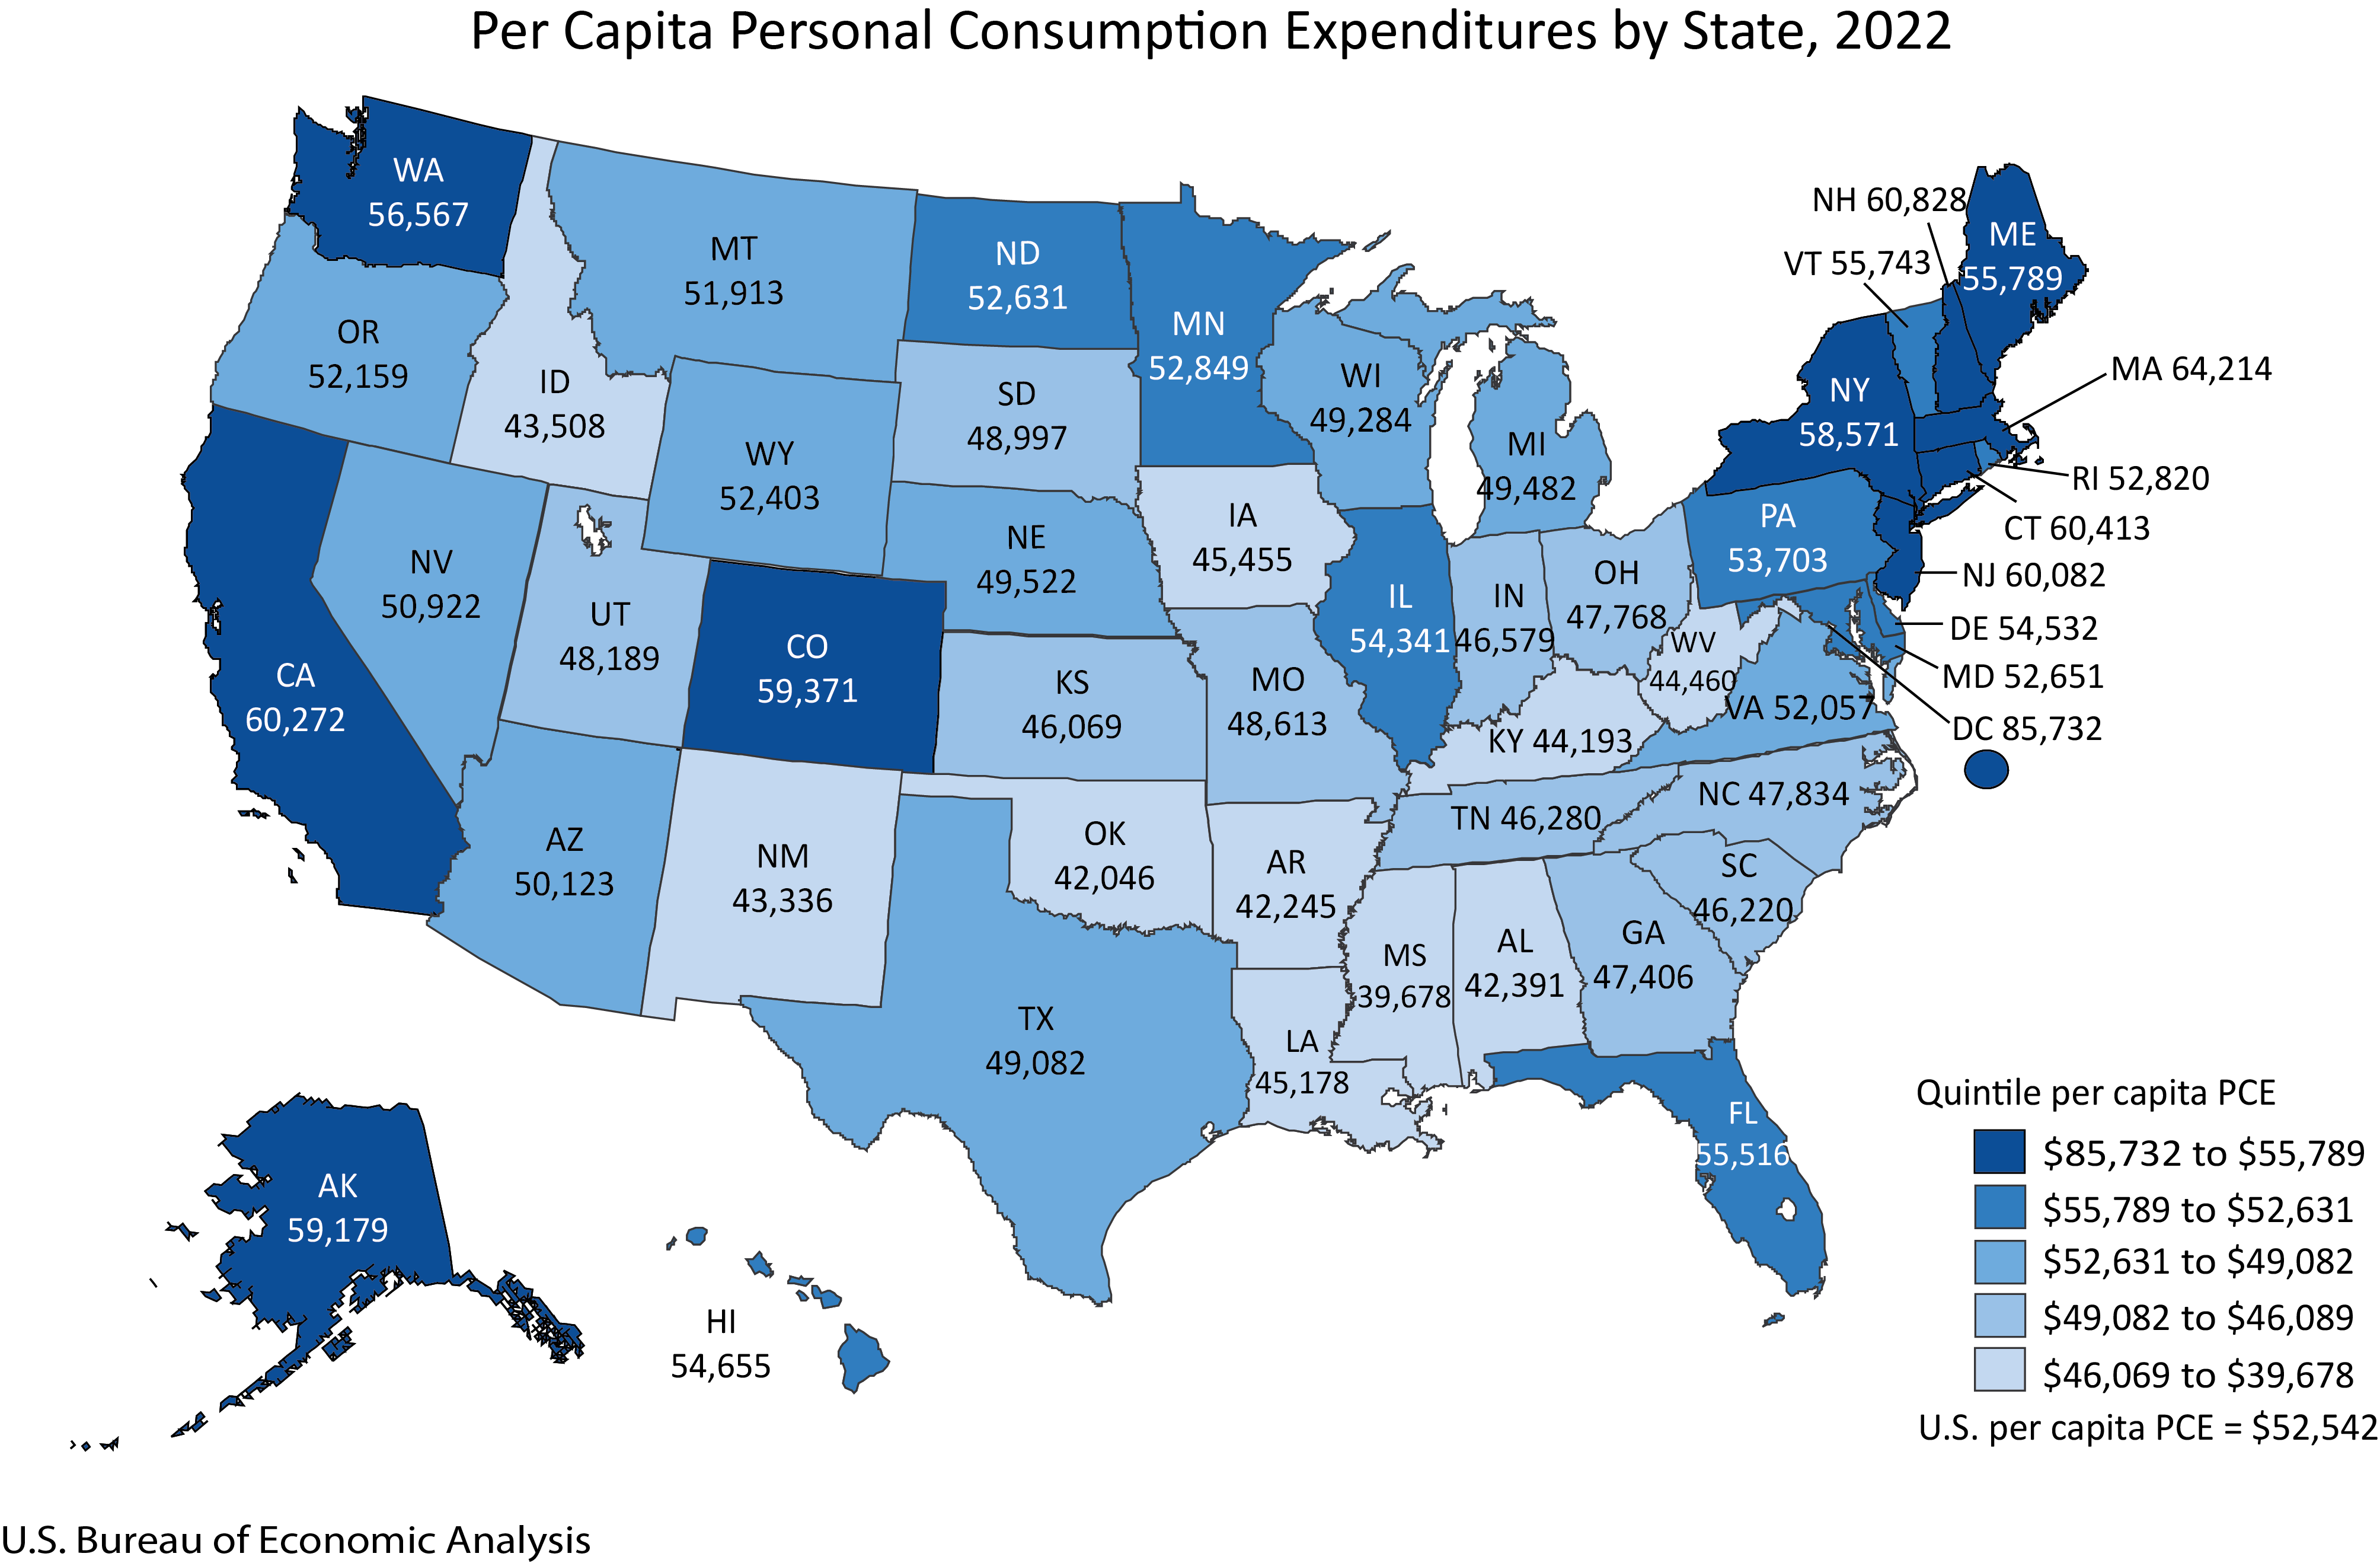
Across all states and the District of Columbia, per capita PCE increased to $52,542 in 2022 from $48,318 in 2021 (table 4). Per capita PCE by state ranged from a high of $64,214 in Massachusetts to a low of $39,678 in Mississippi. Per capita PCE in the District of Columbia was $85,732.
Annual update of PCE by state
The estimates for 2022 incorporate the results of BEA’s comprehensive update of PCE by state that was also released today. The annual estimates of PCE by state for 1997 to 2021 were revised. The update incorporates new and revised source data that are more complete and more detailed than previously available: the results of the September 28, 2023, comprehensive update of the National Income and Product Accounts and the September 29, 2023, comprehensive update of state personal income statistics. Our online journal, the Survey of Current Business, is scheduled to publish an article in November describing these results.
BEA also released revised estimates of per capita PCE for 1997 through 2021. BEA used U.S. Census Bureau (Census) population figures to calculate per capita PCE estimates for 1997 to 2009 and 2020 through 2022. For 2010 to 2019 per capita estimates, BEA used intercensal population figures that it developed based on Census methodology until Census releases its official intercensal population figures based on the 2020 decennial counts. See “Note on Per Capita Personal Consumption Expenditures and Population.”
Next release: October 3, 2024
Personal Consumption Expenditures by State, 2023
[ad_2]