Physiological Responses Revealed Static Magnetic Fields Potentially Improving the Tolerance of Poplar Seedlings to Salt Stress
Author Contributions
Conceptualization, J.H. and H.Z.; methodology, J.H.; software, N.W.; validation, W.H., S.M. and N.W.; formal analysis, W.H.; data curation, J.H.; writing—original draft preparation, J.H.; writing—review and editing, Y.W.; supervision, H.Z.; project administration, F.M. and H.T.; funding acquisition, Y.W. All authors have read and agreed to the published version of the manuscript.
Figure 1.
Effects of static magnetic field (SMF) and long-term 100 mM NaCl (LT) treatments on the growth of poplar (Populus × deltoides ‘Lulin-2’) seedlings (N = 30). (a) Morphological traits of poplar seedlings after different treatments. Effect of SMF on seedling root length (b), (c) increased root length of seedling under different treatment and (d) fresh weight of seedling roots after salt treatment. The increased root length is the difference between the final root length of each treatment group (b) and the initial root length before treatment. Different lower-case letters indicate significant difference (p < 0.05), and results are expressed as mean ± SE.
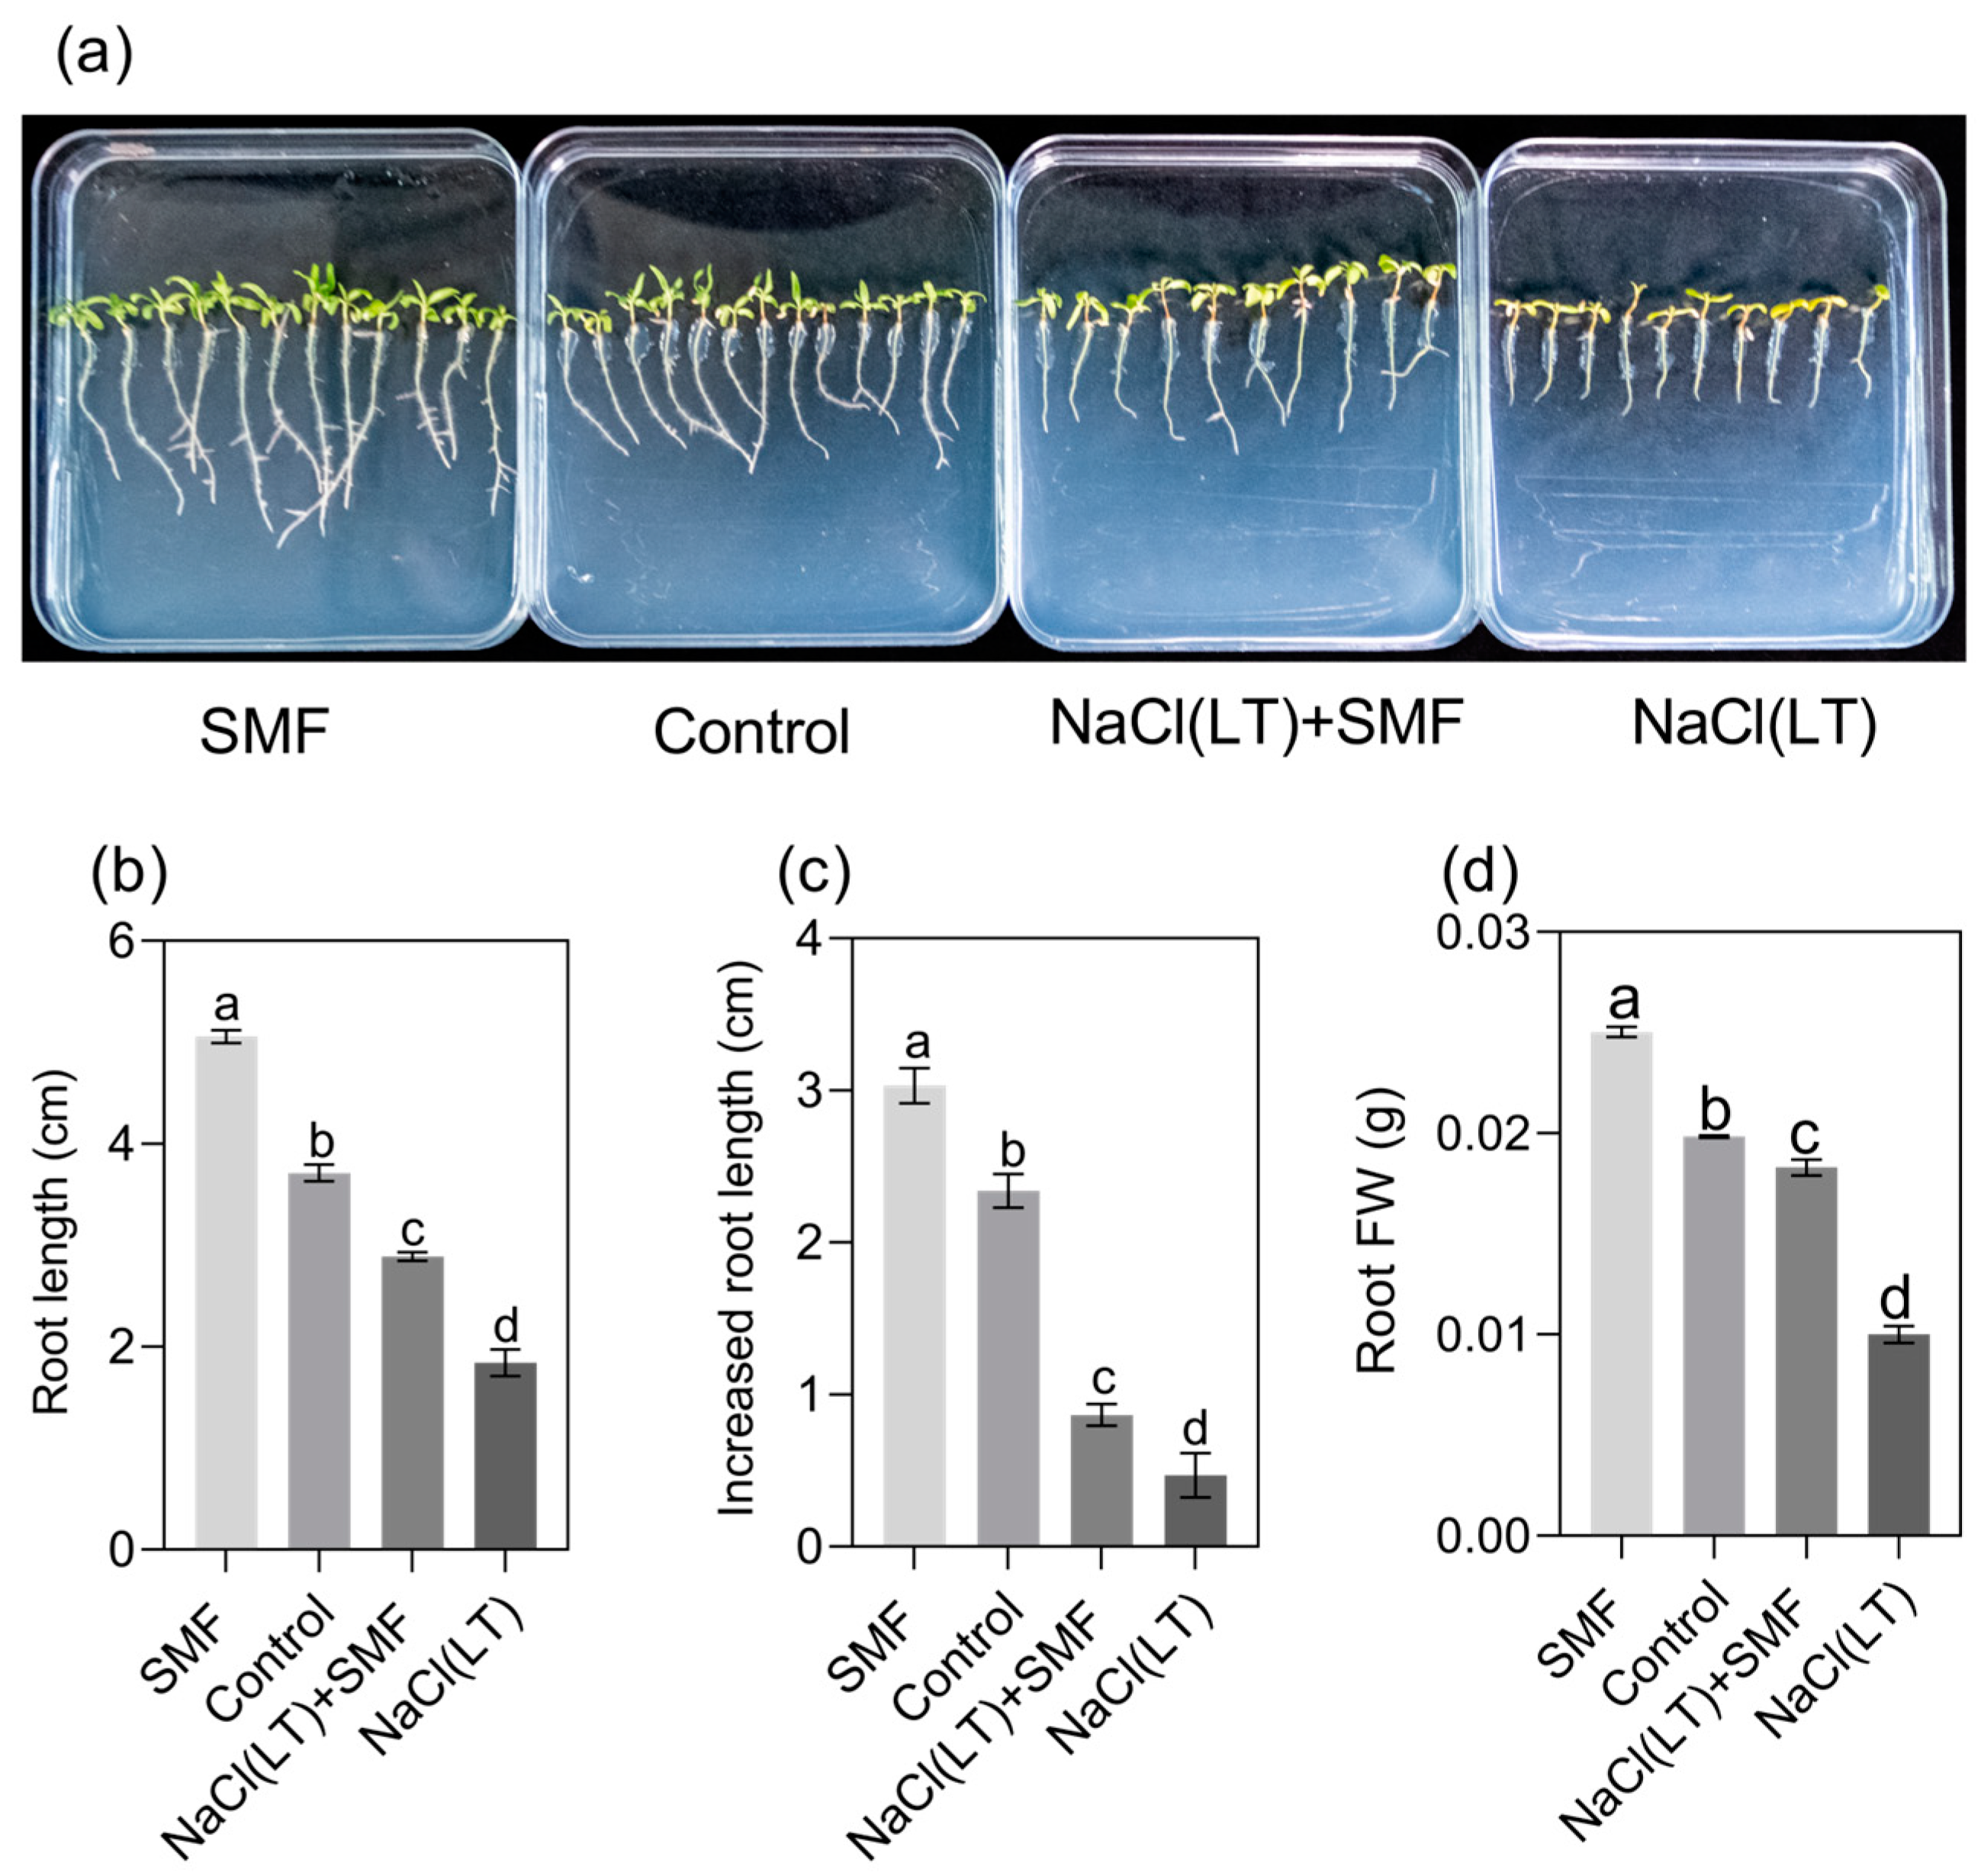
Figure 2.
Levels of cytoplasmic free Ca2+ ([Ca2+]cyt) and reactive oxygen species (ROS) in poplar roots under salt stress and static magnetic field (SMF) treatment (N = 4~6). After SMF treatment, poplar seedlings were treated with short-term NaCl (100 mM NaCl for 24 h) or NaCl shock (100 mM or 400 mM NaCl for 10 min). (a) The relative fluorescence intensity of [Ca2+]cyt. Root samples were impregnated with Ca2+-specific fluorescent probe Rhod-2 AM and incubated for 30 min. (b) Relative fluorescence intensity of ROS. Root samples were impregnated with ROS-specific fluorescent probe H2DCF-DA and incubated for 5 min. Each data point represents mean ± SE. Asterisks in (a,b) indicate significant differences between groups treated with SMF (+SMF) and groups that did not receive SMF treatment (−SMF) (p < 0.05).
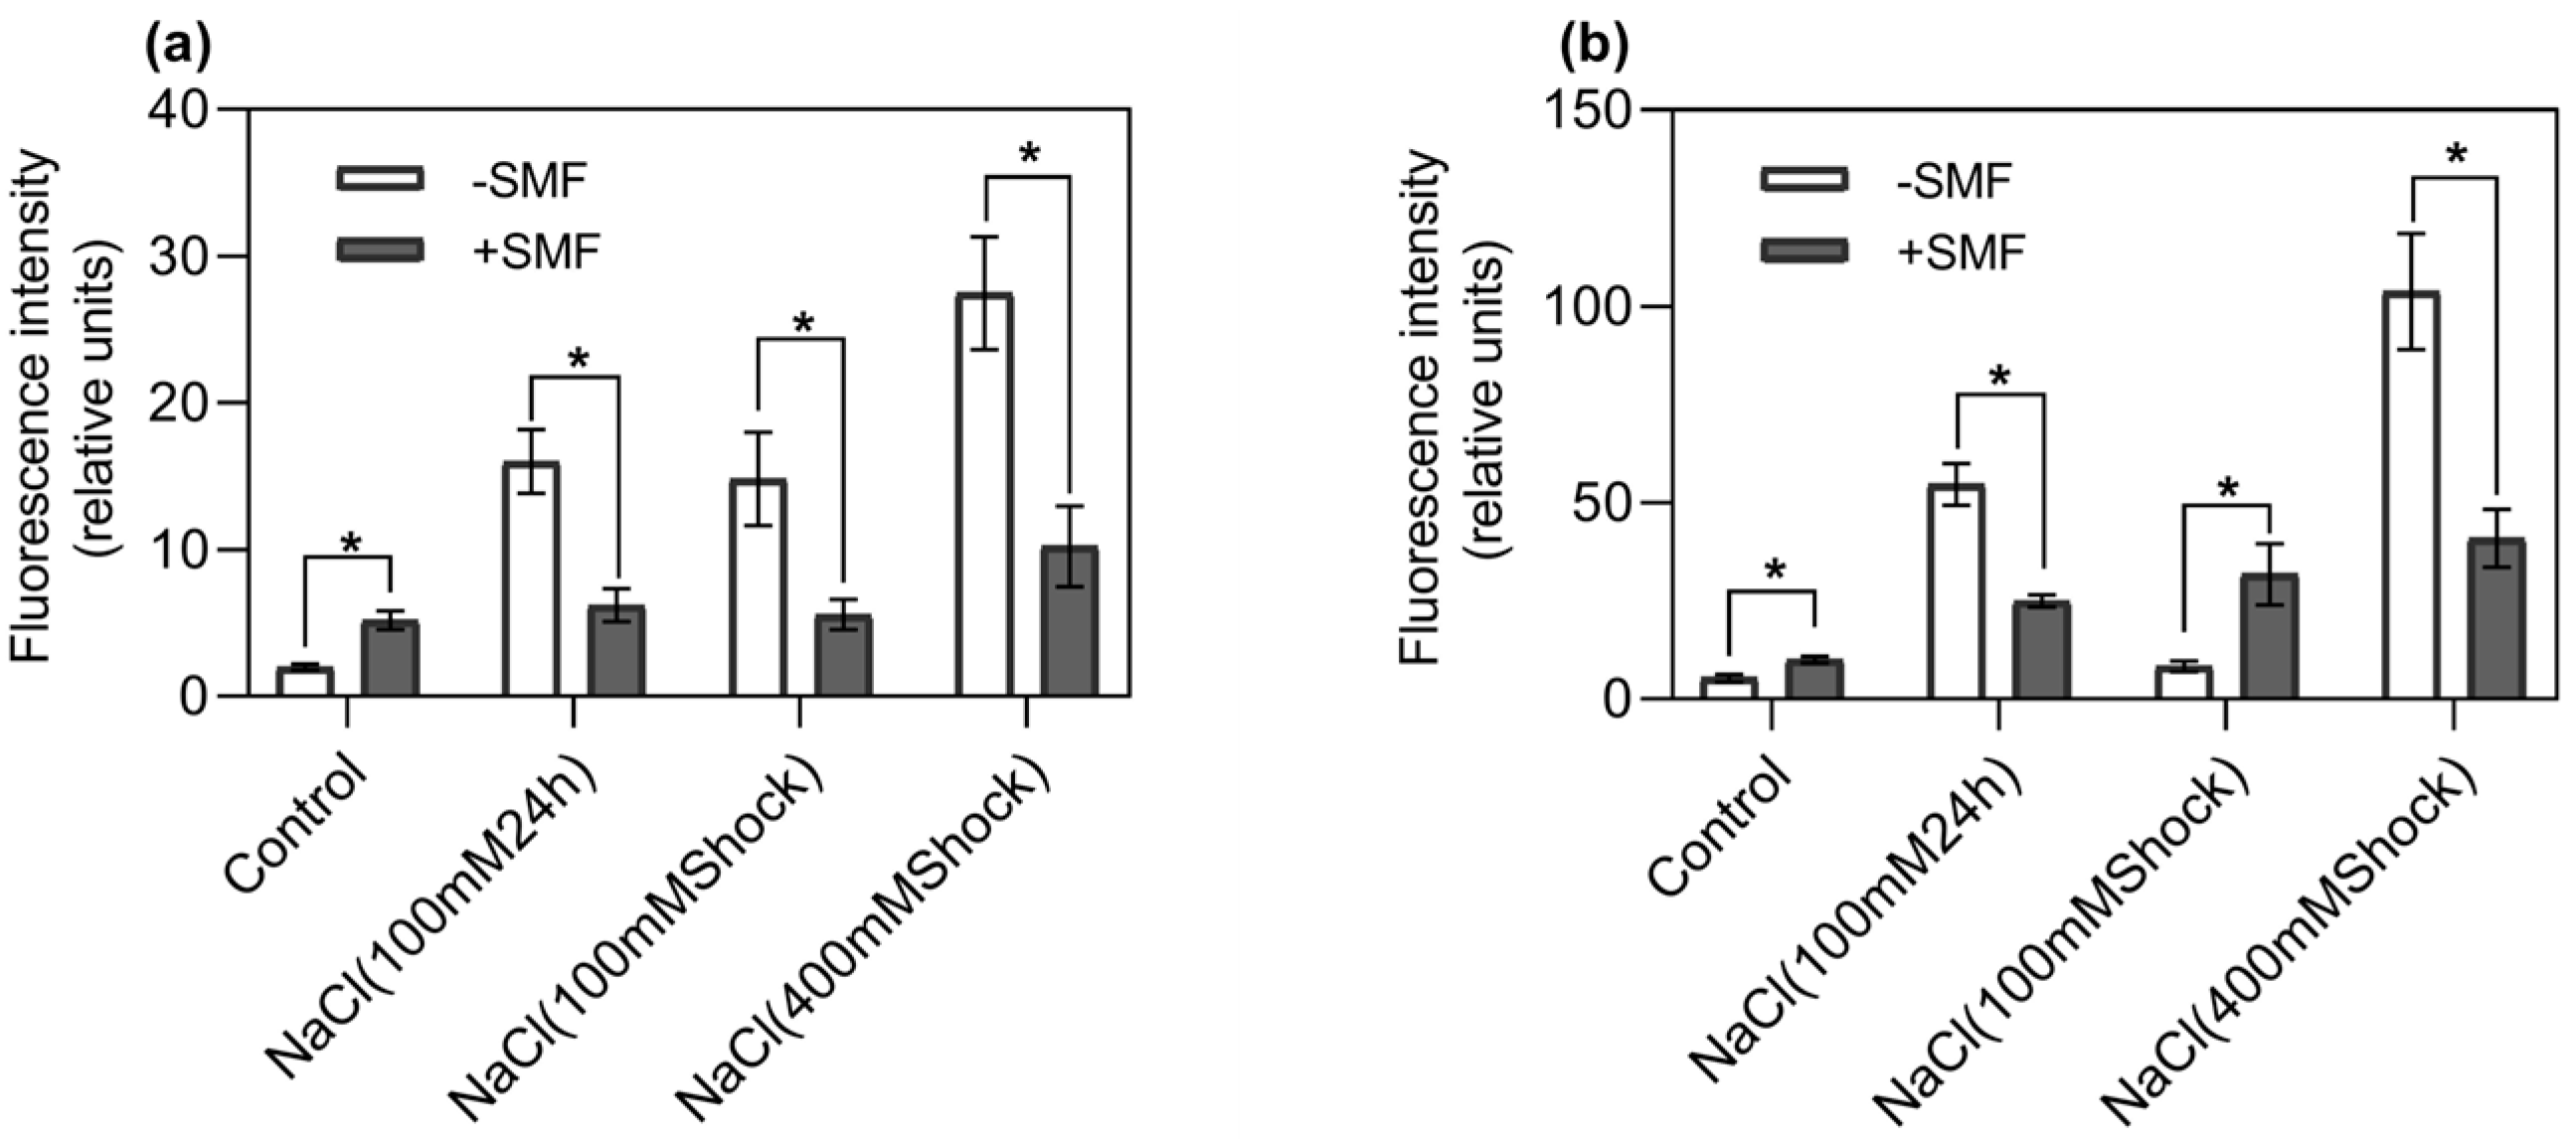
Figure 3.
Effects of static magnetic field (SMF) and long-term NaCl (LT) treatments on Na+, K+, Ca2+, K+/Na+, and Ca2+/Na+ in poplar roots (N = 4). Concentrations of Na+, K+, and Ca2+ are expressed as atomic mass fraction (%). (a) Na+ concentrations. (b) K+ concentrations. (c) Ca2+ concentrations. (d) K+/Na+ ratio. (e) Ca2+/Na+ ratio. Different lowercase letters indicate significant difference (p < 0.05), and results are expressed as mean ± SE.
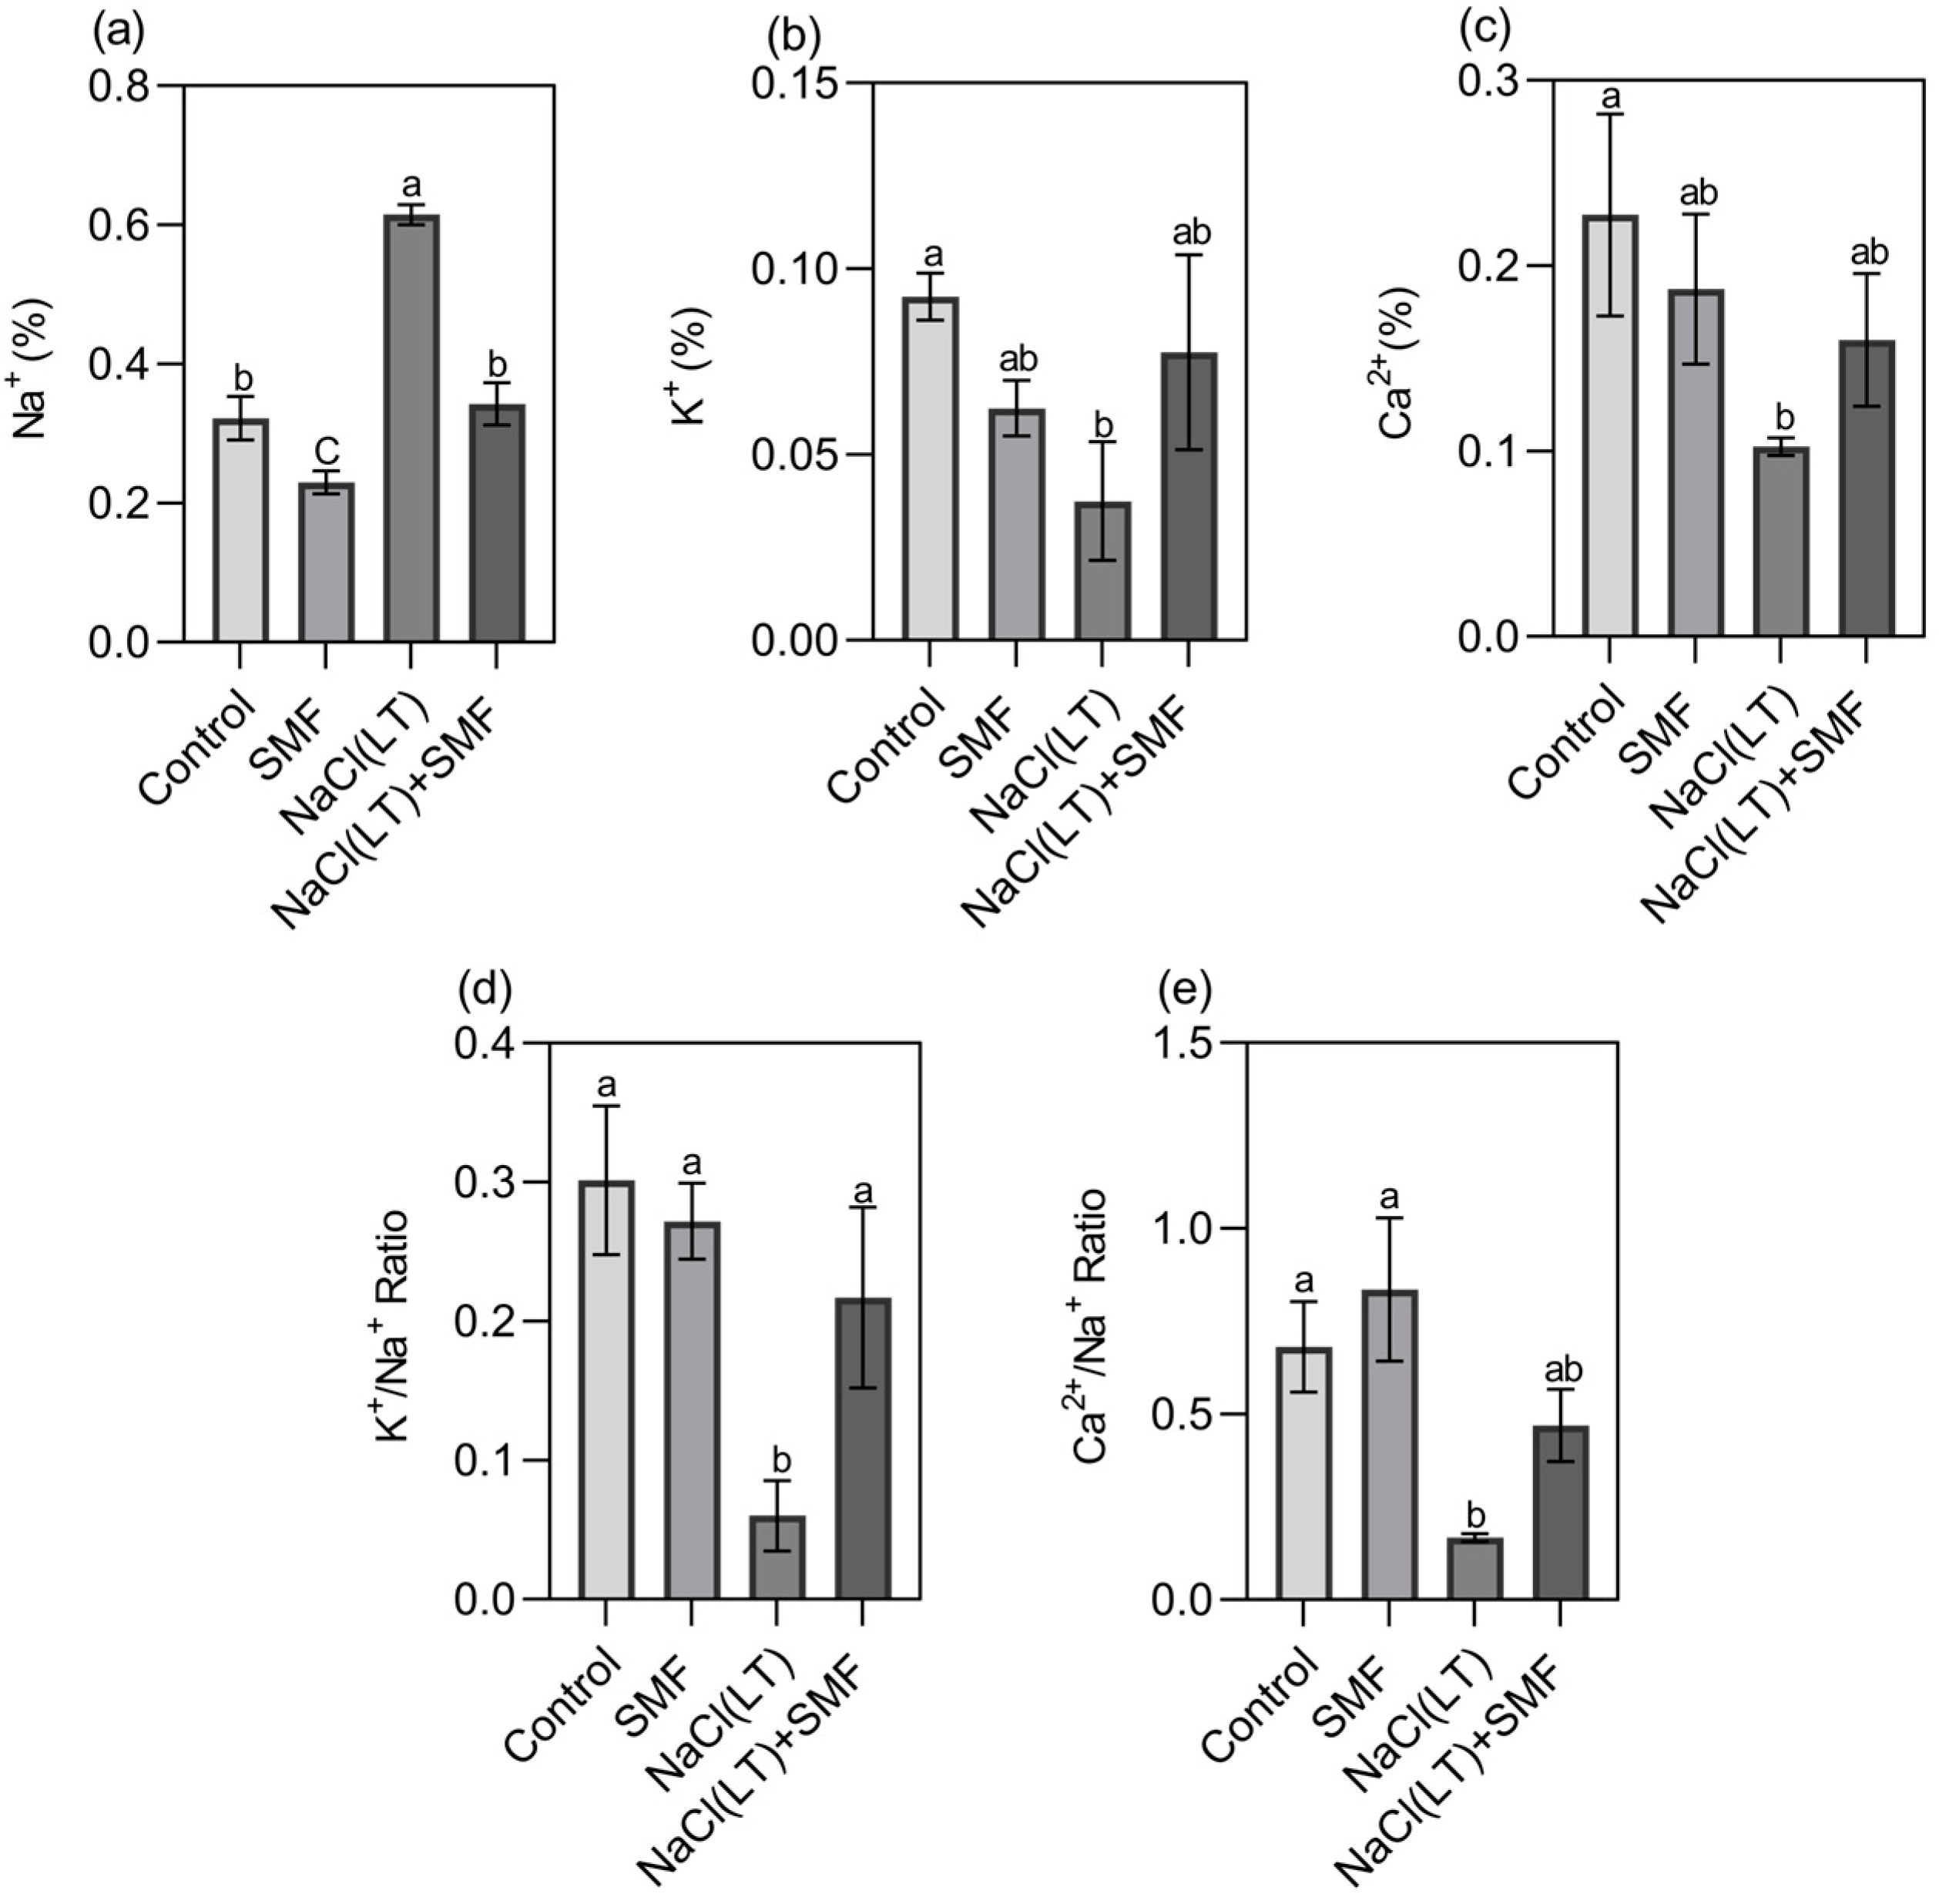
Figure 4.
Effects of static magnetic field (SMF) and NaCl treatments on Na+ flux in poplar seedling roots (N = 4~6). (a) Net Na+ flux under short-term NaCl (ST) treatment (400 mM NaCl for 24 h). (b) Net Na+ flux under long-term NaCl (LT) treatment (100 mM NaCl for 7 d). (c,d) Net Na+ flux under NaCl (ST/LT) after one-week exposure to SMF. (e) Net Na+ flux under SMF treatment (exposure to SMF for 7 d). (f) Steady Na+ flux under SMF (+SMF) and no-SMF (−SMF) treatment in control, NaCl (ST) and NaCl (LT) groups. Steady Na+ flux was measured and averaged along root axes (0–2000 μm from the apex) at intervals of 50–400 μm. Asterisks indicate significant difference between treatments (p < 0.05), and results are expressed as mean ± SE.
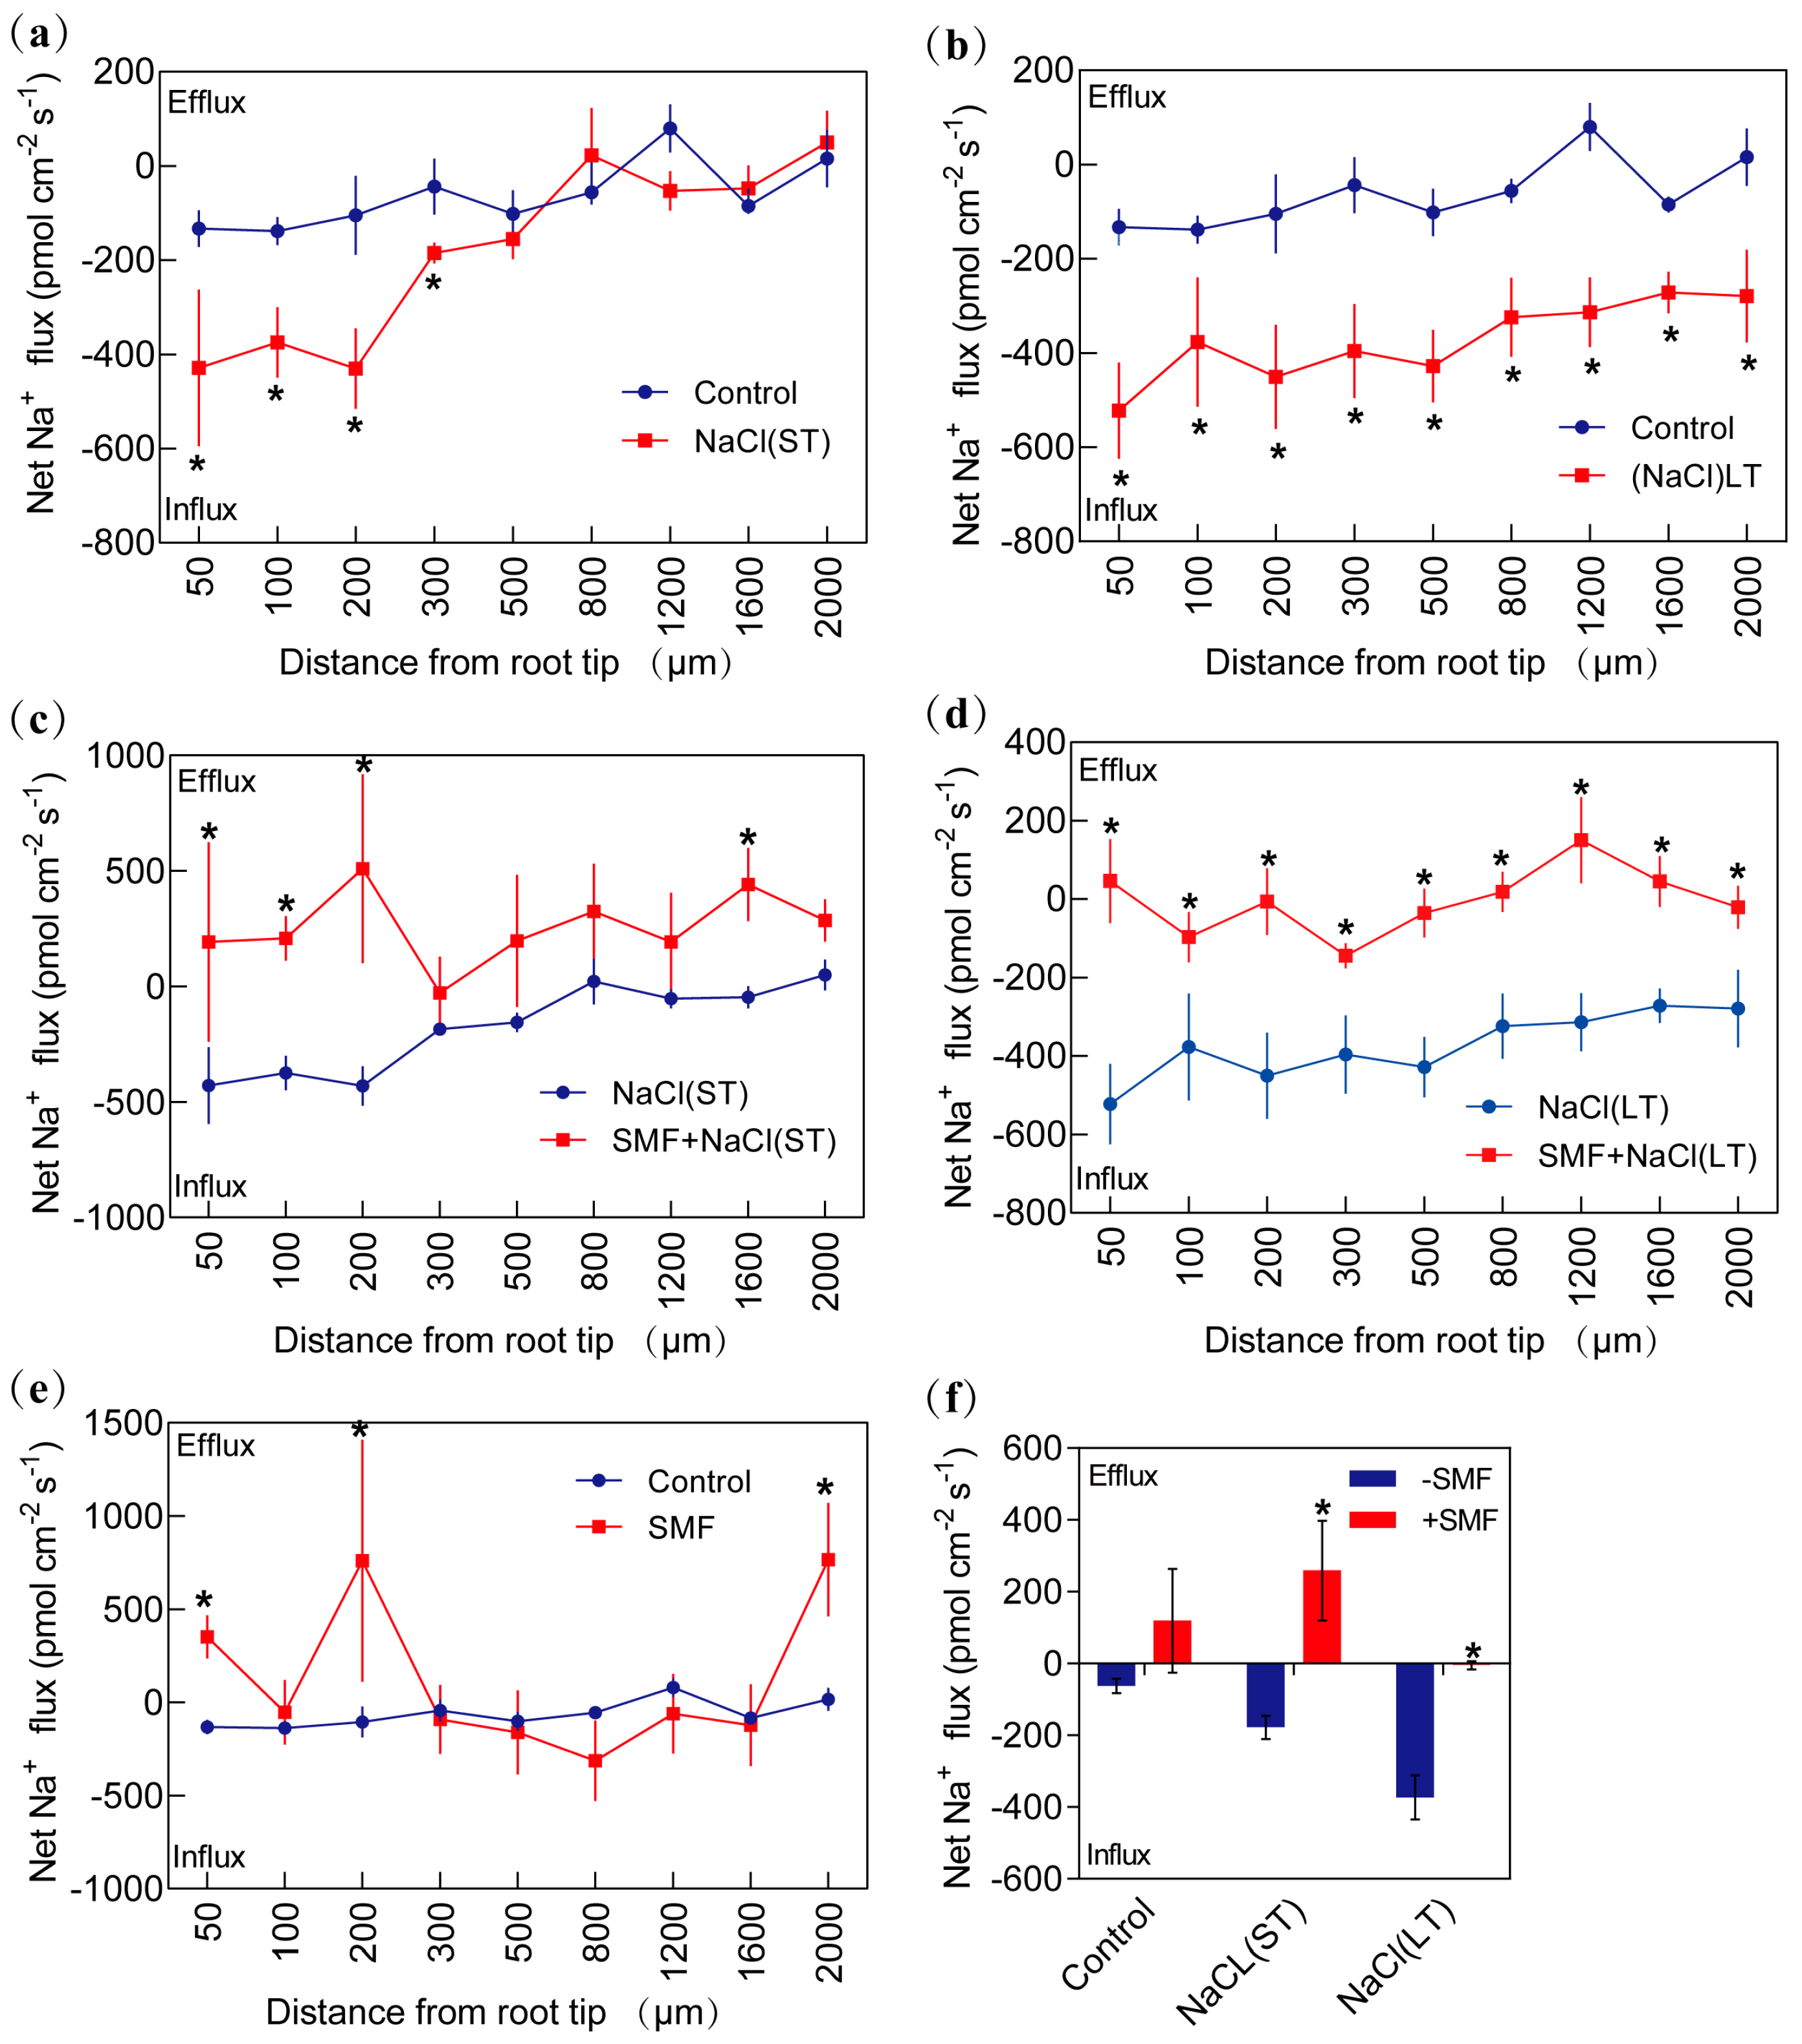
Figure 5.
Effects of pharmacological agents on net fluxes of Na+, H+, K+, and Ca2+ in NaCl and static magnetic field (SMF) treatments (N = 3~4). (a) before measuring Na+ flux, poplar roots were treated with 50 µM amiloride, 500 µM sodium orthovanadate, or 200 µM LaCl3 for 30 min. (b) before measuring H+ flux, poplar roots were treated with 500 µM sodium orthovanadate or 50 µM amiloride for 30 min. (c) before measuring Ca2+ flux, poplar roots were treated with 200 µM LaCl3 for 30 min. (d) before measuring H+ flux, poplar roots were treated with 50 µM TEA or 500 µM sodium orthovanadate for 30 min. Net flux was measured for a duration of 5–15 min. Different lowercase letters indicate significant difference (p < 0.05), and results are expressed as mean ± SE.
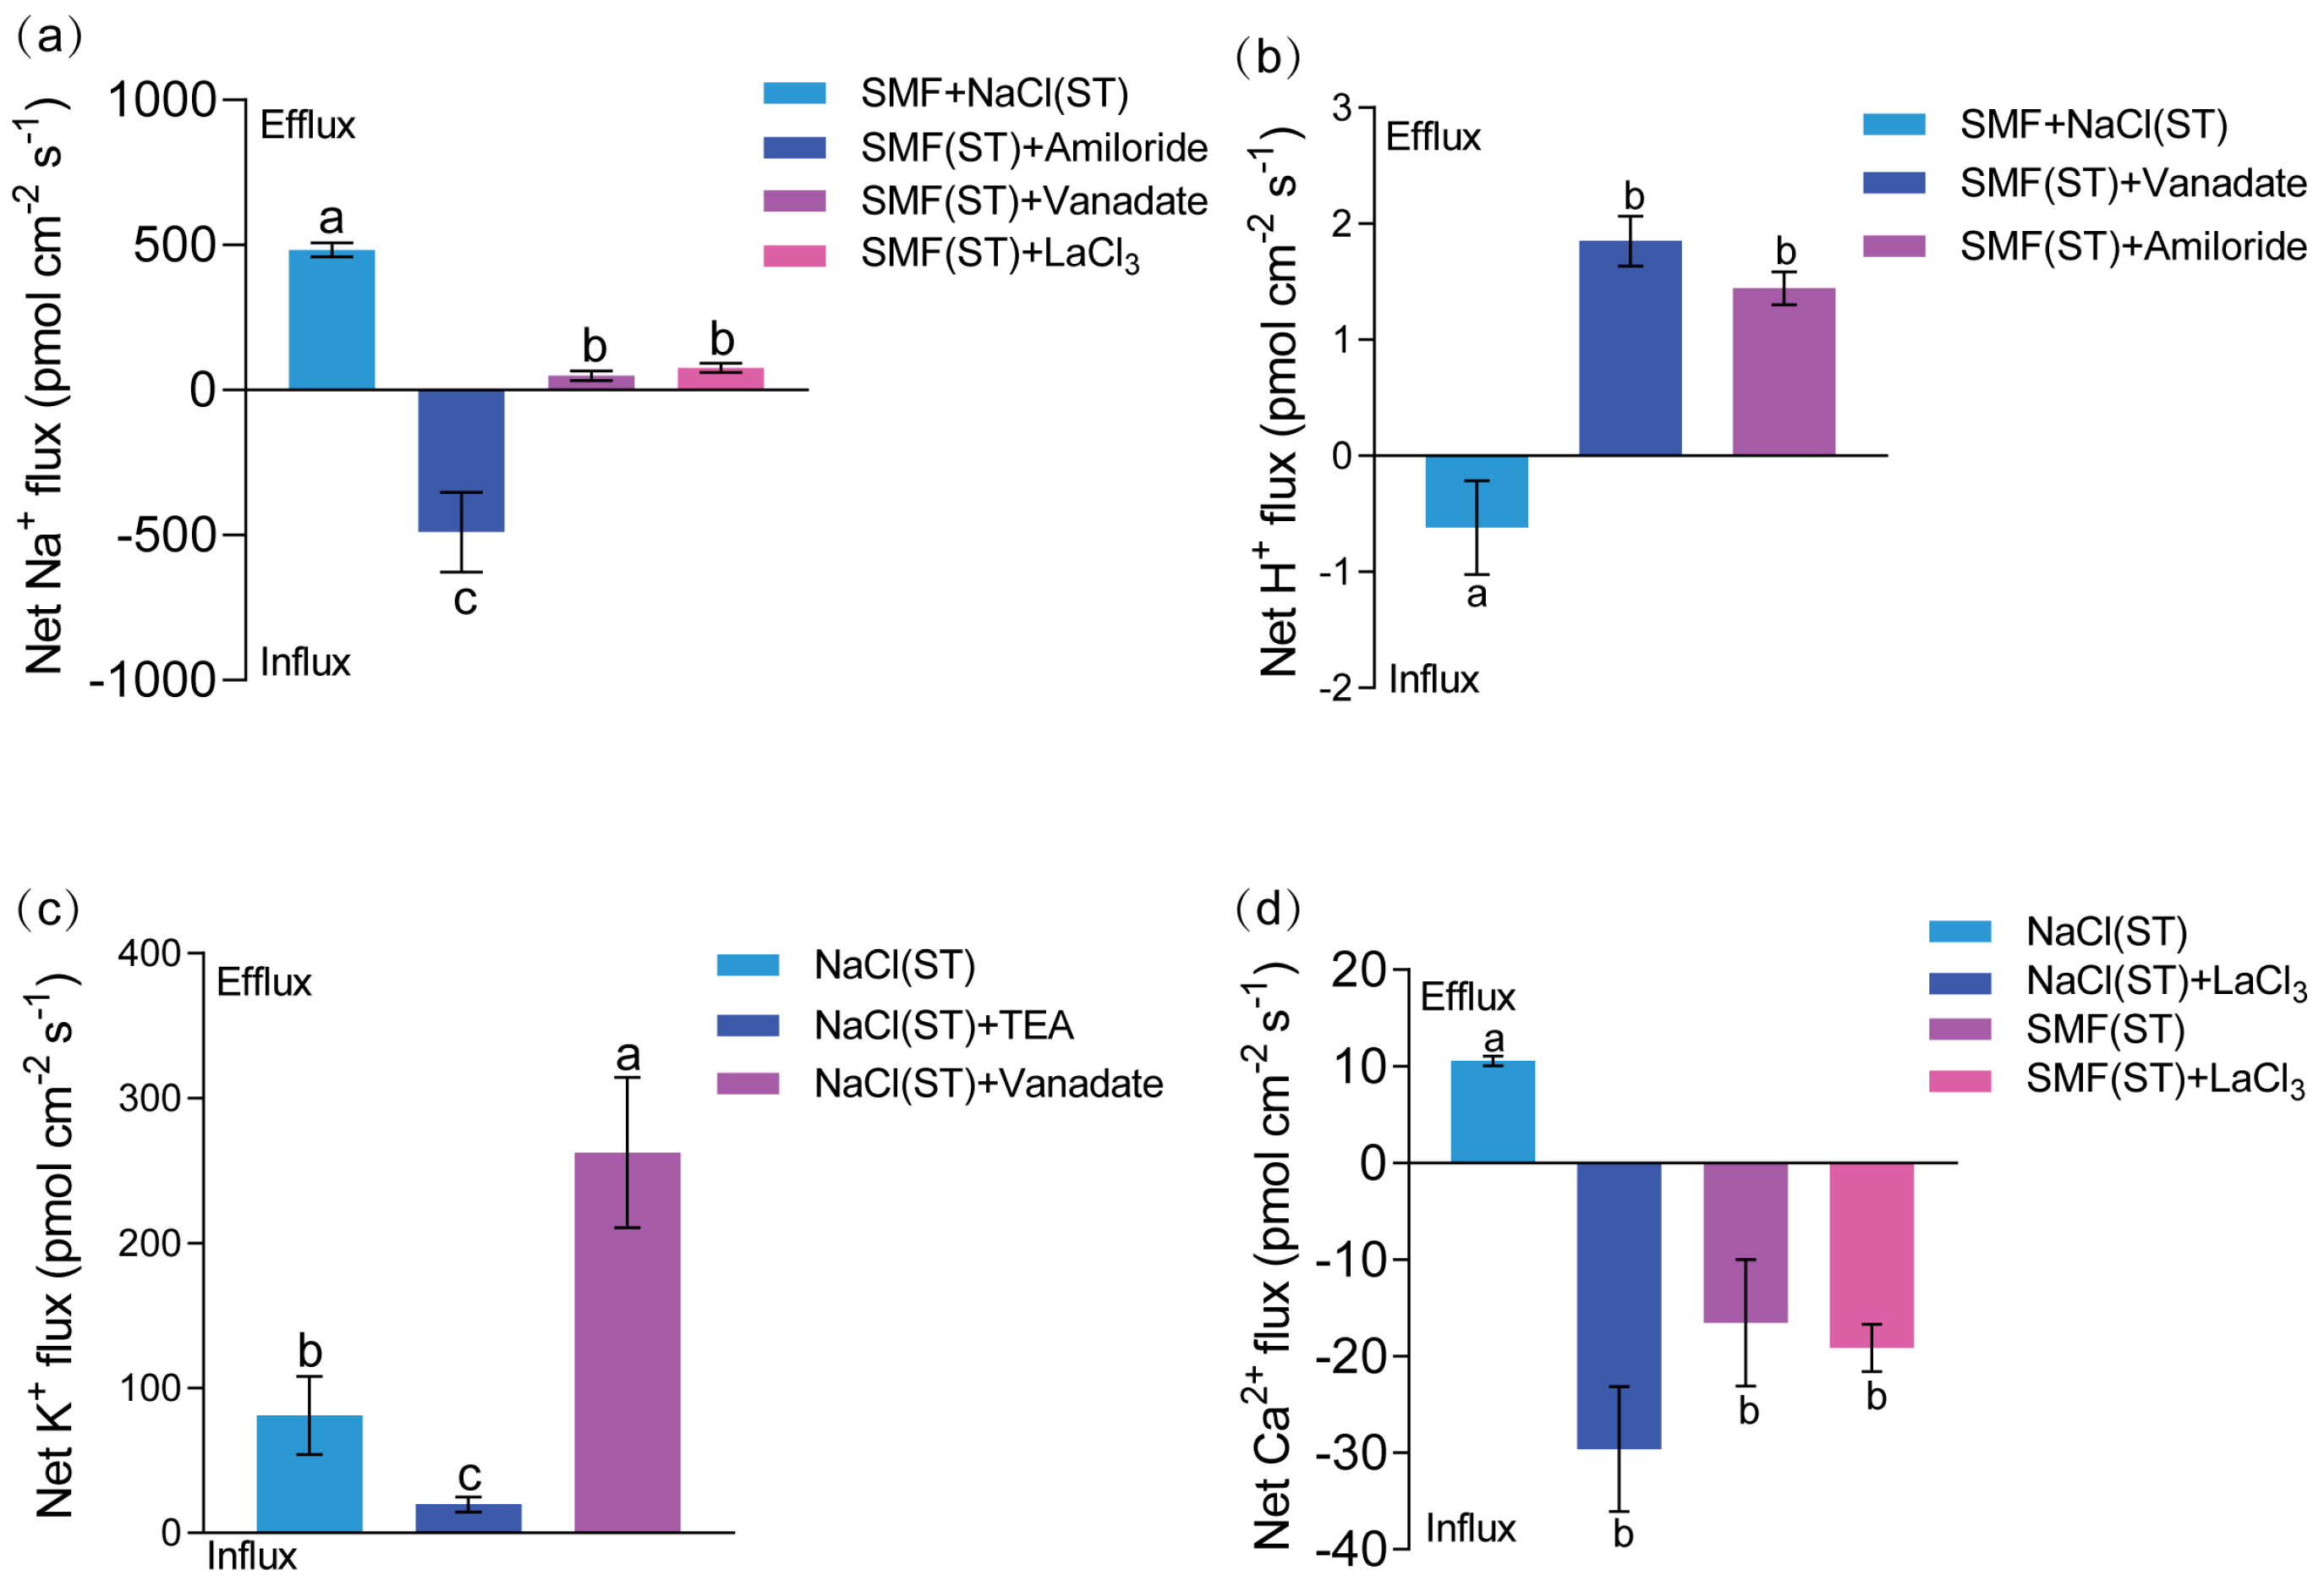
Figure 6.
Effects of static magnetic field (SMF) and NaCl treatments on H+ flux in poplar seedling roots (N = 4~6). (a) Net H+ flux under short-term NaCl (ST) treatment (400 mM NaCl for 24 h). (b) Net H+ flux under long-term NaCl (LT) treatment (100 mM NaCl for 7 d). (c,d) Net H+ flux under NaCl (ST/LT) after one-week exposure to SMF. (e) Net H+ flux under SMF treatment (exposure to SMF for 7 d). (f) Steady H+ flux under SMF (+SMF) and no-SMF (−SMF) treatment in control, NaCl (ST) and NaCl (LT) groups. Steady H+ flux was measured and averaged along root axes (0–2000 μm from the apex) at intervals of 50–400 μm. Asterisks indicate significant difference between treatments (p < 0.05), and results are expressed as mean ± SE.
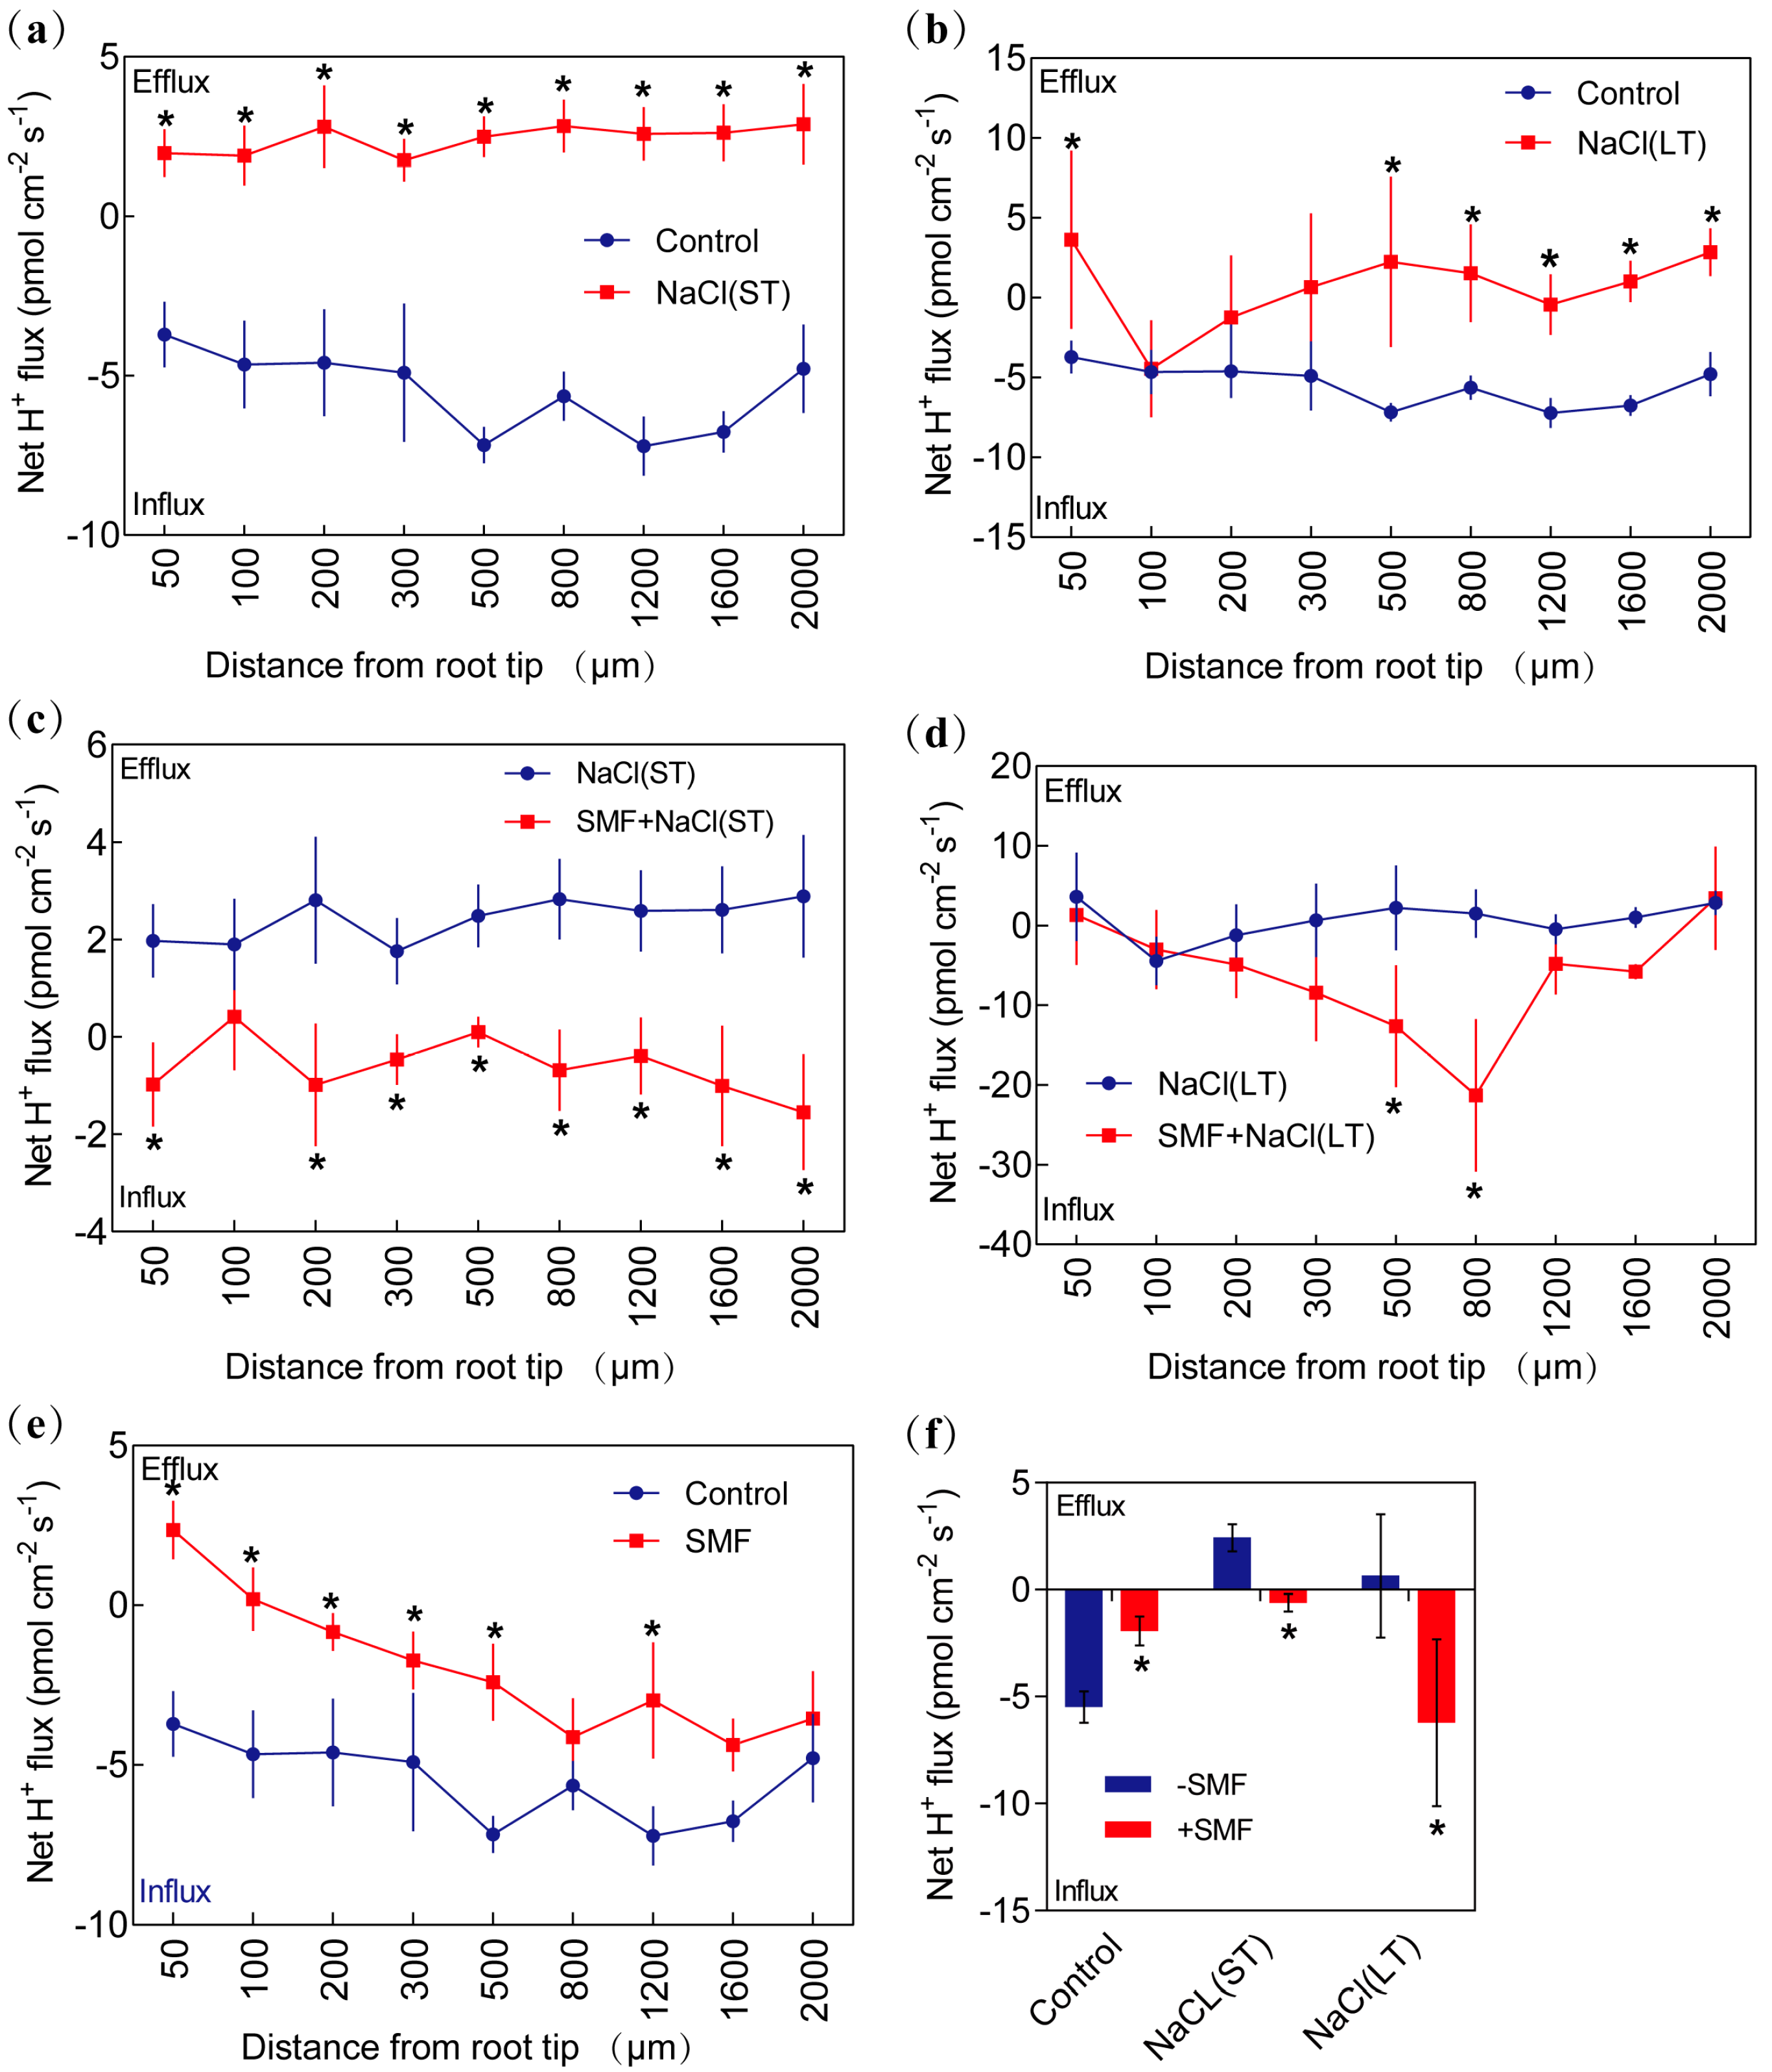
Figure 7.
Effects of static magnetic field (SMF) and NaCl treatments on K+ flux in poplar seedling roots (N = 4~6). (a) Net K+ flux under short-term NaCl (ST) treatment (400 mM NaCl for 24 h). (b) Net K+ flux under long-term NaCl (LT) treatment (100 mM NaCl for 7 d). (c,d) Net K+ flux under NaCl (ST/LT) after one-week exposure to SMF. (e) Net K+ flux under SMF treatment (exposure to SMF for 7 d). (f) Steady K+ flux under SMF (+SMF) and no-SMF (−SMF) treatment in control, NaCl (ST) and NaCl (LT) groups. Steady K+ flux was measured and averaged along root axes (0–2000 μm from the apex) at intervals of 50–400 μm. Asterisks indicate significant difference between treatments (p < 0.05), and results are expressed as mean ± SE.
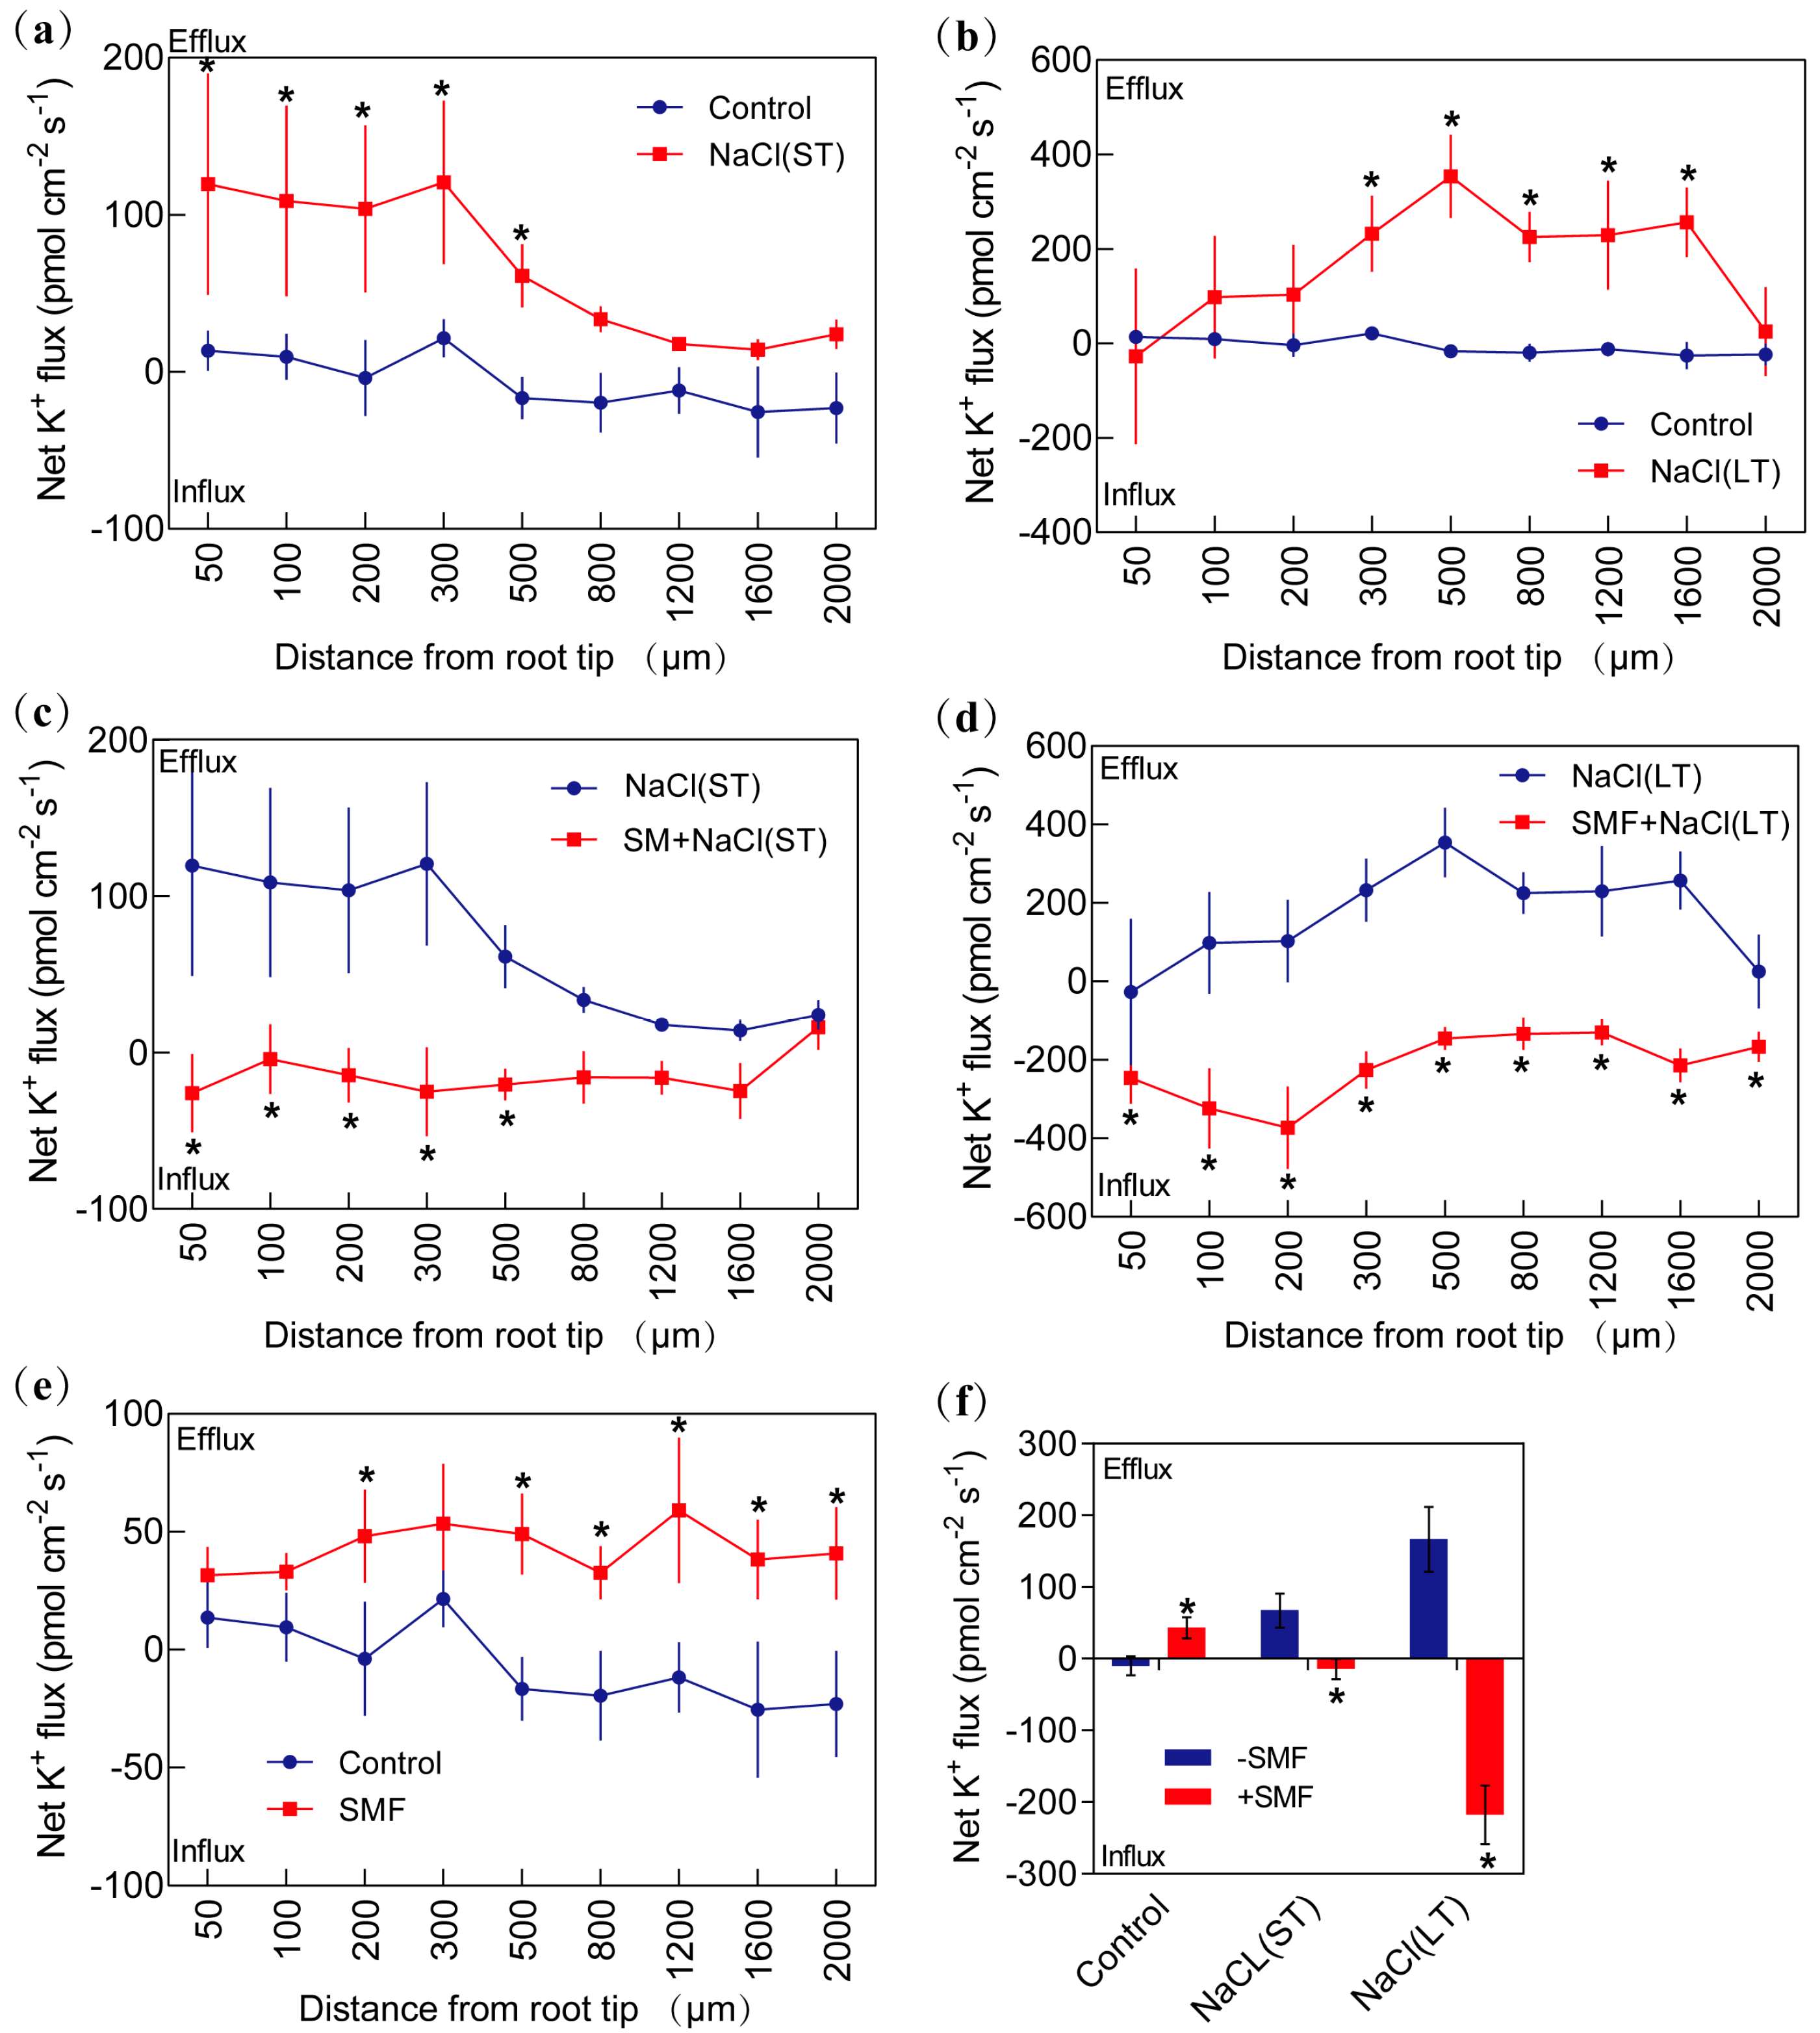
Figure 8.
Effects of static magnetic field (SMF) and NaCl treatments on Ca2+ flux in poplar seedling roots (N = 4~6). (a) Net Ca2+ flux under short-term NaCl (ST) treatment (400 mM NaCl for 24 h). (b) Net Ca2+ flux under long-term NaCl (LT) treatment (100 mM NaCl for 7 d). (c,d) Net Ca2+ flux under NaCl (ST/LT) after one-week exposure to SMF. (e) Net Ca2+ flux under SMF treatment (exposure to SMF for 7 d). (f) Steady Ca2+ flux under SMF (+SMF) and no-SMF (−SMF) treatment in control, NaCl (ST) and NaCl (LT) groups. Steady Ca2+ flux was measured and averaged along root axes (0–2000 μm from the apex) at intervals of 50–400 μm. Asterisks indicate significant difference between treatments (p < 0.05), and results are expressed as mean ± SE.
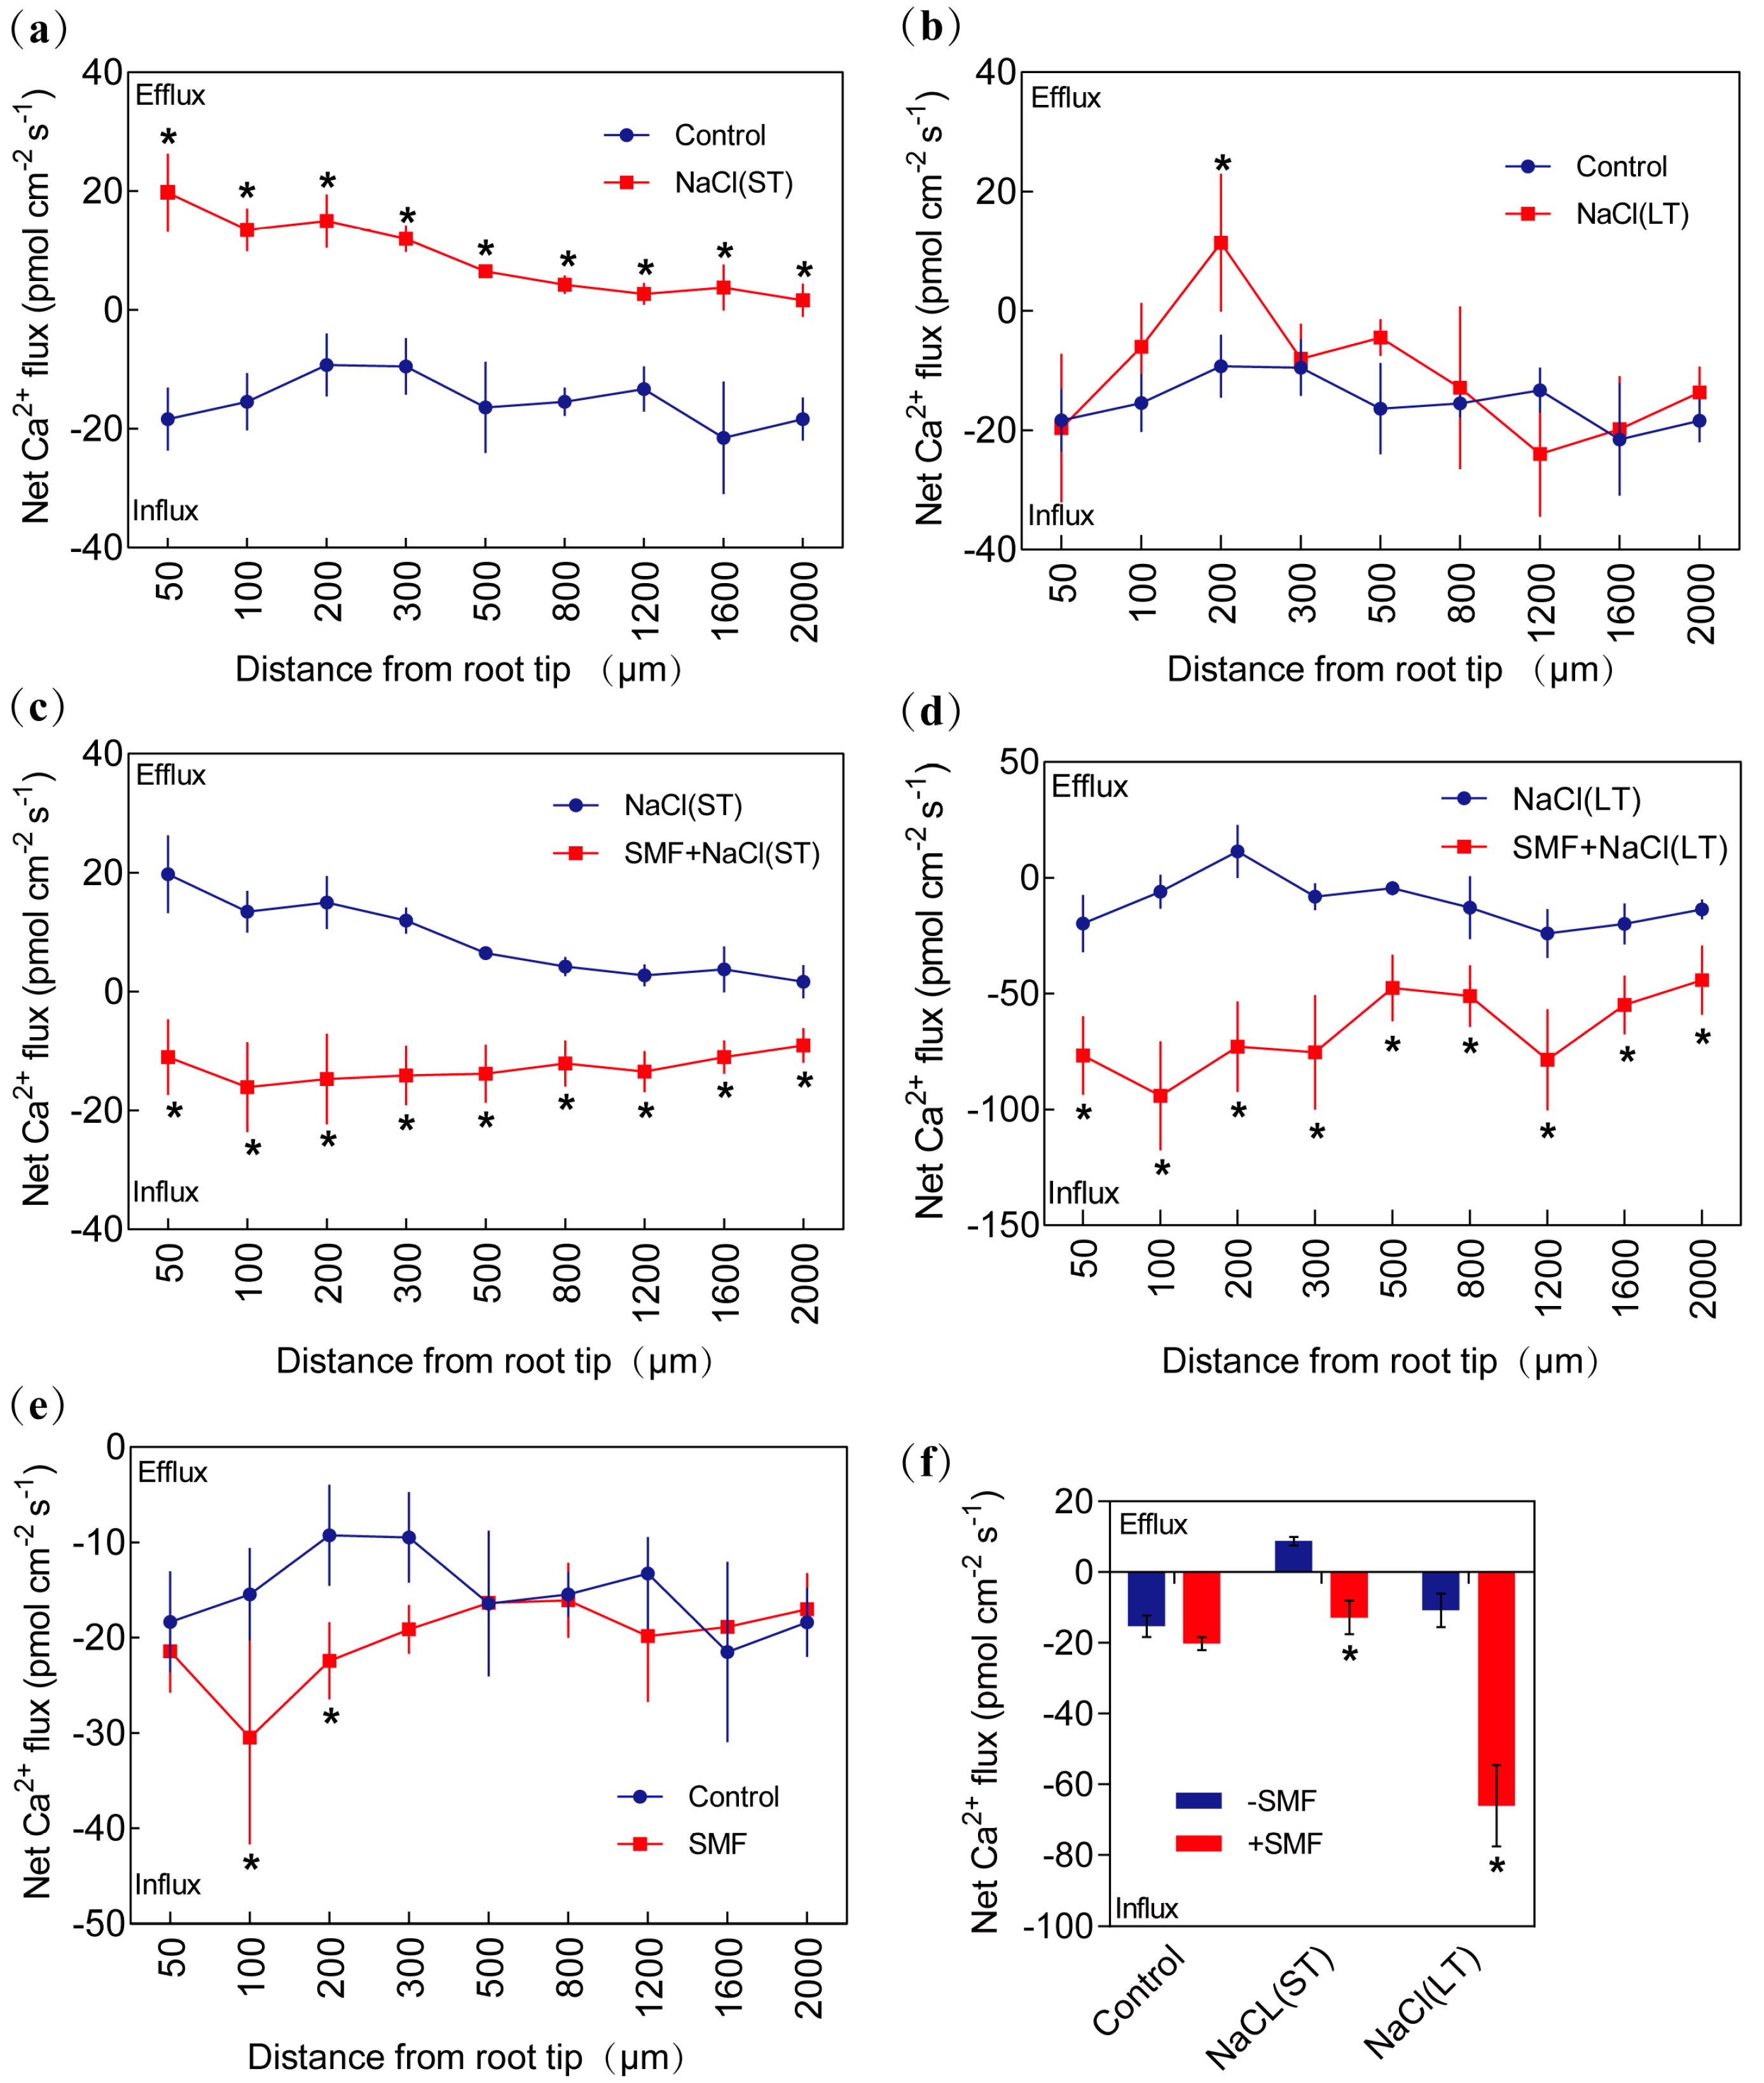
Figure 9.
Effects of static magnetic field (SMF) treatment on the expression of stress-responsive genes in poplar seedlings (N = 3). Asterisks indicate significant difference (* p < 0.05, ** p < 0.01, *** p < 0.001), and results are expressed as mean ± SE.
Figure 9.
Effects of static magnetic field (SMF) treatment on the expression of stress-responsive genes in poplar seedlings (N = 3). Asterisks indicate significant difference (* p < 0.05, ** p < 0.01, *** p < 0.001), and results are expressed as mean ± SE.
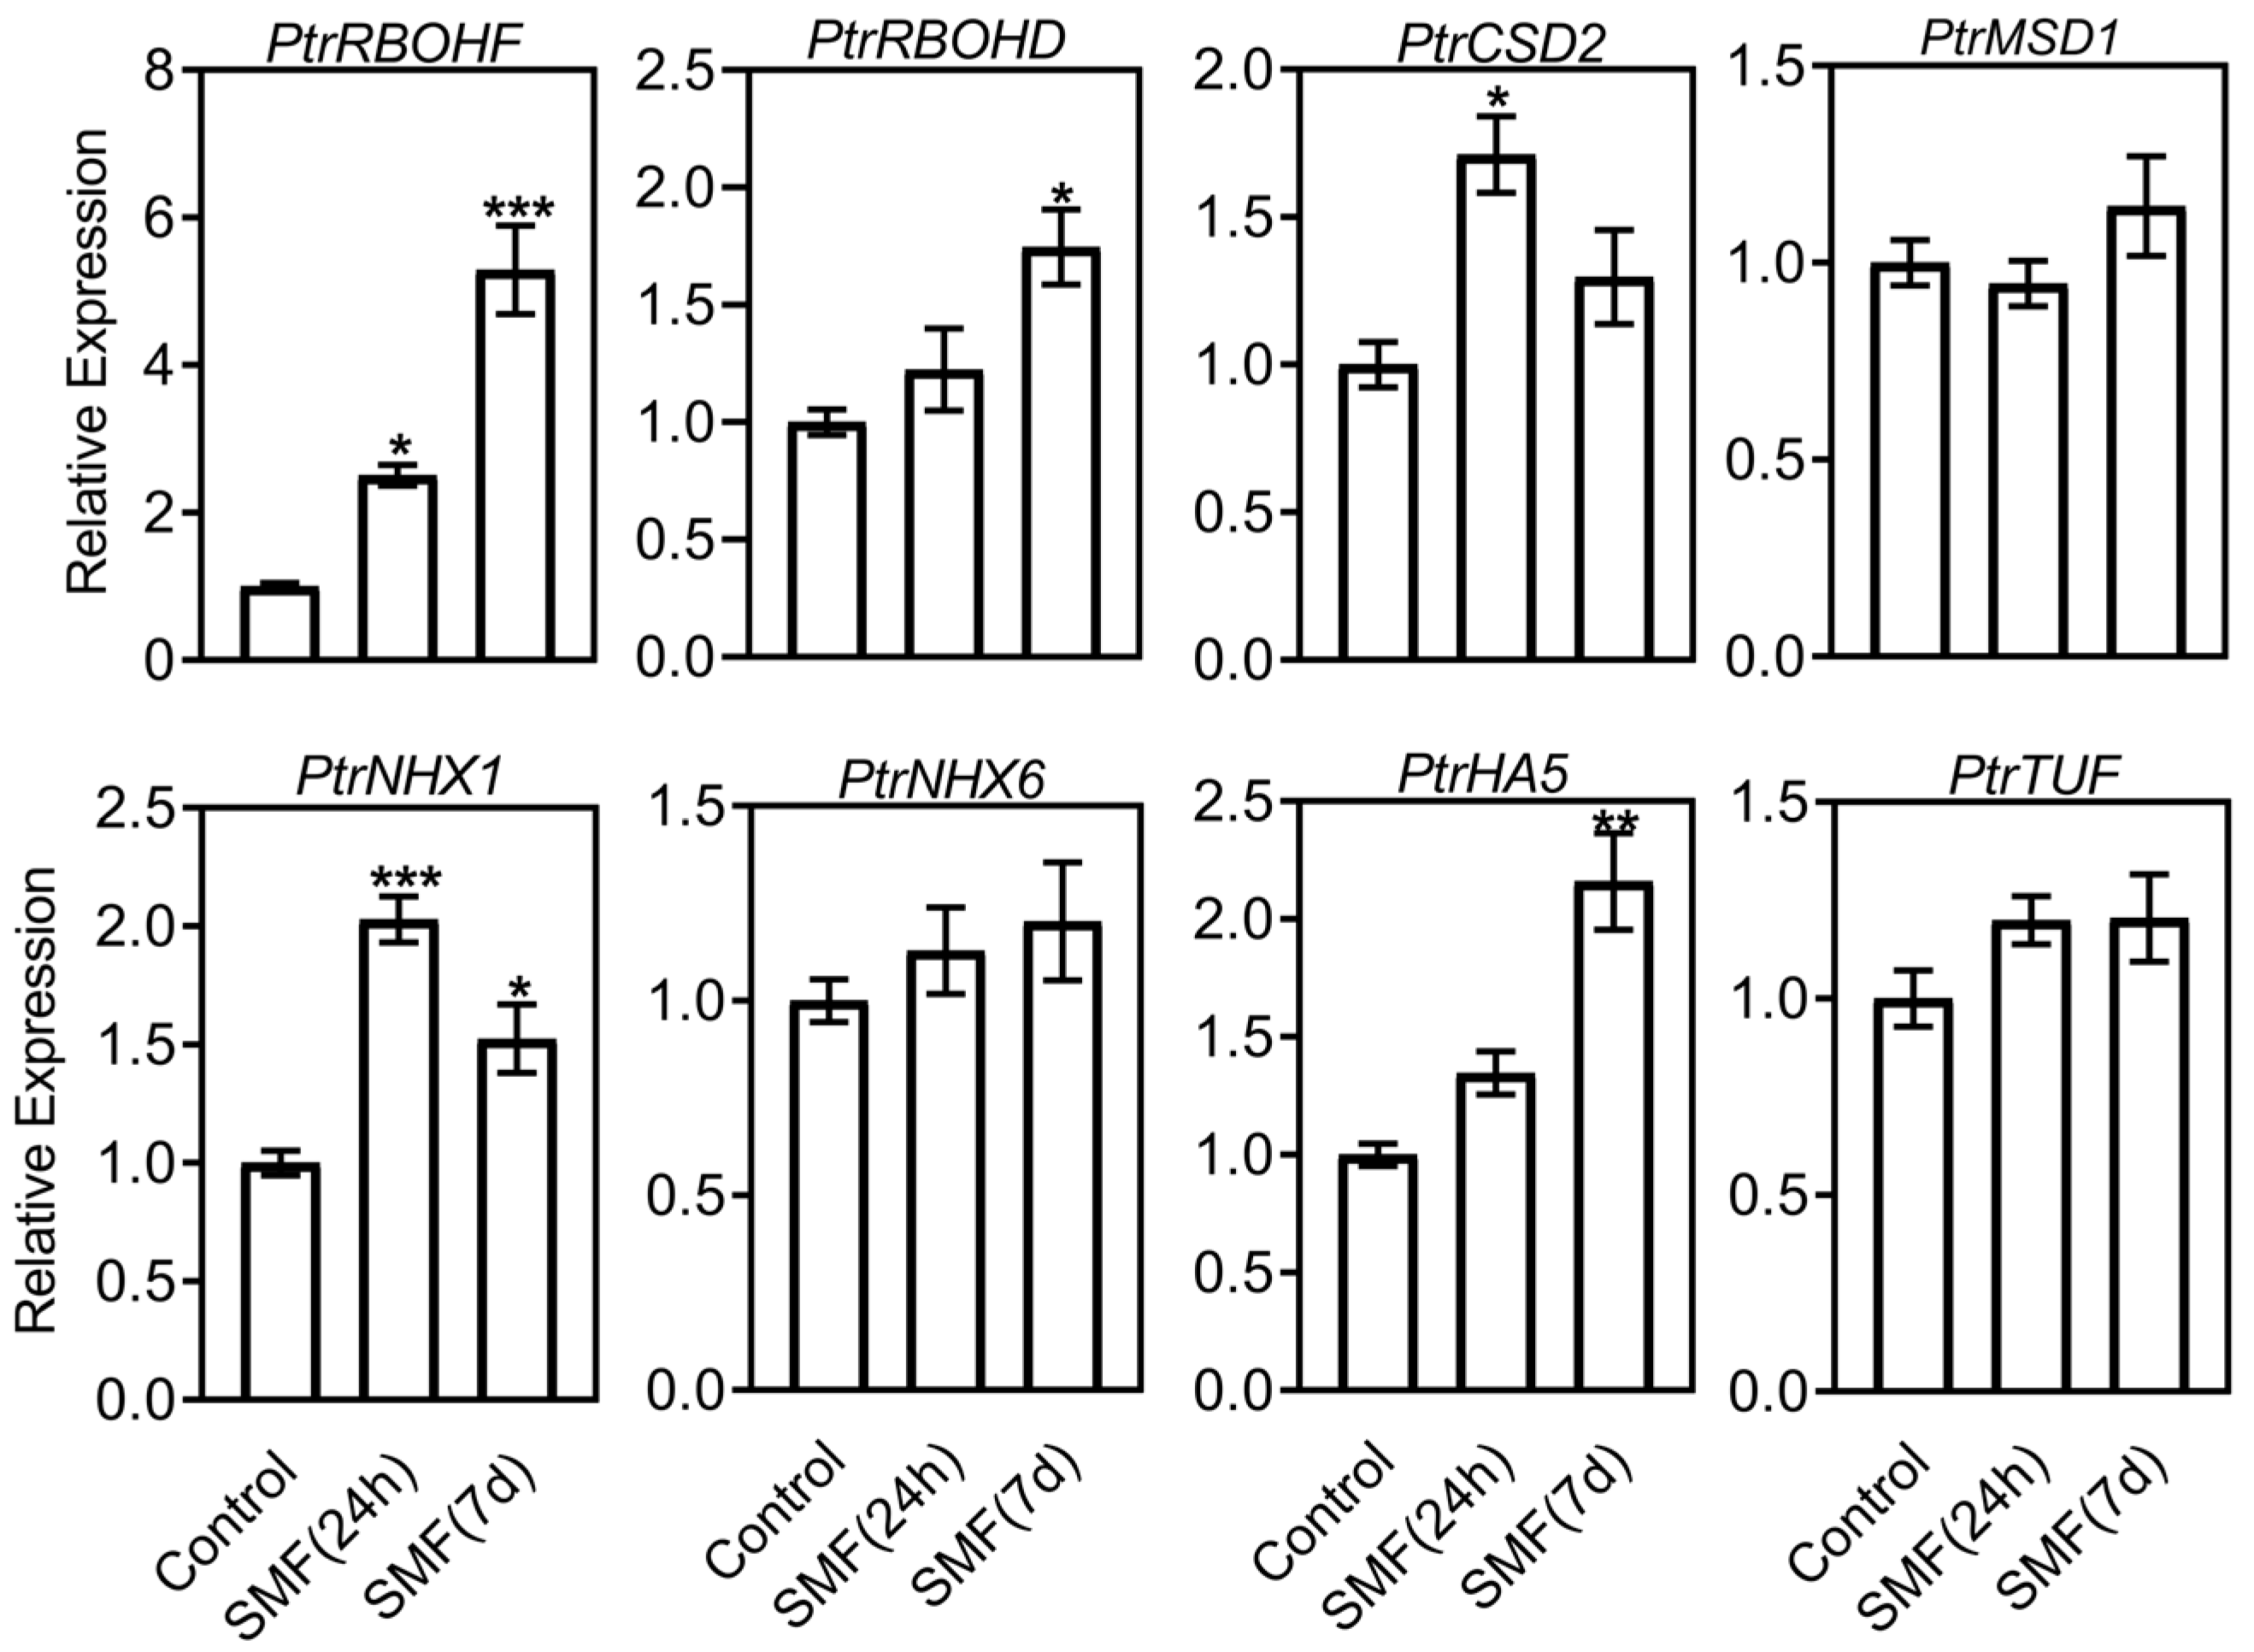
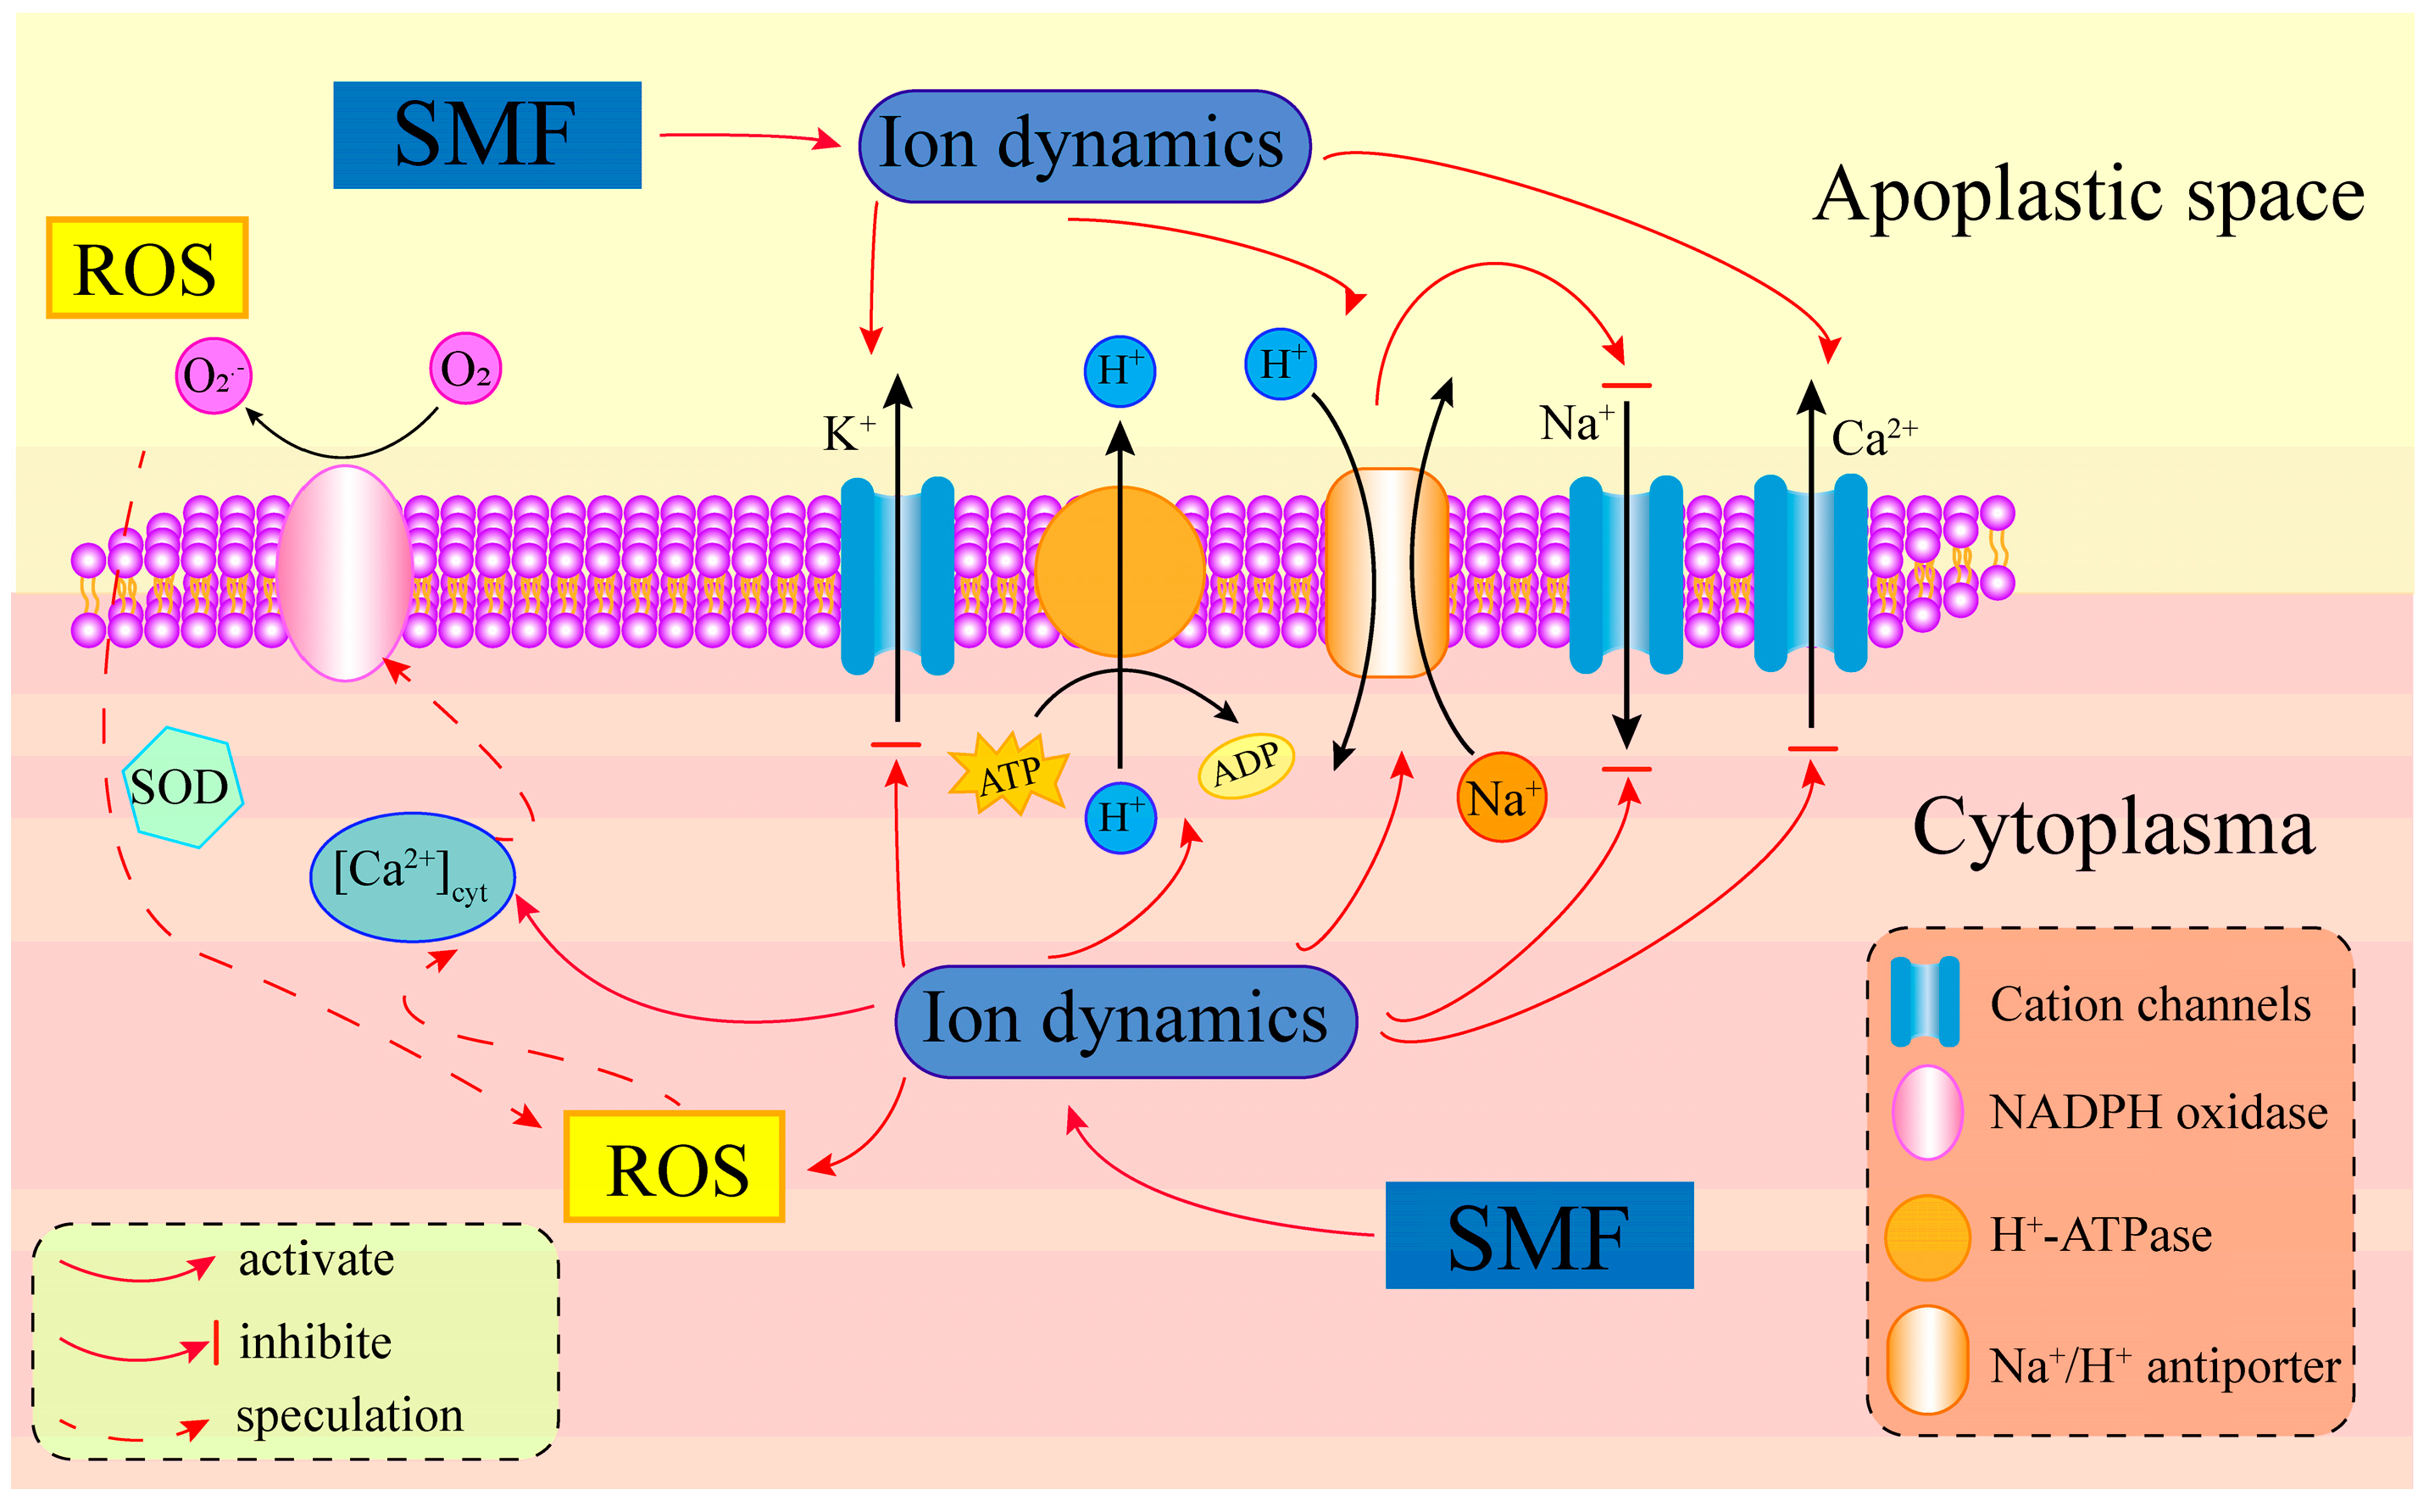
Figure 10.
The physiological regulation pathway by which static magnetic fields improve salt stress tolerance of poplar seedlings.
Figure 10.
The physiological regulation pathway by which static magnetic fields improve salt stress tolerance of poplar seedlings.