Productivity and economic feasibility of cultivated forage and food crops in the central highlands of Ethiopia
[ad_1]
1 Introduction
Agriculture is the dominant sector of the Ethiopian economy, contributing about 35% to GDP and 68% to employment, and 90% to the export value (FAO (Food and Agricultural Organization of the United Nations), 2019). Similarly, livestock are an integral part of agriculture, accounting for about 45% of the agricultural GDP, 31 to 48% of the total household income and 10% of the total export earnings (FAO (Food and Agricultural Organization of the United Nations), 2019). Livestock play a significant role as a source of food and income in addition to several other important economic and socio-cultural functions. The report of the Central Statistical Agency indicated that 98.24% of the total cattle in the country are local breeds with low productivity and production (CSA (Central Statistical Agency), 2018) due to poor quality and inadequate quantity of available feed (FAO (Food and Agricultural Organization of the Usnited Nations), 2019). Ethiopia has a huge livestock population that requires considerable amounts of good quality feed and appropriate feeding systems for increased productivity, production value addition, and transformation of the livelihood of the farmers. Improving the supply and quality of the available feed resources will significantly contribute to enhance productivity and production of the livestock sector in the country (Seyoum et al., 2001; Getnet, 2007; Alemayehu et al., 2017).
The potential feed resources in Ethiopia include natural pastures, crop residues, and stubble grazing, cultivated forages, agro-industrial by-products, grain, and grain screenings, compound or formula feeds. Natural pasture grazing accounts for the major share of feed supply (54.5) followed by crop residues (31.1) and hay, which contribute 7.4% of the total feed (CSA (Central Statistical Agency), 2021). Agro-industrial by-products, improved forage crops, and non-conventional feed resources like animal by-products, vegetable and fruit wastes contribute the remaining 2.0, 0.6, and 4.4% of the total feed, respectively (CSA (Central Statistical Agency), 2021). Livestock feeding in Ethiopia mainly depends on natural pasture and crop residue, both of which have low nutritional value (Adugna et al., 2012b; Alemayehu et al., 2017). Moreover, feed production and processing industries are not well developed and good quality supplemental feeds are in short supply and very expensive in Ethiopia. Feed cost accounts for about 60 to 70% of the total cost of livestock production (Adugna et al., 2012a; Fekede, 2013; Seyoum et al., 2018) and it increases to 75-80% during the critical feed shortage period in the country (Demisse, 2017). Cultivated forage crops have a tremendous contribution to boosting and sustaining livestock productivity by filling the gap of good quality feed resources available in the country (Getnet et al., 2012).
Over the past five decades, the adaptability and yield performance of different improved forage crops have been tested in areas ranging in altitude from 600-3000 meters above sea level, and many promising species have been selected for high, medium, and low altitudes (Getnet and Gezahagn, 2012; Alemayehu et al., 2017). The selected forage crops are generally well adapted to the different agro-ecologies and are high-yielding and have better quality compared to natural pastures (Getnet et al., 2012; Fekede et al., 2015). So far, a total of 82 forage varieties have been officially registered in the crop variety register book in Ethiopia (EAA (Ethiopian Agricultural Authority), 2022). However, the adoption of released forage technologies in Ethiopia is extremely low. The overall adoption rate of forage crops in the Oromiya region during the 2014 production year was 10% (Agajie et al., 2016) and the adoption rate in the same region reached 12% in 2017 (Agajie et al., 2018). Generating tangible evidence to show that forage crops are competitive and better enterprise choices to ensure adoption by various target groups is very important. Hence, generating compelling empirical evidence on yield performance and economic feasibility of improved forage crops is crucial to inform policy makers and practitioners.
2 Materials and methods
2.1 Description of the study areas
The experiment was conducted under rainfed conditions during the main cropping season (June to January) of 2019 and 2020 at the experimental field of the Holetta Agricultural Research Center (HARC) and Ejere under on-farm conditions. HARC is located at 9°00’N latitude, 38°30’E longitude, and at an altitude of 2400 meters above sea level (masl). It is 34 km west of Addis Ababa and is characterized by a long-term (30 years) average annual rainfall of 1055 mm, and average minimum and maximum air temperatures of 6.1 and 22.2°C, respectively (EIAR (Ethiopian Institute of Agricultural Research), 2005). The rainfall is bimodal and about 85% of the precipitation falls from June to September, while the remaining 15% falls from March to May (Getachew, 2017). The soil type of the area is predominantly acidic Eutric Nitosol, which is characterized by an average organic matter content of 1.8%, total nitrogen of 0.17%, pH of 5.24, and available phosphorus of 4.55 ppm (Gemechu, 2007). The experiment was also conducted under on-farm conditions at Ejere. It is located at 9°03’N latitude, 38°26’E longitude, and at an altitude of 2400 masl. The site is located 40 km west of Addis Ababa and is characterized by a long-term average annual rainfall of 1044 mm, average minimum and maximum air temperatures of 6.5 and 22.4°C, respectively. The soil type of the area is Nitosol, which is characterized by an average organic matter content of 3.0%, total nitrogen of 0.13%, pH of 5.0, and available phosphorus of 5.46 ppm. The monthly precipitation and mean temperature of the study areas during the experimental years are indicated in Figure 1.
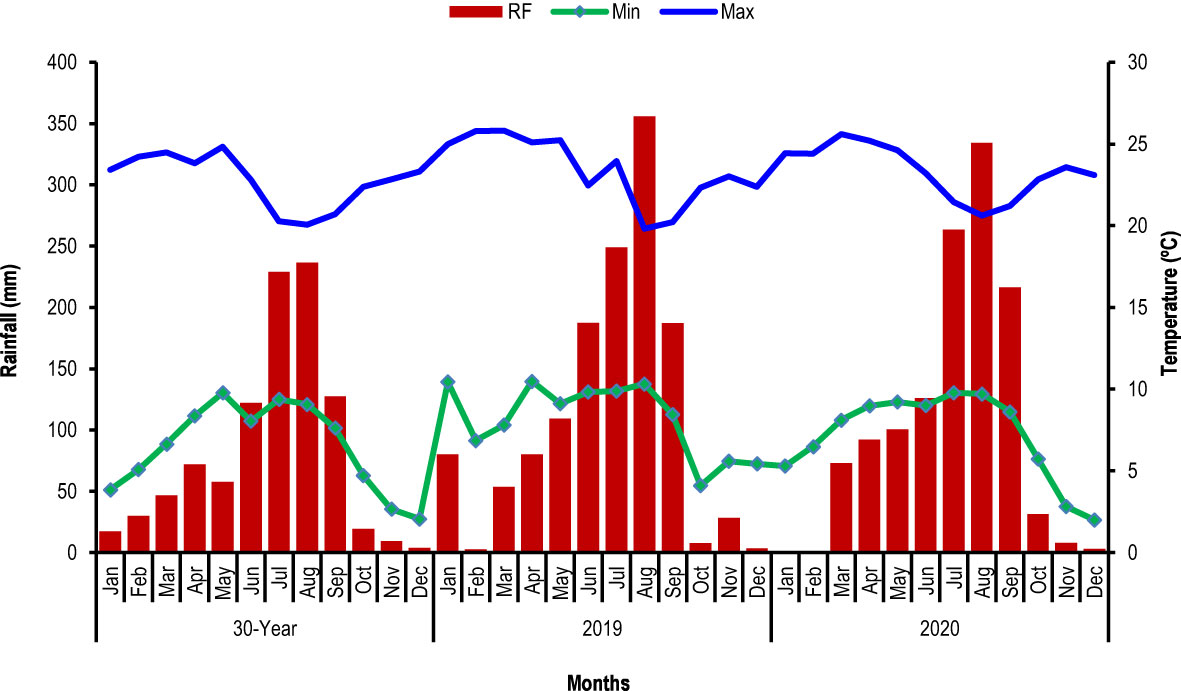
Figure 1 Monthly total precipitation and mean minimum and maximum temperatures during the cropping seasons and 30-year (1989-2018) at the study areas.
The farming system of the study areas is mixed crop-livestock production where tef [Eragrostis tef (Zucc.) Trotter] is the main staple crop complemented by other cereals such as barley (Hordeum vulgare L.), wheat (Triticum aestivum L.), and maize (Zea mays L.). Also, faba bean (Vicia faba L.), field pea (Pisum sativum L.), chickpea (Cicer arietinum L.), and horticultural crops such as potatoes (Solanum tuberosum L.) are the major crops grown in the study areas. The main feed resources in the areas are natural pasture, crop residues, and cultivated forage crops mainly oat/vetch mixture (Avena sativa L./Vicia dasycarpa L.), Napier grass (Pennisetum purpureum), Desho grass (Pennisetum glaucifolium), Rhodes grass (Chloris gayana), and tree lucerne (Chamaecytisus palmensis) which are grown by some farmers for their crossbred dairy cows (HARC (Holetta Agricultural Research Center), 2009). Map of the study areas is indicated in Figure 2.

Figure 2 Map of the study areas.
2.2 Experimental treatments and design
The study was conducted using the best adapted four forage crops and two cereal food crops (Table 1). The experiment was laid out in a randomized completed block design (RCBD) with three replications. The treatments were assigned to plots at random within each block. Each treatment was sown to a plot area of 5 m x 4 m = 20 m2. All treatments were sown with their recommended sow spacing. Except for desho grass, the treatments were sown with 20cm row spacing. Desho grass was planted using root splits in 50-cm inter and 25-cm intra row spacing. The spacing between plots and blocks was 1 m and 1.5 m, respectively. The oat-vetch mixture was sown with 75 and 25% of the recommended seeding rate for oat (75 kg/ha) and vetch (6.3 kg/ha), respectively (Astatke, 1979; Lulseged, 1981). The recommended fertilizer rate of 18 kg N/ha + 20 kg P/ha in the form of diammonium phosphate (DAP) was uniformly applied at sowing for all forage crops. In addition, the recommended fertilizer rate of 45 kg N/ha + 50 kg P/ha and 27 kg N/ha + 30 kg P/ha in the form of diammonium phosphate (DAP) was uniformly applied at sowing for wheat and barley, respectively. Moreover, 50 kg N/ha in the form of urea was applied to wheat and barley crops at tillering stage. For perennial forage crops (Desho grass and Rhodes grass), one-third of 50 kg N/ha in the form of urea was applied during the short rainy season and the remaining two-third were applied at the active vegetative growth stage. The sowing of the first-year experiment was done on July 10, 2019, and July 12, 2019, at Holetta and Ejere, respectively. Similarly, the second-year sowing was done on June 22, 2020, and June 26, 2020, at Holetta and Ejere, respectively. The first-hand weeding was done 30 days after full crop emergence and the second-hand weeding was performed 30 days after the first weeding.
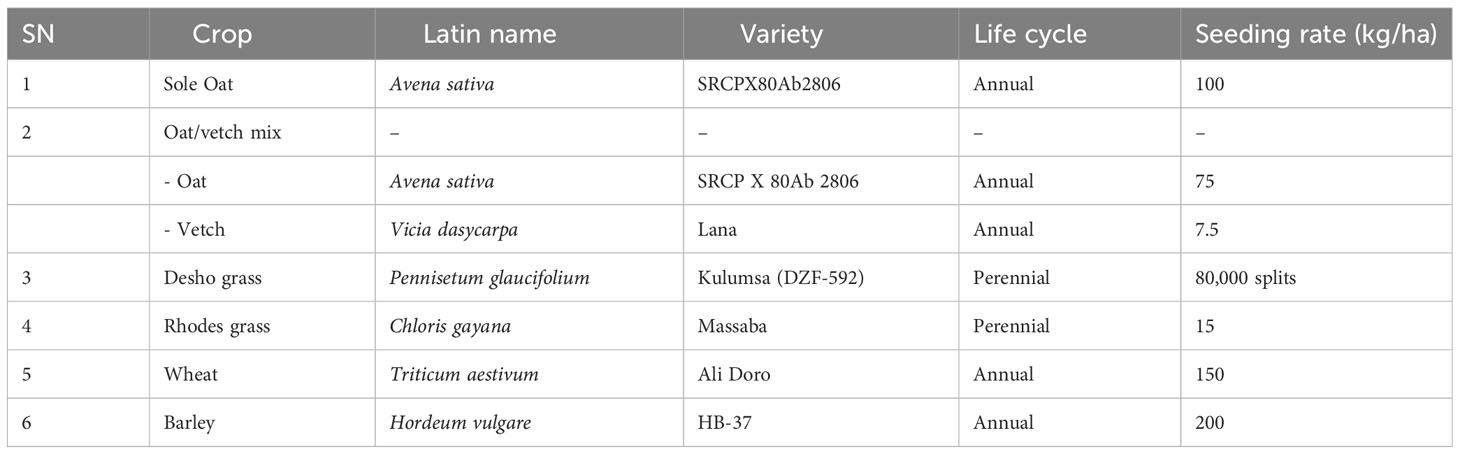
Table 1 List of experimental treatments used for the study.
2.3 Yield determination and nutritive value analysis
Yield data were collected on a plot basis (excluding the two border rows) at forage and grain harvesting stages for forage crops and food crops, respectively. The soft dough stage has been recommended to be the best stage for forage harvesting of oat and oat/vetch mixtures because optimum yield and quality are obtained at this stage for haymaking in Ethiopia (Astatke, 1976; Lulseged, 1981). For the determination of herbage dry matter accumulation, the forage crops were harvested manually using a sickle at the soft dough stage for sole oat and oat/vetch mixtures, 50% heading for Rhodes grass and at 1-m height for Desho grass. The weight of the total fresh biomass was recorded from each plot in the field. To isolate the panicle from the total biomass of the food crops, the panicle portion of the plant was harvested first manually using a sickle and separately collected. The remaining aftermath was harvested from the ground level and its fresh biomass was measured and recorded in the field. About a 500 g sample of the herbage and aftermath was taken and oven-dried at 105°C for 24 h to determine the herbage and aftermath dry matter accumulation. Grain samples were taken and oven-dried at 100°C for 48 h to adjust the moisture concentration to 12.5%, a recommended percentage level for cereals (Biru, 1979). Grain yield was then estimated at an adjusted moisture concentration of 12.5% for safe storage. The residue remaining after grain threshing (chaff) was oven-dried at 100°C overnight and added to the aftermath dry matter to estimate straw dry matter biomass.
The oven-dried samples of forage and straw at 65°C for 72 hours were ground to pass through a 1-mm sieve for laboratory analysis. Total ash and crude protein (CP) concentrations were determined using standard procedures of AOAC (1995). Accordingly, ash was determined upon complete burning of the feed samples in a muffle furnace at 550°C for six hours (AOAC, 1990). Nitrogen concentration was determined by the Kjeldahl method involving acid digestion and distillation (Nelson and Sommers, 1982). The CP concentration was calculated as 6.25 multiplied by N concentration assuming that protein contains 16% N. The structural plant constituents such as neutral detergent fiber (NDF), acid detergent fiber (ADF), and acid detergent lignin (ADL) were analyzed using the detergent extraction method described by Goering and Van Soest (1970). The in-vitro dry matter digestibility (IVDMD) was determined by the two-stage in-vitro fermentation techniques of Tilley and Terry (1963). The metabolizable energy (ME) of the feed was estimated according to the equation proposed by Wiseman (1987).
2.4 Partial budget analysis
An economic analysis was used to compare the economic benefits of food and forage crops using the partial budget analysis (CIMMYT (International Maize and Wheat Improvement Center), 1988). Partial budget analysis involves the calculation of the variable costs and benefits. The benefits were calculated based on the market value of natural pasture hay, grain, and straw of wheat and barley crops after harvesting time (January) of each growing season. The natural pasture hay price was used to estimate the price of Desho and Rhodes grass hay. Costs of pre-basic seed, inorganic fertilizers, and labor costs for land preparation, weeding, and threshing were considered for estimation of production cost. The cost structure is different when comparing annual and perennial forage crops. For annual forage crops, all the production costs are incurred during the production cycle for a single crop. But for perennial crops, costs can be separated into the start-up or establishment cost and the annual cost incurred thereafter. The total costs (i.e., seeds, fertilizers, and labor) were calculated based on local market prices. Labor cost for each activity was taken based on the local daily wage per person to perform the activity per hectare and multiplied by the total man-days required to complete the activity. The gross benefit was calculated by multiplying the forage, grain, and straw yields (kg/ha) by the respective average open market price (presented in ETB/kg). In the economic analysis, the average forage, grain, and straw yields were adjusted downwards by 10%, taking into consideration that farmers could obtain 10% less than the experimental yield (CIMMYT (International Maize and Wheat Improvement Center), 1988). This is because yields from experimental plots are often higher than the yields that farmers could expect using the same treatments. The forage, grain, and straw yields were the average of two growing locations, gross income was estimated based on local market prices, and net income was obtained by deducting total costs from the gross income. Moreover, the benefit-cost ratio (BCR) was calculated by dividing gross revenue (GR) by total variable cost (TVC) (Ozpinar, 2006). If the ratio is less than one, then the costs exceed the benefit (not cost-effective), and such an intervention should be rejected. However, if the ratio is more than one, then the benefit exceeds the costs and the investment is therefore worthwhile (Jehanzeb, 1999). A BCR value of greater than one suggests an intervention whose benefits exceed its costs. Conversely, a BCR of 1 meant that the intervention would not add or take away any value from the farmers and should not be promoted unless there would be wider social or economic benefits (other than financial).
2.5 Statistical analysis
Analysis of variance (ANOVA) procedures of the SAS general linear model (GLM) version 9.4 was used for analysis to compare treatment means (SAS (Statistical Analysis System), 2012). To determine the validity of each location and year analysis, Bartlett’s test for homogeneity of variance was done by the SAS computer packages prior to computing ANOVA. Moreover, the homogeneity of error variance for combined ANOVA was tested using the F-max method of Hartley (Hartley, 1950), which is based on the ratio of the larger mean square of error (MSE) from the separate analysis of variance to the smaller MSE. If the larger MSE is not three-fold larger than the smaller MSE, the error variance is considered homogeneous (Gomez and Gomez, 1984). A separate analysis was made for forage and food crops. The statistical significance was determined using the F test. Only traits that show a significant difference in ANOVA were promoted to mean comparisons using the least significance difference (LSD) at a 5% probability level following Gomez and Gomez (1984). The statistical models for individual location, year, and combined over locations and years are presented below. The statistical model of the RCBD design for individual location and/or year is given by:
Where Yij = measured response of species j in block i; μ = grand mean; Bi = effect of block i; Sj = effect of species j; εij = random error effect of species j in block i. The statistical model of the RCBD design for over years and locations is given by:
Where Yijkl = measured response of species j in block i at location k and year l; μ = grand mean; Bi = the effect of block i; Sj = the effect of species j; Lk = the effect of location k; Yl = the effect of year l; (SL)jk = the interaction effect between species j and location k; (SY)jl = the interaction effect between species j and year l; (LY)kl = the interaction effect between location k and year l; (SLY)jkl = the interaction effect among species j, location k and year l and εijkl = the residual or effects of random error.
3 Results
3.1 Productivity of forage and food crops
The analysis of variance indicated that year, species, and the interaction effect of the year by species showed significant (P<0.05) differences for herbage dry matter accumulation of forage crops (Table 2). In addition, the year and location had significant effects for straw and grain yields of the food crops. Moreover, the interaction effects of the year by location, year by species, and location by species had a significant (P<0.05) effect on straw yield. The grain yield also varied (P<0.05) for species and the interaction effect of the year by location by species.
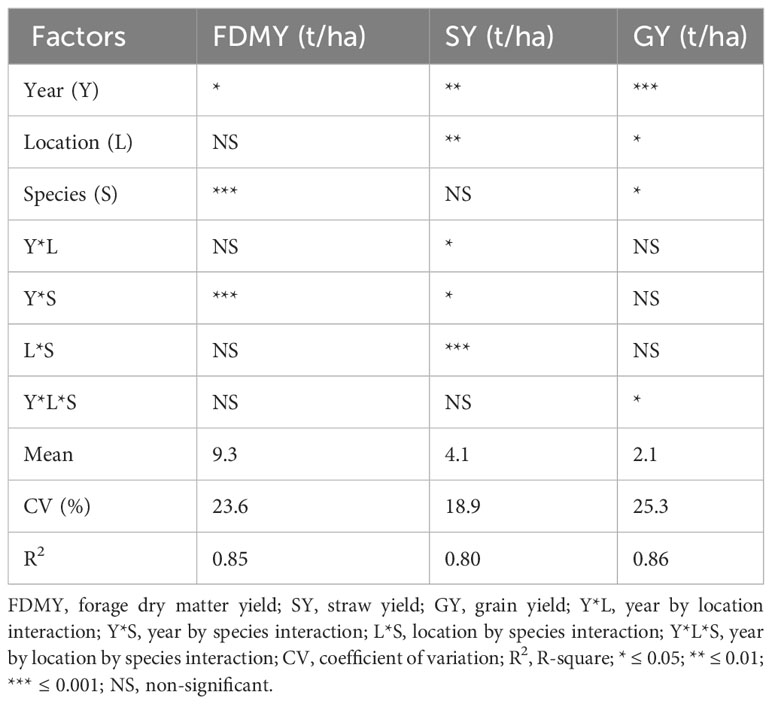
Table 2 Analysis of variance for year, location, species, and their interaction effects on yield and yield components of improved forage and food crops.
The mean herbage DM accumulation of forage crops at the recommended forage harvesting stage differed (P<0.05) at each location during each production year and combined over years and locations (Table 3). The combined analysis at Holetta showed that the mean herbage DM accumulation ranged from 7.3 to 15.8 t DM/ha with a mean of 9.9 t DM/ha. The highest herbage DM accumulation at Holetta was recorded from Desho grass followed by Rhodes grass and oat/vetch mixtures while the lowest was obtained from sole oat. In the combined analysis, Desho grass at Holetta had 80, 108, and 116% herbage DM accumulation advantages over Rhodes grass, oat/vetch mixtures, and sole oat, respectively. Similarly, Rhodes grass at Holetta showed yield advantages of 16 and 21% over oat/vetch mixtures and sole oat, respectively. Furthermore, the combined analysis done at Ejere indicated that Desho grass produced the highest herbage DM accumulation followed by oat/vetch mixtures, and sole oat while the least was recorded from Rhodes grass (Table 3). According to the result of combined analysis at Ejere, Desho grass had 71, 89, and 100% herbage DM accumulation advantages over oat/vetch mixtures, sole oat, and Rhodes grass, respectively. Likewise, oat/vetch mixtures at Ejere had DM yield advantages of 10 and 17% over sole oat and Rhodes grass, respectively.
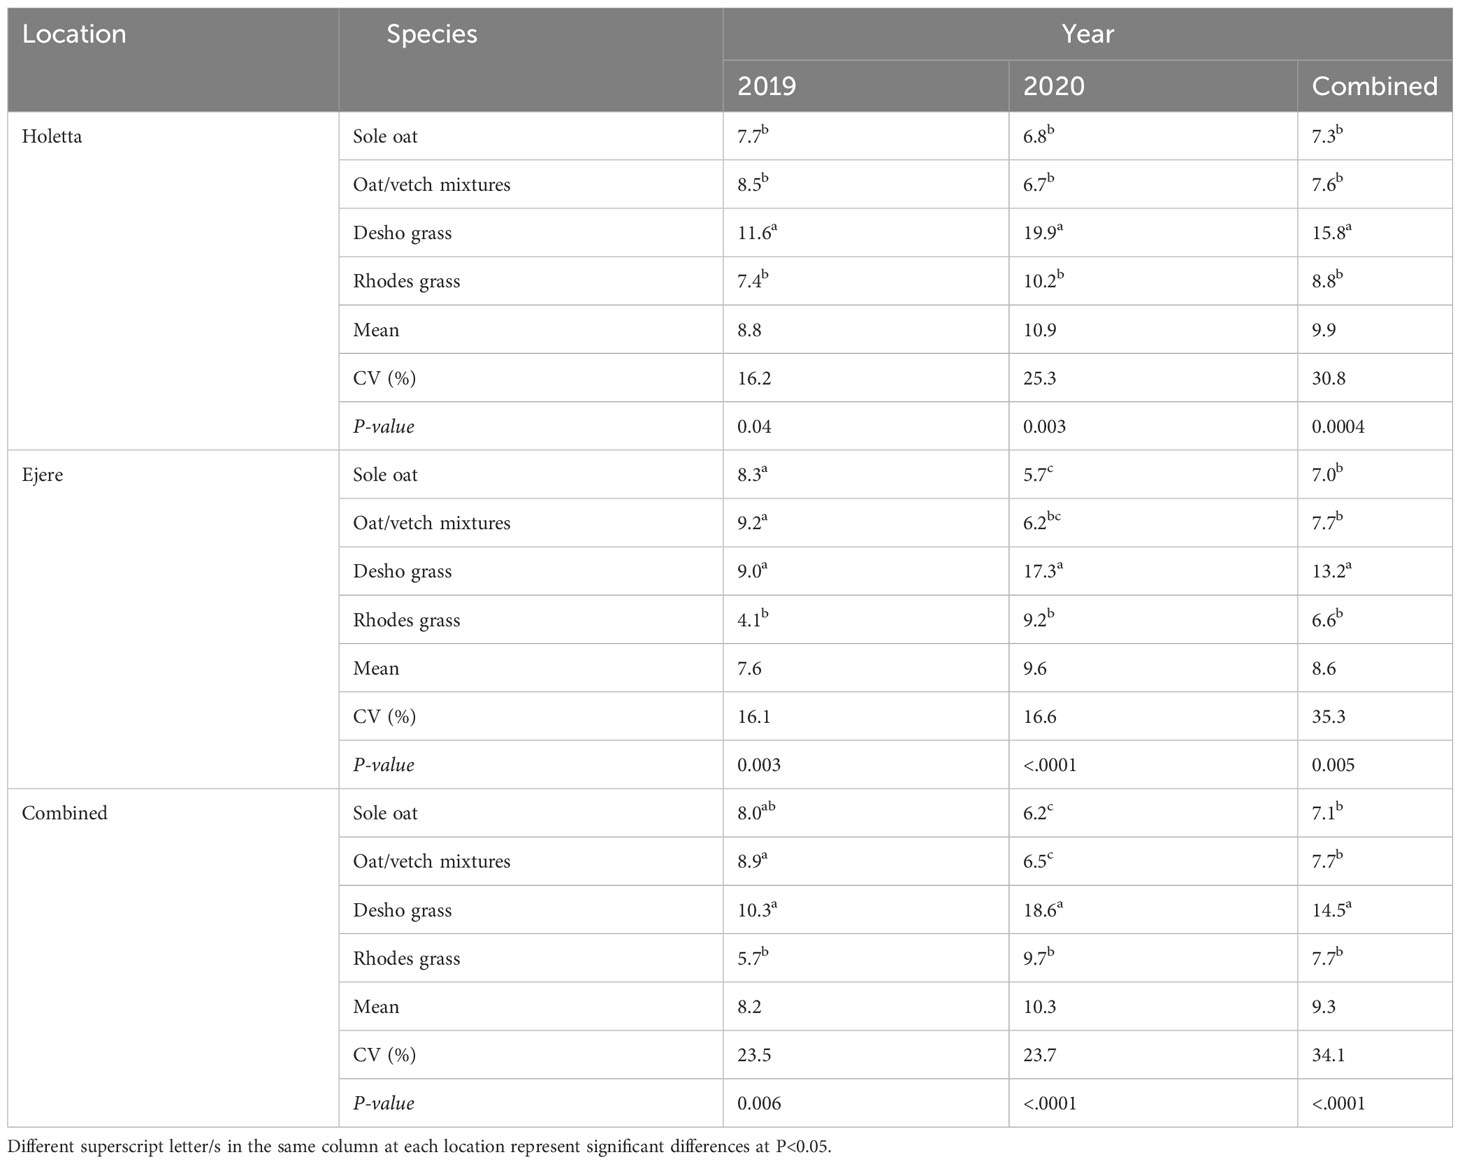
Table 3 Mean herbage DM yield (t/ha) of forage crops at each site, year, and combined over years and locations.
The combined analysis of the two locations indicated that herbage DM accumulation in both production years and combined over years varied (P<0.05) among forage species (Table 3). The result combined over years showed that Desho grass had yield advantages of 88 and 104% over oat/vetch mixtures/Rhodes grass and sole oat, respectively. The herbage DM accumulation produced at Holetta was relatively higher than Ejere during each production year and combined over years. The result showed that yield advantages of 16, 14, and 6% were recorded at Holetta in the first year, the second year, and combined over years, respectively. Moreover, the herbage DM accumulation of forage species varied (P<0.05) between the two production years. Accordingly, the forage species had a 26% yield advantage in the second year of production.
The mean straw yield of wheat and barley at each location during each production year and combined over years and locations is indicated in Table 4. The mean straw yield of wheat and barley at the grain harvesting stage varied (P<0.05) during the first production year and combined over years at Holetta. On the other hand, the straw yield in the second year of production and combined over years differed (P<0.05) between food cops at Ejere. A higher straw yield was recorded for wheat at Holetta while the barley crop gave a higher straw yield at Ejere during both production years and combined over years. At Holetta, the wheat crop had 31, 43, and 35% straw yield advantages in the first year of production, the second year of production, and combined over years, respectively. Similarly, straw yield advantages of 11, 100, and 46% were recorded at Ejere for barley in the first year of production, the second year of production, and combined over years, respectively. The straw yield was slightly higher at Ejere than Holetta in both production years and combined over years. The combined over years analysis indicated that the straw yield advantage of 28% was recorded at Ejere. The mean straw yield varied (P<0.05) between the two production years and accordingly, 28% yield advantage was recorded in the first year of production.
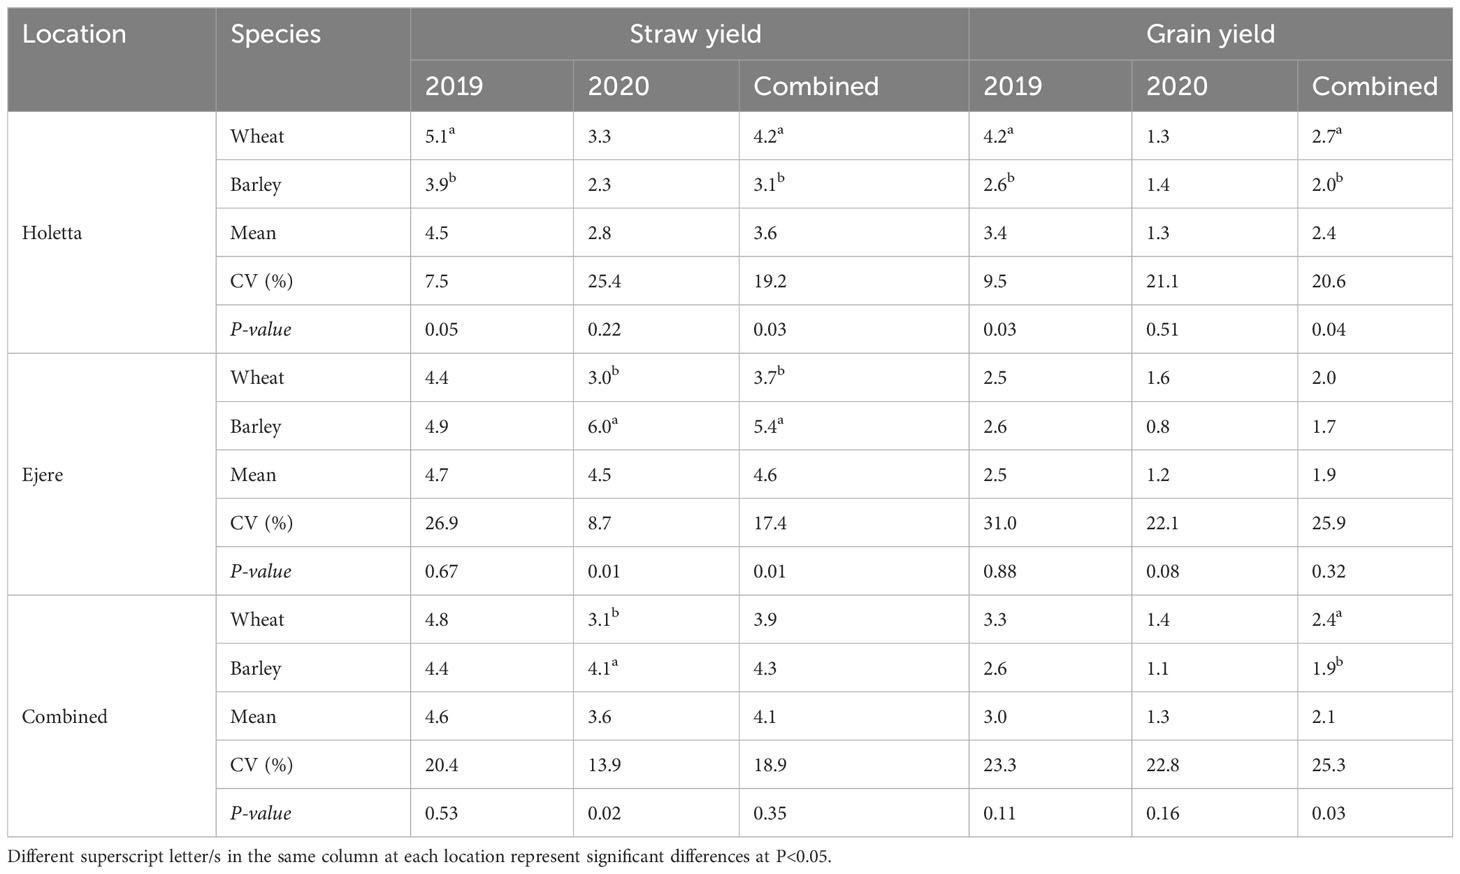
Table 4 Mean straw yield (t/ha) and grain yield (t/ha) of food crops at each site, year and combined over years and locations.
The mean grain yield of wheat and barley at each location during each production year and combined over years is indicated in Table 4. The result indicated that the grain yield varied (P<0.05) for the first year of production and combined over years at Holetta. In the first year of production and combined over years, the wheat crop gave a higher grain yield while the barley crop produced a higher grain yield in the second year of production at Holetta. The grain yield advantages of the wheat crop at Holetta were 63 and 36% over barley crop during the first year of production and combined over years, respectively. At Ejere, the barley crop produced a higher grain yield in the first year of production, but the wheat crop produced a higher grain yield in the second year of production and combined over years. Barley crop had a 5% grain yield advantage in the first year of production while 86 and 18% grain yield advantages were recorded for wheat crop in the second year of production and combined over years, respectively. The combined over locations at each year and combined over years analysis indicated that wheat crop produced a higher grain yield than barley crop. Accordingly, 29, 24, and 27% grain yield advantages for wheat were recorded in the first year of production, the second year of production, and combined over years, respectively. The grain yield was higher at Holetta than Ejere in both production years and combined over years. The grain yield advantages at Holetta were 33, 12, and 26% in the first year of production, the second year of production, and combined over years, respectively. The mean grain yield varied significantly between the two production years and a higher yield was obtained in the first year of production. Accordingly, a 133% grain yield advantage was observed in the first year of production.
3.2 Nutritive value of herbage and straw yields
The nutritive values of herbage for forage crops and straw for food crops were significantly different for all measured parameters at each location and combined over locations (Table 5). Among treatments, Desho grass had higher values of ash, CP, and IVDMD while ME was higher for sole oat at each location and combined over locations. On contrast, NDF and ADL concentrations were higher for wheat and barley straw, respectively. The location had a significant effect on NDF, IVDMD, and ME of herbage DM and straw yields. Furthermore, ash and IVDMD were significantly affected by the interaction effect of species by location. Among the tested crops, perennial forage grasses (Desho and Rhodes grasses) had better ash, CP, and IVDMD followed by annual forage crops (sole oat and oat/vetch mixtures) while the lowest values were produced from wheat and barley straws. The metabolizable energy value was higher for sole oat followed by oat/vetch mixtures while the lowest was recorded for wheat and barley straws.
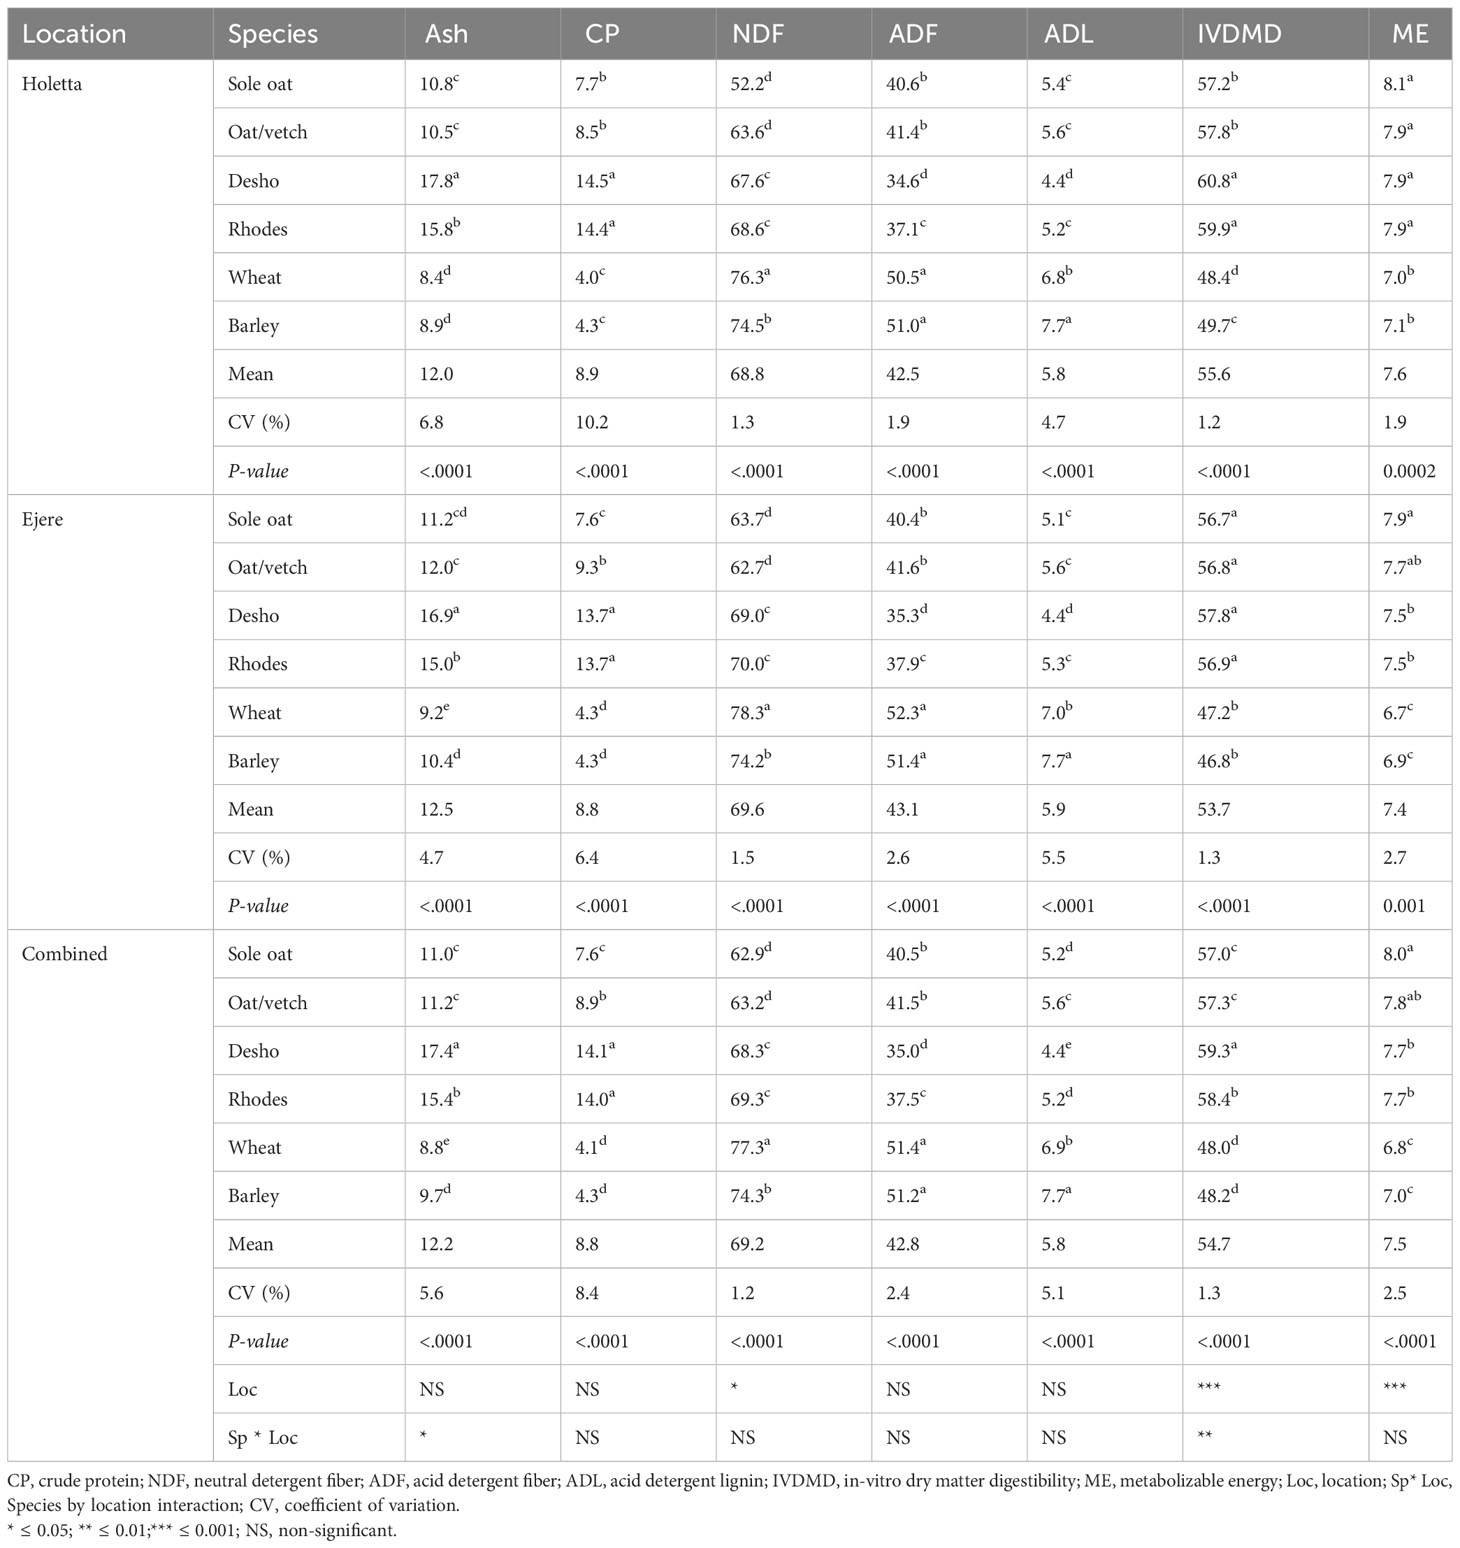
Table 5 Chemical composition (%), in-vitro dry matter digestibility (%), and metabolizable energy (MJ/kg) of forage crop herbage yield and straw yield of food crops at each site and combined over locations.
3.3 Partial budget analysis for food and forage crops
The partial budget analysis for food and forage crops during the first year of production is presented in Table 6. The total input cost (TIC) required for annual forage crops was generally lower than for food and perennial forage crops. Accordingly, the TIC required for the production of Desho grass, wheat, barley, and Rhodes grass were 296, 288, 266, and 192% higher over oat/vetch mixtures, respectively. Similarly, the TIC for Desho grass, wheat, barely, and Rhodes grass were higher by 257, 250, 230, and 164% over sole oat, respectively. The total labor cost (TLC) was generally higher than the TIC required for food and forage crops production. The TLC required for the production of oat/vetch mixtures, sole oat, Rhodes grass, barley, and wheat were 211, 166, 74, 38, and 8% higher than the TIC for the respective crops. Likewise, the TLC for the production of Rhodes grass, barley, wheat, and Desho grass were increased by 72, 71, 42, and 32% over sole oat production, respectively. Furthermore, the TLC of 64, 62, 35, and 25% over oat/vetch mixtures were recorded for Rhodes grass, barley, wheat, and Desho grass, respectively. Thus, the TVC for the production of barley, wheat, Rhodes, and Desho were increased by 114/112, 99/97, 97/95, and 93/91% over sole oat and oat/vetch mixtures, respectively.
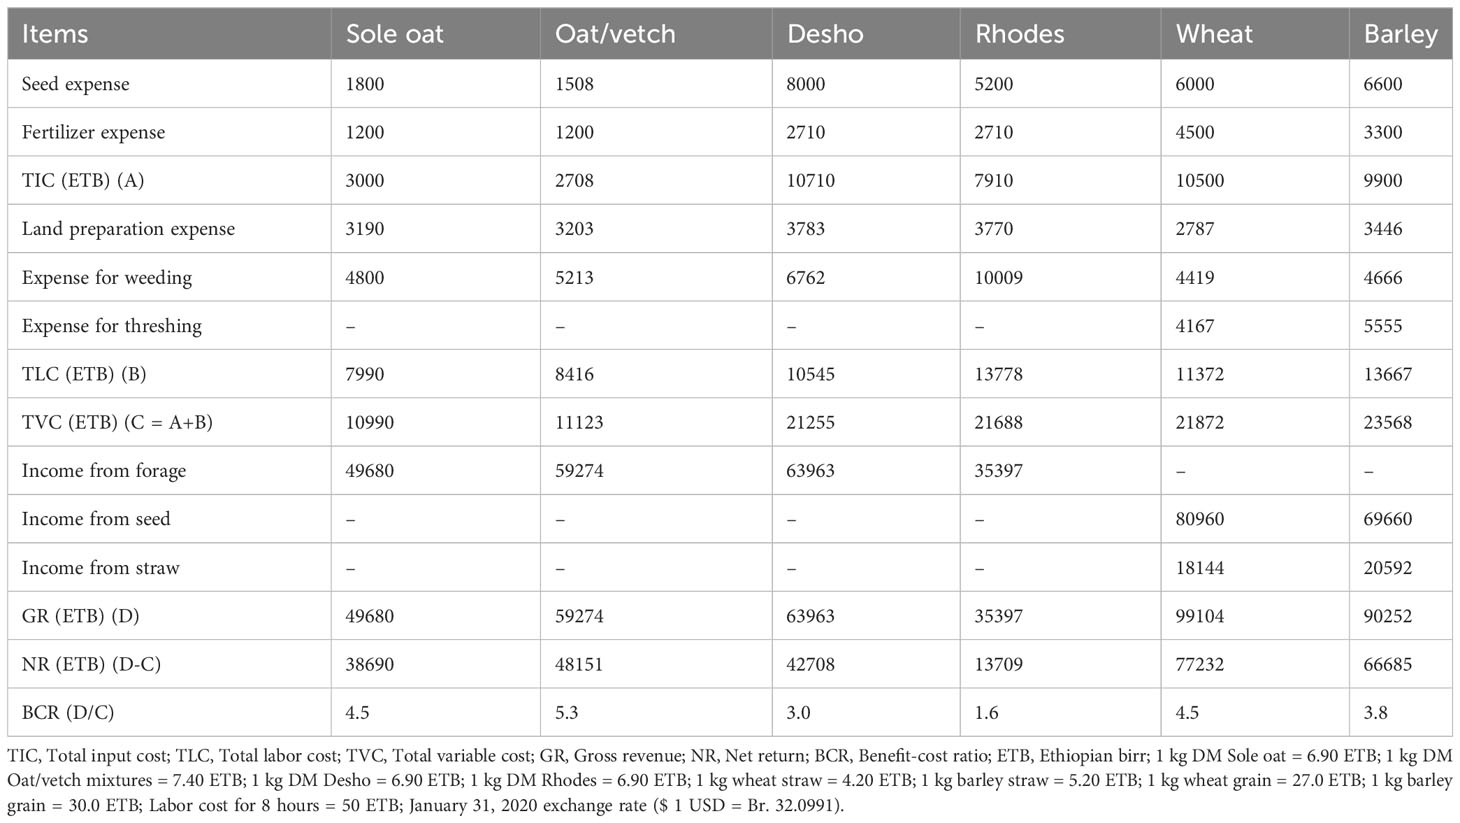
Table 6 Partial budget analysis for food and forage crops in 2019 production year (Ethiopian birr).
The income obtained from the selling of food and forage crops during the first year of production is indicated in Table 6. The result showed that relatively a higher mean gross revenue (GR) was generated from annual forage crops when compared to perennial forage crops during the first year of production. Among forage crops, the highest GR was recorded from Desho grass followed by oat/vetch mixtures and sole oat while the lowest was obtained from Rhodes grass. The GRs earned from Desho grass were 81, 29, and 8% more than Rhodes grass, sole oat, and oat/vetch mixtures, respectively. Similarly, oat/vetch mixtures generated 67 and 19% more GR than Rhodes grass and sole oat, respectively. Furthermore, sole oat generated 40% more GR than Rhodes grass. The wheat crop generated 16% more income from grain sold than barley while barley earned 13% more income from straw sold than wheat. The GR obtained from food crops was higher than forage crops during the first year of production. The result revealed that wheat generated 180, 99, 67, 55, and 10% more GR than Rhodes grass, sole oat, oat/vetch mixtures, Desho grass, and barley, respectively. Likewise, barley crop produced 155, 82, 52, and 41% more GR than Rhodes grass, sole oat, oat/vetch mixtures, and Desho grass, respectively. On the other hand, the net return (NR) obtained from wheat was the highest followed by barley, oat/vetch mixtures, Desho grass, sole oat while Rhodes grass generated the lowest. The wheat crop generated 463, 100, 81, and 60% while barley produced 386, 72, 56, and 38% more NR than Rhodes grass, sole oat, Desho grass, and oat/vetch mixtures, respectively. Similarly, oat/vetch mixtures produced 251, 24, and 13% more NR than Rhodes grass, sole oat, and Desho grass, respectively. Furthermore, Desho grass generated 212, and 10% more NR than Rhodes grass, and sole oat, respectively, while sole oat generated 182% more NR than Rhodes grass.
The benefit-cost ratio (BCR) of food and forage crops during the first year of production is shown in Table 6. The result indicated that the BCR for annual and perennial forage crops and food crops were greater than one, but the highest ratio was recorded for annual forage crops followed by food crops while perennial forage crops gave the lowest ratio. The highest BCR was recorded for oat/vetch mixtures followed by wheat, sole oat, barley, Desho grass while the lowest was from Rhodes grass. The BCR for oat/vetch mixtures was 3.3 and 1.8; wheat/sole oat 2.8 and 1.5; and barley 2.3 and 1.3 times higher than Rhodes grass and Desho grass, respectively. For every one Ethiopian Birr (ETB) spent for the production of oat/vetch mixtures, wheat, sole oat, barley, Desho grass, and Rhodes grass, the farmers generated ETB of 5.33, 4.53, 4.52, 3.83, 3.01, and 1.63 returns or the profit of 4.33, 3.53, 3.52, 2.83, 2.01, and 0.63 ETB on every one ETB spent for the production of the respective crops.
The partial budget analysis for food and forage crops during the second year of production is indicated in Table 7. For wheat production 608, 278, and 242% more TIC were spent than Desho/Rhodes grass, oat/vetch mixtures, and sole oat, respectively. Likewise, for barley production 571, 258, and 224% more TIC were disbursed than Desho/Rhodes grass, oat/vetch mixtures, and sole oat, respectively. Furthermore, sole oat production required 107% more TIC while oat/vetch mixtures production required 88% more TIC than Desho/Rhodes grass production. The sole oat production required 48 and 40% while oat/vetch mixtures production required 44 and 36% more labor cost than Desho grass and Rhodes grass, respectively. The TVCs for the barley were 242, 227, 123, and 112% while for wheat were 214, 200, 104, and 94% more than Desho grass, Rhodes grass, oat/vetch mixture, and sole oat, respectively. The sole oat production required 62 and 55% while oat/vetch mixtures production used 54 and 47% more TVC than Desho grass and Rhodes grass, respectively.
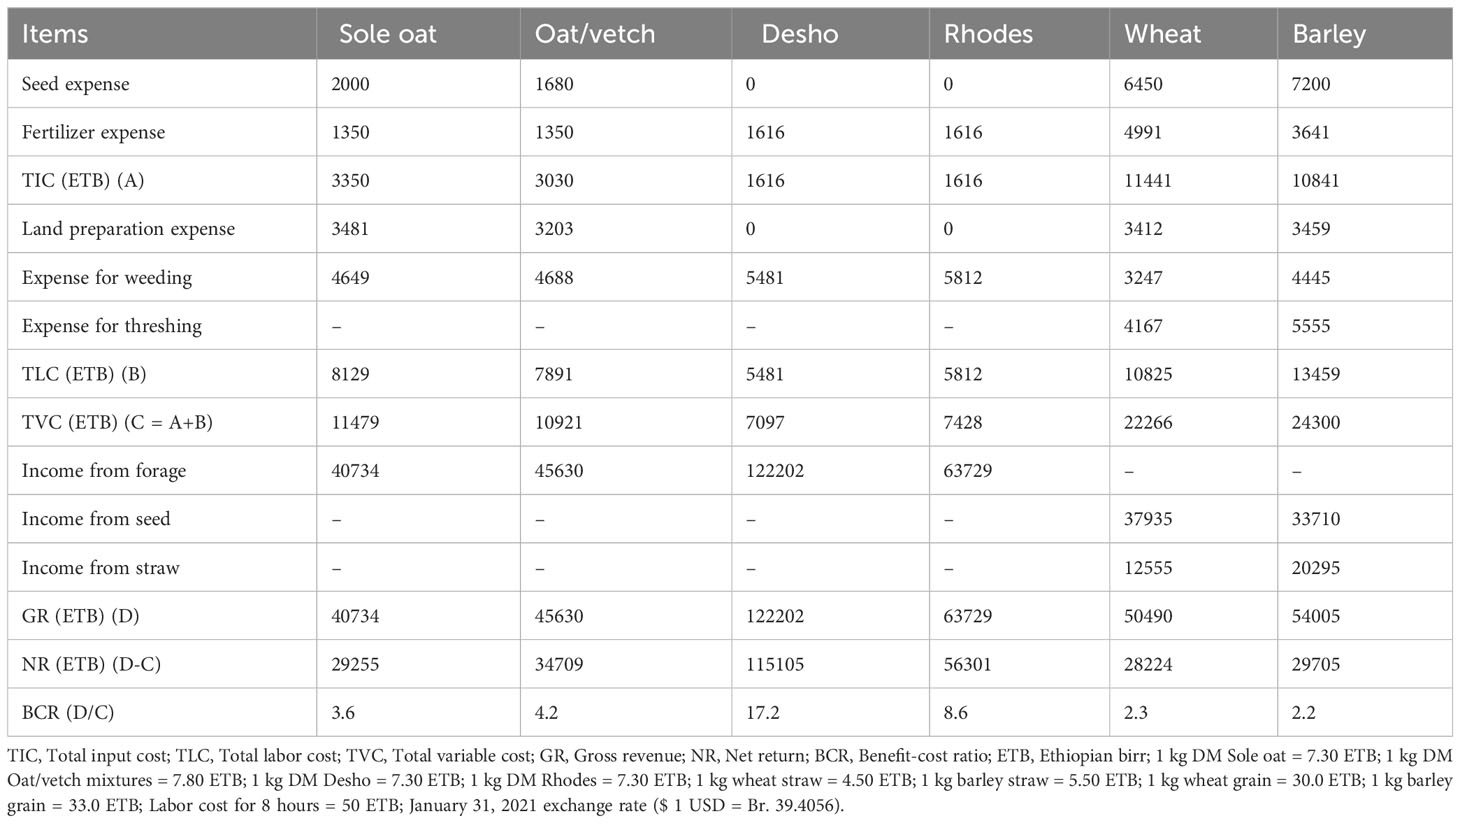
Table 7 Partial budget analysis for food and forage crops in 2020 production year (Ethiopian birr).
The GR and NR earned from the selling of food and forage crops during the second year of production are presented in Table 7. The result showed that the highest GR and NR were generated from perennial forage crops when compared to annual forage and food crops during the second year of production. The GR earned from Desho grass was 200, 168, and 92% more than sole oat, oat/vetch mixtures, and Rhodes grass, respectively. Similarly, Rhodes grass generated 56 and 40% more GR than sole oat and oat/vetch mixtures, respectively. The profit earned from the selling of wheat grain was 13% more than barley grain sold while barley straw sold earned 62% more profit than wheat straw sold. The GR generated from barley and wheat productions were 33 and 24%; and 18 and 11% more than sole oat and oat/vetch mixtures, respectively. The NR obtained from perennial forage crops was higher than food and annual forage crops. The NR obtained from Desho grass was the highest followed by Rhodes grass, oat/vetch mixtures, barley, sole oat while wheat generated the lowest profit. The Desho grass generated 308, 293, 287, and 232% while Rhodes grass generated 99, 92, 90, and 62% more NR than wheat, sole oat, barley, and oat/vetch mixtures, respectively. Furthermore, Desho grass produced 104% more NR than Rhodes grass while oat/vetch mixtures generated 23, 19, and 17% more NR than wheat, sole oat, and barley, respectively.
The BCR of food and forage crops during the second year of production is presented in Table 7. The result showed that the BCR of food and forage crops was greater than one indicating the production of these crops gives better profit in the study areas. The highest BCR was recorded for Desho grass followed by Rhodes grass, oat/vetch mixtures, sole oat, and wheat while the least was recorded for barley. The BCRs of desho grass were 7.8, 7.6, 4.9, and 4.1 times higher than barley, wheat, sole oat, and oat/vetch mixtures, respectively. Likewise, Rhodes grass made 3.9, 3.8, 2.4, and 2.1 times more BCR than barley, wheat, sole oat, and oat/vetch mixtures, respectively. The BCRs of oat/vetch mixtures were 1.9, and 1.8 times higher than barley, and wheat, respectively. Furthermore, sole oat had 1.6 times higher BCR than the other tested food crops. For every one Ethiopian Birr (ETB) spent on the production of Desho grass, Rhodes grass, oat/vetch mixtures, sole oat, wheat, and barley, the farmers generated ETB of 17.22, 8.58, 4.18, 3.55, 2.27, and 2.22 returns or profits of 16.22, 7.58, 3.18, 2.55, 1.27, and 1.22 ETB on every one ETB spent for the production of the respective crops.
The partial budget analysis for food and forage crops combined over years is indicated in Table 8. The results showed that annual forage crops relatively required lower TIC followed by perennial forage crops and food crops. The mean TIC required for the production of food crops (wheat and barley) were increased by 95 and 253% over the mean of perennial (Desho and Rhodes grasses) and annual (oat and oat/vetch mixtures) forage crops, respectively. Similarly, the mean TLC were increased by 38 and 52% for food crops (wheat and barley) compared to the mean TLC of perennial and annual forage crops, respectively. The TVC required for production of sole oat, oat/vetch mixtures, Desho grass, and Rhodes grass were increased by 108, 112, 65, and 61% over barley, respectively. Similarly, 96, 100, 56, and 52% higher TVC over wheat were recorded for sole oat, oat/vetch mixtures, Desho grass, and Rhodes grass, respectively.
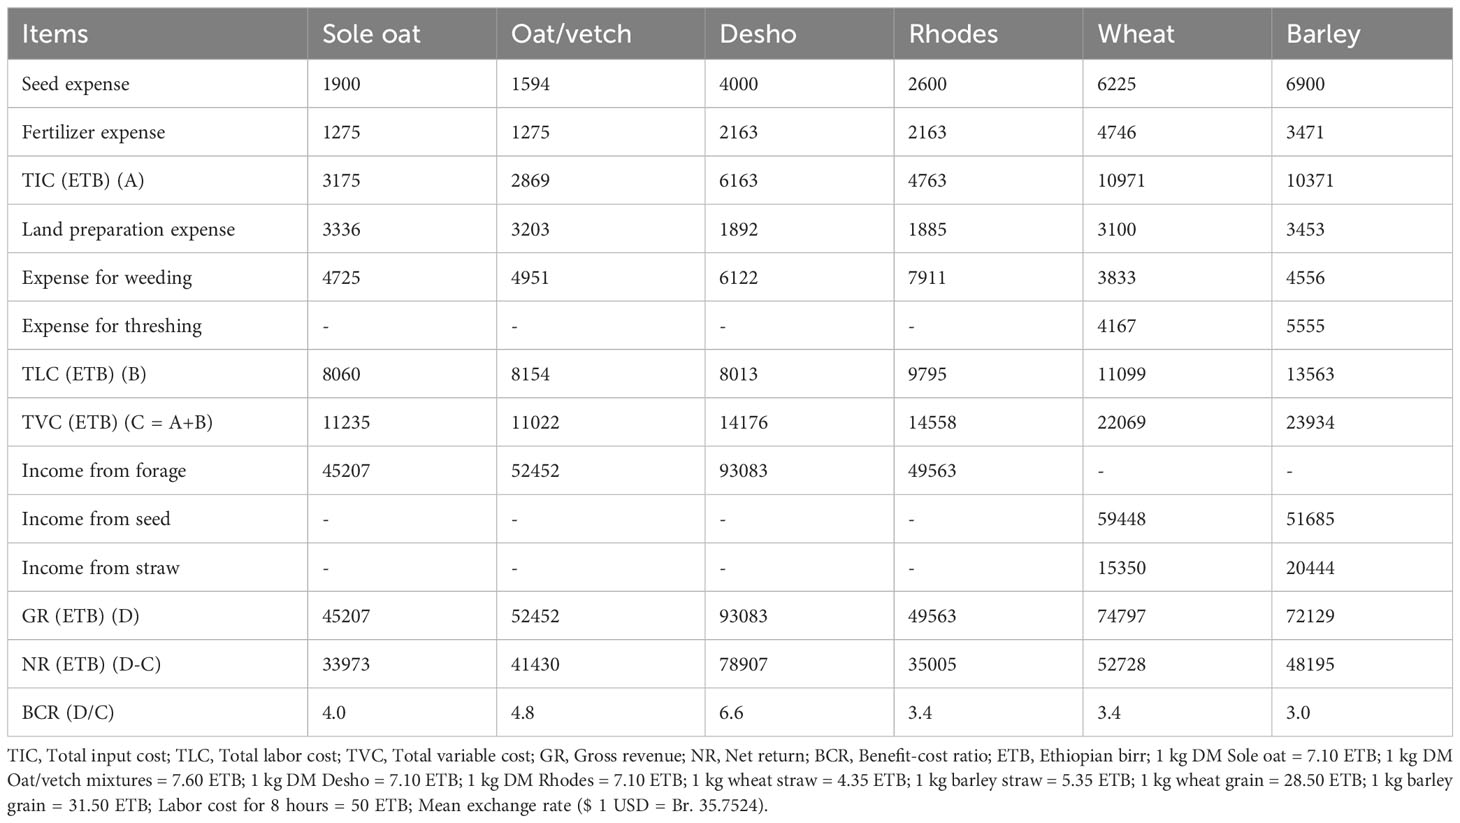
Table 8 Partial budget analysis for food and forage crops combined over years (Ethiopian birr).
The GR and NR for food and forage crops which analyzed over years are indicated in Table 8. The highest mean GR was recorded for mean of food crops (wheat and barley) followed by perennial forage crops (Desho grass and Rhodes grass) while annual forage crops (sole oat and oat/vetch mixtures) gave the lowest. Accordingly, the mean GR for the mean of food crops were increased by 50 and 3% over the mean of annual and perennial forage crops, respectively. The mean GR for the mean of perennial forage crops was also increased by 46% over the mean of annual forage crops. The results revealed that the highest GR was obtained from Desho grass (93,083 ETB) followed by wheat (74,797 ETB), barley (72,129 ETB), oat/vetch mixtures (52,452 ETB), Rhodes grass (49,563 ETB) while sole oat (45, 207 ETB) gave the lowest. Similarly, the NB for Desho grass, wheat, barley, oat/vetch mixtures, Rhodes grass, and sole oat were 78,907, 52,728, 48,195, 41,430, 35,005, and 33973 ETB, respectively. The highest mean NB was recorded for the mean of perennial forage crops followed by food crops and annual forage crops. Thus, the mean NB for the mean of perennial forage crops were increased by 51 and 13% over the mean of annual forage crops and food crops, respectively. The mean of food crops gave 34% higher mean NB over the mean of annual forage crops.
The BCR of food and forage crops over years is presented in Table 8. The result showed that the highest BCR was recorded for perennial forage crops followed by annual forage crops and food crops. Among the crops, Desho grass gave the highest BCR followed by oat/vetch mixtures, sole oat, Rhodes grass, and wheat while barley gave the lowest. The BCR of Desho grass was 1.7, 1.4, 1.9, 1.9, and 2.2 times higher than sole oat, oat/vetch mixtures, Rhodes grass, wheat, and barley, respectively. Similarly, the BCR of oat/vetch mixtures was 1.2, 1.4, 1.4, and 1.6 times higher than sole oat, Rhodes grass, wheat, and barely, respectively. A unit of Ethiopian Birr (ETB) spent for the production of Desho grass, oat/vetch mixtures, sole oat, Rhodes grass, wheat, and barley, the farmers generated ETB of 6.6, 4.8, 4.0, 3.4, 3.4, and 3.0 gross returns or the net profit of 5.6, 3.8, 3.0, 2.4, 2.4, and 2.0 ETB on every unit ETB spent for the production of the respective crops.
4 Discussion
4.1 Yield performance of forage and food crops
The herbage dry matter accumulation of forage species didn’t vary between locations. This might be related to the similarity in the amount and distribution of precipitation, soil characteristics, and the responsiveness of the crop to the environment. However, between the two years varied significantly, which resulted in differences in rainfall and temperature between the two production years. Environmental factors such as soil characteristics, moisture, and temperature have an impact on forage growth (Basford and Cooper, 1998; Gezahagn et al., 2017). The yielding ability of any crop is mainly controlled by the genetic makeup of a genotype, and it can also be affected by environmental factors (Shahzad et al., 2007). Genotype by environment interaction is the change in a cultivar’s relative performance over environments, which results from the differential response of the cultivar to various edaphic, climatic, and biotic factors (Dixon et al., 1994; Gemechu, 2012). The yielding ability of genotypes is the result of their interaction with the environment. There is a strong influence of environmental factors during various stages of crop growth (Bull et al., 1992), thus genotypes differ widely in their response to environments (Romagosa et al., 1996). A genotype grown in different environments will frequently show significant fluctuations in yield performance (Muez et al., 2015).
The yield performance of different forage crops vary due to differences in genetic make-up and their differential response to the growing environments. The recent study done at Holetta indicated that Desho grass had greater herbage DM accumulation compared to other perennial forage species (Mulisa et al., 2021). The mean herbage DM accumulation observed in this study for Desho grass (Bimrew, 2016; Tekalegn et al., 2017; Denbela et al., 2020; Teshale et al., 2021); Rhodes grass (Brima, 2011; Allah and Bello, 2019); Oat/vetch mixtures (Getnet, 1999; Fantahun, 2016); and sole oat (Fekede, 2004; Getnet et al., 2004) were different compared to their respective DM yield reported by different scholars. This might be due to variation in varieties, soil characteristics, moisture, temperature, management, and their interactions.
The utilization of crop residues as an animal feed is a dominant aspect in the mixed crop-livestock production system. The straw yield of wheat in the current study was comparable with the finding of Annicchiarico et al. (2005) but the straw yield obtained from barley was slightly lower than the report of Seyoum et al. (2020). The variation in straw yield between the crops might be associated with differences in genetic makeup and their response to the growing environments. When genotypes grow in different environments, they respond differently due to the differential response of the genotypes to the environments.
The wheat grain yield observed in the current study was comparable with the findings of Annicchiarico et al. (2005) and Rahel and Fekadu (2016) and lower than the previous reports (Erkul et al., 2010; Li et al., 2013). Likewise, barley in this study showed comparable yield (Muhammad et al., 2017) and lower yield (Seyoum et al., 2020) compared to the previous findings. The variation might be related to differences in varieties, growing environments, and management conditions. The grain yield was higher at Holetta than Ejere this might be attributed to the variation of edaphic, climatic, and biotic factors between the testing locations or the differential response of the crops for the growing locations. The mean grain yield varied between the two production years in which a higher yield was produced during the first year of production due to better climatic conditions. The food crops and annual forage crops were re-sown on the same plot in the second year of production. This explicitly indicates that the growing conditions for food crops were less favorable in the cereal mono-cropping than in the crop rotation system. Similar observations were reported by different scholars (Lund, 1993; Soane et al., 2012; Ranjbar et al., 2015; Schlegel et al., 2018).
4.2 Nutritive value of herbage and straw yields
The CP, NDF, ADF, ADL contents, and IVDMD of Desho grass in the present study were higher than in other studies (Bimrew et al., 2017; Mulisa et al., 2021). The CP content of Desho grass was also higher than that reported in different studies (Denbela and Demerew, 2021; Teshale et al., 2021). The ash content of Desho grass in this study was higher than the previous findings (Bimrew et al., 2018; Denbela et al., 2020; Mulisa et al., 2021). The higher ash content in Desho grass could be an indication of high concentration of minerals. The metabolizable energy of Desho grass in the current study was also higher than in the previous study (Bimrew et al., 2017). The CP and ash contents of Rhodes grass reported in this study were higher than other studies (Arshad et al., 2016; Ihsan et al., 2018; Ashenafi et al., 2019). Moreover, the concentration of indigestible fiber or lignin content of this grass was lower than the previously reported value due to better IVDMD in the current study (Ashenafi et al., 2019). The average CP content of sole oat in this study was higher than the value previously reported for different oat varieties (Astatke, 1976; Fekede, 2004; Getnet et al., 2004). The CP and IVDMD observed in this study were higher due to lower fiber contents than the values reported for the same oat variety (Fekede et al., 2007). The CP, NDF, ADL contents of oat/vetch mixtures in the present study were lower while the ash and ADF contents were comparable and higher, respectively than the previous report (Fantahun, 2016). Getnet and Ledin (2001) reported a CP content of 8.6% for oat grown in mixture with vetch and harvested at the soft dough stage which is comparable with the present study.
The CP content of Desho grass, Rhodes grass, oat/vetch mixtures, and sole oat in the current study was higher than the critical level (7.0%) required for optimal rumen function and feed intake in ruminants (Van Soest, 1982). The roughages which have the CP contents ranged from 9.9–15.2; 6.6–9.1; and 3.0–6.1% were classified as high, medium, and low-quality roughages, respectively (Nsahlai et al., 1996). Based on these classifications, Desho and Rhodes grasses are high-quality roughages; sole oat and oat/vetch mixtures are medium quality roughages, and straws of wheat and barley are classified under low-quality roughages. The NDF concentrations of herbage and straws in the current study were above the critical level (55–60%) reported which resulted in lower voluntary intake and feed conversion efficiency (Shirley, 1986). The ADF and ADL concentrations of herbage in the current study lies within the range of 33.3–59.4, and 3.2–11.0%, respectively, as a result, classified under high-quality roughages (Nsahlai et al., 1996). The relatively low ADF and ADL contents in forage crops could indicate that improved forage crops have better digestibility than wheat and barley straws. Despite the considerable differences in IVDMD among the cultivated forage crops in this study, the IVDMD values in this study were lower than the level reported (Moore and Mott, 1973) and IVDMD values greater than 65% indicate high quality feed (Mugeriwa et al., 1973). The nutrient composition of forage crops generally varies depending on genotypic characteristics, environmental conditions, and harvesting stages of the plants (Pascual et al., 2000; Rotili et al., 2001). There is a significant increase in NDF, ADF, and ADL in plants with increased maturity (Kallenbach et al., 2002) and the dilution of CP also increases with increasing plant age (Gezahagn et al., 2014). Furthermore, the variations that existed in the chemical composition of wheat and barley straw realized in this study and those presented in other studies can be explained by the differences in varieties (Seyoum et al., 1998; Adugna et al., 2008), the proportion of botanical fractions (Agbagla-Dohnani et al., 2001), and growing (geographic, seasonal variations, climatic conditions, and soil characteristics) conditions (Mathison et al., 1999; Elseed et al., 2007; Bampidis and Christodulou, 2011).
4.3 Partial budget analysis for food and forage crops
Annual forage crops required lower total input cost (TIC) and total labor cost (TLC) than perennial forage and food crops during the first year of production. The TLC was generally higher than the TIC required for food and forage crops production. The highest total variable cost (TVC) was recorded for food crops (wheat and barley) followed by perennial forage crops (Desho and Rhodes grasses) while the lowest was for annual (sole oat and oat/vetch mixtures) forage crops. The highest TVC required for food crops was due to higher fertilizer cost and additional threshing cost compared to forage crops. The TVC required for annual forage crops was very low compared to food and perennial forage crops due to relatively lower demands of input and labor costs. In the second year of production, the TIC and TLC of food crops were the highest followed by annual forage crops while perennial forage crops required the lowest costs. There was no labor cost for land preparation for perennial forage crops (Desho and Rhodes grasses) in the second year of production, and as a result the TLC for these crops was the lowest compared to food crops and annual forage crops in the second year. The highest TVC was recorded for food crops followed by annual forage crops while perennial forage crops used the lowest cost. The lower TVC for perennial forage crops in the second year of production was due to nil seed and land preparation costs when compared with food crops and annual forage crops. In the combined across year analysis, the mean TIC, TLC, and TVC were higher for the mean of food crops followed by perennial forage crops and annual forage crops. The higher costs of TIC, TLC, and TVC for food crops could be due to higher input and labor costs required for food crops in both production years compared to annual and perennial forage crops. Moreover, the higher costs of TIC, TLC, and TVC for perennial forage crops compared to annual forage crops could be due to higher input and labor costs required particularly in the first year of production than the second year.
Income was generated from selling of forage as hay for forage crops and grain and straw for food crops. Though the grain price of barley was high compared to wheat, the income earned from barley was low due to the low productivity of the crop. However, the income generated from barley straw was higher than wheat straw because of its better nutritional quality (Girma et al., 1996) and its low availability on the market due to high utilization as sole and mixing it with wheat straw by farmers, and its low production and productivity compared to wheat in the study areas. The gross revenue (GR) obtained from food crops was higher than forage crops during the first year of production. The GR mainly depends on the yielding potential of the crops and the unit selling market price of the product. The unit selling market price of the product varies with the location of the markets (farm gate and open market), and seasons (cropping and harvesting) of the year. The price of feed at the farm gate and immediately after the harvesting period is lower than at the open market and dry and wet seasons of the year. Berhanu et al. (2009) also reported that the price of feed in Ethiopia is higher at open market compared to farm gate due to transportation cost and dry and wet seasons due to low supply of feed. Shortage of feed supply during dry and wet seasons is also reported in Ethiopia (Asaminew and Eyasu, 2009) which resulted in higher variations of feed cost over seasons. Spatial and seasonal variability of prices for feed resources is also reported in Ethiopia (Berhanu et al., 2009). The net return (NR) also depends on the amount of yield obtained, the unit selling market price of the product, and the cost of production. The benefit- cost-ratio (BCR) is used to determine whether or not a given activity is cost-effective. The highest BCR obtained from annual forage crop followed by food crops than perennial forage crops implies that annual forage and food crops were making more profit than perennial forage crops in the first year of production. The higher the BCR is the better the economic and management efficiency of the intervention.
The profitability of producing these different forage and grain crops differs if multi-year (second year) budget analysis is considered. The highest GR and NR were generated from perennial forage crops when compared to annual forage and food crops during the second year of production due to low input costs for perennial forage crops in the subsequent production years. The highest GR was recorded from Desho grass followed by Rhodes grass, barley, wheat, and oat/vetch mixtures while sole oat gave the lowest during the second year of production. Moreover, perennial forage crops produced the higher NR than food and annual forage crops. The BCR of perennial forage crops was the highest followed by annual forage crops while the least was observed from food crops indicating perennial and annual forage crops are more profitable than food crops in the second year of production. Generally, perennial forage crops are more profitable in the second year of production and thereafter due to their increased forage yield after the establishment year especially in the cooler highland areas of Ethiopia. Thus, maintaining the perennial forage crops for at least four to five years with optimum management conditions typically give better profit than annual forage and food crops due to their low production cost requirement and increasing biomass yield. The research results also indicated that the herbage DM accumulation in Desho grass is increased linearly up to fourth year of production (Mulisa et al., 2021; Gezahagn et al., 2023).
The combined analysis indicated that Desho grass generated the highest GR followed by wheat and barley due to higher herbage DM accumulation in Desho grass particularly in the second year of production and higher performance of grain and straw yields of food crops (wheat and barley) in the first year of production. The higher mean NR was recorded from the mean of perennial forage crops due to higher herbage DM accumulation, increase of feed price, and lower production costs in the second year of production compared to food and annual forage crops. The lower NR was obtained from food crops and annual forage crops due to lower yield and higher cost of production particularly in the second year of production compared to the first production year. The highest mean BCR was recorded for the mean of perennial forage crops followed by annual forage crops and food crops. This indicated that the perennial forage crops gave better profit across production years.
5 Conclusion
Variation in species, growing environment, and cropping season markedly affected the performance of forage and food crops in the study areas. In the current study, herbage DM accumulations of forage crops were affected by year, species, and the interaction effect of the year by species. The herbage DM accumulation of forage crops varied with production years resulting in a 26% DM yield advantage in the second year of production. Data from the two locations combined over years indicated that Desho grass had DM yield advantages of 104 and 88% over sole oat, and oat/vetch mixtures/Rhodes grass, respectively. In contrast, straw and grain yields of food crops were affected by differences in production years. The straw yield obtained from barley was generally higher while wheat produced better grain yield. In the combined over locations analysis, the yield advantages of 28% for straw yield and 133% for grain yield were observed in the first year of production due to better climatic and growing conditions compared to the second production year. The chemical composition and in-vitro dry matter digestibility of herbage and straw yields of forage and food crops varied for all measured parameters at each location and combined over locations. The CP and IVDMD of perennial forage crops were relatively better than that of annual forage crops and straw of food crops.
In recent years, the market for roughages is increasing due to the continuous reduction of grazing areas and expansion of commercial farms mainly in urban and peri-urban areas. Even though the market for the different feed types is increasing from time to time, there is no feed quality control and assurance mechanism in Ethiopia. Moreover, the poor feed marketing system, which is characterized by poor market information, and limited premium price for quality feed, is critically affecting the feed sector in Ethiopia. The economic performance of forage and food crops production indicated that the estimated gross revenue (GR), net return (NR), and benefit-cost ratio (BCR) varied between the two production years and combined across years. In the first year of production the estimated GR, NR, and BCR were the highest for food crops followed by annual forage crops while perennial forage crops produced the least profit. However, in the second year of production, perennial forage crops made the highest GR, NR, and BCR compared to food crops and annual forage crops. Therefore, based on the results of the current study, it can be concluded that cultivation of annual forage crops is profitable in the first year of production compared to perennial forage crops but the profit is much greater for perennial forage crops in the second year of production. The combined partial budget analysis across production years also indicated that the mean of perennial forage crops gave the highest NR compared to the mean of food crops and annual forage crops. This implies the better economic feasibility of perennial forage crops as they can be maintained using minimal management cost once they have been established. Moreover, both yield and profitability of perennial forages can be further increased via applications of management options such as irrigation which can result in multiple harvests and higher annual yield per unit area.
Data availability statement
The original contributions presented in the study are included in the article/supplementary material. Further inquiries can be directed to the corresponding author.
Author contributions
GK: Conceptualization, Data curation, Formal analysis, Investigation, Methodology, Resources, Software, Validation, Visualization, Writing – original draft, Writing – review & editing. MF: Conceptualization, Data curation, Formal analysis, Investigation, Methodology, Resources, Software, Validation, Visualization, Writing – review & editing. FF: Conceptualization, Data curation, Formal analysis, Funding acquisition, Investigation, Methodology, Project administration, Resources, Software, Supervision, Validation, Visualization, Writing – review & editing. GM: Conceptualization, Data curation, Formal analysis, Investigation, Methodology, Resources, Software, Validation, Visualization, Writing – review & editing. AK: Conceptualization, Data curation, Formal Analysis, Funding acquisition, Investigation, Methodology, Project administration, Resources, Software, Supervision, Validation, Visualization, Writing – review & editing. KM: Conceptualization, Data curation, Formal analysis, Investigation, Methodology, Resources, Software, Validation, Visualization, Writing – review & editing. MD: Conceptualization, Data curation, Formal analysis, Funding acquisition, Investigation, Methodology, Project administration, Resources, Software, Supervision, Validation, Visualization, Writing – review & editing. DG: Conceptualization, Data curation, Formal analysis, Funding acquisition, Investigation, Methodology, Project administration, Resources, Software, Supervision, Validation, Visualization, Writing – review & editing. MM: Conceptualization, Data curation, Formal analysis, Funding acquisition, Investigation, Methodology, Project administration, Resources, Software, Supervision, Validation, Visualization, Writing – review & editing. MB: Conceptualization, Data curation, Formal analysis, Funding acquisition, Investigation, Methodology, Project administration, Resources, Software, Supervision, Validation, Visualization, Writing – review & editing. KB: Conceptualization, Data curation, Formal analysis, Funding acquisition, Investigation, Methodology, Project administration, Resources, Software, Supervision, Validation, Visualization, Writing – review & editing. JD: Conceptualization, Data curation, Formal analysis, Funding acquisition, Investigation, Methodology, Project administration, Resources, Software, Supervision, Validation, Visualization, Writing – review & editing. AA: Conceptualization, Data curation, Formal analysis, Funding acquisition, Investigation, Methodology, Project administration, Resources, Software, Supervision, Validation, Visualization, Writing – review & editing.
Funding
The author(s) declare financial support was received for the research, authorship, and/or publication of this article. This work was funded in whole or part by the United States Agency for International Development (USAID) Bureau for Resilience and Food Security under Agreement # AID-OAA-L-15-00003 as part of Feed the Future Innovation Lab for Livestock Systems. Additional funding was received from Bill & Melinda Gates Foundation OPP#1175487. Under the grant conditions of the Foundation, a Creative Commons Attribution 4.0 Generic License has already been assigned to the Author Accepted Manuscript version that might arise from this submission.
Conflict of interest
The authors declare that the research was conducted in the absence of any commercial or financial relationships that could be construed as a potential conflict of interest.
The reviewer AM declared a past co-authorship with the author(s) GK, MF, FF, GM, KM, MD, DG to the handling editor.
Publisher’s note
All claims expressed in this article are solely those of the authors and do not necessarily represent those of their affiliated organizations, or those of the publisher, the editors and the reviewers. Any product that may be evaluated in this article, or claim that may be made by its manufacturer, is not guaranteed or endorsed by the publisher.
Author disclaimer
Any opinions, findings, conclusions, or recommendations expressed in this article are solely those of the authors alone and not necessarily represent those of their affiliated organization: the publisher or the editors.
References
Adugna T., Alemayehu M., Diriba G., Alemu Y., Yirdaw W. (2012a). The Need for Transforming the Ethiopian Feed Sector. In: Livestock Feed Resources in Ethiopia: challenges, opportunities and the need for transformation (Addis Ababa, Ethiopia: Ethiopian Animal Feed Industry Association), 1–5.
Adugna T., Getnet A., Diriba G., Lemma G., Alemayehu M. (2012b). Major Feed Resources. In: Livestock Feed Resources in Ethiopia: challenges, opportunities and the need for transformation (Addis Ababa, Ethiopia: Ethiopian Animal Feed Industry Association), 5–35.
Adugna T., Tsegaye B., Berg T. (2008). Effects of variety, cropping year, location, and fertilizer application on the nutritive value of durum wheat straw. J. Anim. Physiol. Anim. Nutr. 92, 121–130. doi: 10.1111/j.1439-0396.2007.00717.x
Agajie T., Tadele M., Tesfaye S., Yared D., Wudineh G., Tolesa A., et al. (2016). Adoption analysis of Smallholder Dairy Production Technologies in Oromiya Region. Research Report 115 (Addis Ababa, Ethiopia: Ethiopian Institute of Agricultural Research).
Agajie T., Tadele M., Tolesa A., Abera G., Wudineh G., Takele M. (2018). The Dynamics of the Central Ethiopian Farming Systems. Research Report No 120 (Addis Ababa, Ethiopia: Ethiopian Institute of Agricultural Research).
Agbagla-Dohnani A., Noziere P., Clement G., Doreau M. (2001). In sacco degradability, chemical and morphological composition of 15 varieties of European rice straw. Anim. Feed. Sci. Technol. 94, 15–27. doi: 10.1016/S0377-8401(01)00296-6
Alemayehu M., Gezahagn K., Fekede F., Getnet A. (2017). Review on major feed resources in Ethiopia: conditions, challenges, and opportunities. Acad. Res. J. Agric. Sci. Res. 5 (3), 176–185. doi: 10.14662/ARJASR2017.013
Allah Y. N., Bello A. (2019). The potentials of rhodes grass (Chloris gayana kunth) as drought resistant perennial forage grass in Nigeria. Am. J. BioMed. Sci. Res. 2019 , 6(3). doi: 10.34297/AJBSR.2019.06.001025
Annicchiarico P., Abdellaoul Z., Kelkoull M., Zerargul H. (2005). Grain yield, straw yield, and economic value of tall and semi-dwarf durum wheat cultivars in Algeria. J. Agric. Sci. 143, 57–64. doi: 10.1017/S0021859605004855
AOAC (1995). Official Methods of Analysis (Washington D.C, USA: Association of Official Analytical Chemists).
Arshad I., Ali W., Khan Z. A., Bhayo W. A. (2016). Effect of water stress on the growth and yield of rhodes grass (Chloris gayana L. Kunth.). PSM. Biol. Res. 01 (2), 58–61.
Asaminew T., Eyasu S. (2009). Smallholder dairy system and emergency of dairy cooperatives in Bahir Dar Zuria and Mecha Woredas, northern, Ethiopia. World J. Dairy. Food Sci. 4 (2), 185–192.
Ashenafi W. D., Asad S. Q., Bethel N. N. (2019). Evaluation of some rhodes grass (Chloris gayana) genotypes for their salt tolerance, biomass yield, and nutrient composition. Appl. Sci. 9, 143. doi: 10.3390/app9010143
Astatke H. (1976). Results of experiments in forage crops and pasture management in the highlands of Ethiopia, (1971 – 1976), forage and range bulletin no. 1 (Addis Ababa, Ethiopia: IAR (Institute of Agricultural Research).
Astatke H. (1979). Forage Crops and Pasture Management in the Highlands of Ethiopia. Forage and Range Bulletin No. 2 (Addis Ababa, Ethiopia: IAR (Institute of Agricultural Research).
Bampidis V. A., Christodulou V. (2011). Chickpeas (Cicer artietinum L.) in animal nutrition. Anim. Feed. Sci. Technol. 168, 1–20. doi: 10.1016/j.anifeedsci.2011.04.098
Basford K. E., Cooper M. (1998). Genotype x environment interactions and some considerations of their implications for wheat breeding in Australia. Aust. J. Agric. Res. 4, 153–174. doi: 10.1071/A97035
Berhanu G., Adane H., Kahsay B. (2009). Feed marketing in Ethiopia: Results of rapid market appraisal. Improving Productivity and Market Success (IPMS) of Ethiopian farmers project working paper 15 (Nairobi, Kenya: ILRI (International Livestock Research Institute), 56.
Bimrew A. (2016). Evaluation of the agronomic, utilization, nutritive, and feeding value of desho grass (Pennisetum pedicellatum). Ph.D. Dissertation (Ethiopia: Jimma University).
Bimrew A., Solomon D., Taye T., Firew T., Aynalem H., Jane W. (2017). Effects of altitude and harvesting dates on morphological characteristics, yield, and nutritive value of desho grass (Pennisetum pedicellatum Trin.) in Ethiopia. Agric. Natural Resour. 51 (2017), 148–153. doi: 10.1016/j.anres.2016.11.001
Bimrew A., Yeshambel M., Lamrot T. (2018). Desho grass (Pennisetum pedicellatum Trin.) evaluation based on plant characteristics, yield, and chemical composition under irrigation in Northwestern Ethiopia. JAEID 112 (2), 241–251.
Biru A. (1979). Agronomy Research manual. Part III formulae and tables (Ethiopia: IAR. Addis Ababa).
Brima F. I. A. (2011). Effect of Seed Rate and NPK Fertilization on Growth, Yield and Forage Quality of Rhodes grass (Chloris gayana L. Kunth). M.Sc. Thesis (Sudan: Faculty of Agriculture, University of Khartoum).
Bull J. K., Cooper M., DeLacy I. H., Basford K. E., Woodruff D. R. (1992). Utility of repeated checks for hierarchical classification of data from plant breeding trials. Field Crops Res. 30, 79–95. doi: 10.1016/0378-4290(92)90058-H
CIMMYT (International Maize and Wheat Improvement Center) (1988). From Agronomic Data to Farmer Recommendations: An Economics Training Manual. Completely revised edition (Mexico).
CSA (Central Statistical Agency) (2018). Agricultural sample survey 2017/18. Report on livestock and livestock characteristics. Volume II, Statistical bulletin 587 (Addis Ababa, Ethiopia).
CSA (Central Statistical Agency) (2021). Agricultural asample survey 2020/21. Report on livestock and livestock characteristics. Volume II, Statistical bulletin 589 (Addis Ababa, Ethiopia).
Demisse N. (2017). Review on compound animal feed processing in Ethiopia: Condition, challenges, and opportunities. J. Nutri. Health 3 (2), 1–5. doi: 10.15406/mojfpt.2018.06.00145
Denbela H., Berako B., Sintayehu K. (2020). Evaluation of Desho (Pennisetum pedicellatum) grass varieties for dry matter yield and chemical composition in South Omo Zone, South-Western Ethiopia. Agric. Res. Technol. 25 (2), 001–008. doi: 10.19080/ARTOAJ.2020.25.556294
Denbela H., Demerew G. (2021). Evaluation of Desho (Pennisetum pedicellatum) Grass Varieties for Dry Matter Yield and Chemical Composition under Irrigation in two Districts of South Omo Zone, Southwestern Ethiopia. East. Afr. J. Sci. 15 (1), 71–78. doi: 10.20372/eajs.v15i1.1396
Dixon A. G. O., Asiedu R., Hahn S. K. (1994). “Genotypic stability and adaptability: analytic methods and implications for cassava breeding for low input agriculture,” in Tropical root crops in a developing economy, October 20-26, 1991, 130–137. (Accra, Ghana: International Society for Tropical Root Crops).
EAA (Ethiopian Agricultural Authority) (2022). Plant variety release, protection and seed quality control directorate. Crop variety register issue No. 25 (Addis Ababa, Ethiopia).
EIAR (Ethiopian Institute of Agricultural Research) (2005). Holetta Agricultural Research Center/HARC/progress report 2005/06 (Ethiopia: EIAR/HARC).
Elseed A. M., Niemat A. F., Nor Eldaim I., Amasaib E. O. (2007). Chemical Composition and in situ dry matter degradability of stover fractions of five sorghum varieties. J. Appl. Sci. Res. 3, 1141–1145.
Erkul A., Unay A., Konak C. (2010). Inheritance of yield and yield components in a bread wheat (Triticum aestivum L.) Cross. Turk. J. F. Cr. 2, 137–114.
Fantahun D. (2016). The effect of variety and seed proportions on yield, nutritional quality, and compatibility of oats and vetch mixtures. MSc Thesis (Bishoftu, Ethiopia: Addis Ababa University, College of Veterinary Medicine and Agriculture).
FAO (Food and Agricultural Organization of the United Nations) (2019). The future of livestock in Ethiopia. Opportunities and challenges in the face of uncertainty (Rome), 48. Licence: CC BY-NC-SA 3.0 IGO.
Fekede F. (2004). Evaluation of potential forage production qualities of selected oats (Avena sativa L.) genotypes. M.Sc. Thesis (Ethiopia: Alemaya University of Agriculture).
Fekede F. (2013). Evaluation of feed resources and assessment of feeding management practices and productivity of dairy cattle in the central highlands of Ethiopia. Ph.D. Dissertation in livestock production and management (Karnal-132001 (Haryana), India: National Dairy Research Institute (I.C.A.R).
Fekede F., Adugna T., Solomon M. (2007). Nutritive value of different varieties and morphological fractions of oats harvested at the soft dough stage. Trop. Sci. 47 (4), 188–196. doi: 10.1002/ts.213
Fekede F., Getnet A., Gezahagn K., Alemayehu M., Driba G. (2015). “Cultivated forage crops research and development in Ethiopia,” in Proceedings of Pasture and Rangeland Research and Development in Ethiopia. Eds. Yami A., Assefa G., Gizachew L. (Addis Ababa, Ethiopia: Ethiopian Society of Animal Production, ESAP).
Gemechu K. (2007). Phenotypic diversity for biological nitrogen fixation in Abyssinian field pea (Pisum sativum var. abyssinicum) germplasm accession. Report on independent study for Ph.D (Ethiopia: Addis Ababa University Science Faculty).
Gemechu K. (2012). Genetic potential and limitations of Ethiopian chickpea (Cicer arietinumal) germplasm for improving attributes of symbiotic nitrogen fixation, phosphorus uptake and use efficiency, and adzuki bean beetle (Callosobruchus chinensis L.) resistance. Ph.D. Thesis (Ethiopia: Addis Ababa University faculty of life science).
Getachew A. (2017). Biochar, Compost, and Biochar-Compost: Effects on Crop Performance, Soil Quality and Greenhouse Gas Emissions in Tropical Agricultural Soils. Ph.D. dissertation (Cairns, Australia: James Cook University).
Getnet F. (1999). Feed resource assessment and evaluation of forage yield, quality and intake of oats and vetches grown in the highlands of Ethiopia. M.Sc. Thesis. (Sweden: Swedish University of agricultural science, Uppsala)
Getnet A. (2007). Evaluation of Tagasaste (Chamaecytisus palmensis) as Forage for Ruminants. Ph.D. dissertation (Verlag: Dr. Kdster, Berlin).
Getnet A., Fekede F., Abreham G., Muluneh M. (2004). “Characterization of selected oats varieties for their important production traits in the highlands of Ethiopia. ESAP (Ethiopian society of animal production) 2004,” in Farm animal biodiversity in Ethiopia: status and prospects, August 28-30, 2003, 441pp. [Addis Ababa, Ethiopia: Ethiopian Society of Animal Production (ESAP)}.
Getnet A., Gezahagn K. (2012). “Seed research and development of perennial forage crops in the central highlands,” in Forage Seed Research and Development in Ethiopia. Eds. Assefa G., Dejene M., Hanson J., Anemut G., Mengistu S., Mengistu A. (Ethiopia: Ethiopian Institute of Agricultural Research).
Getnet A., Gezahagn K., Fekede F. (2012). “Forage Seed Production and Quality in Ethiopia,” in FRG II project, Empowering Farmers’ Innovation Series No. 3. Ensuring Seed Quality in Ethiopian Seed System, Status and Challenges. Proceedings of a workshop held on 18 March 2011 at EIAR. Eds. Alemu D., Kiyoshi S., Kirub A., Assefa K.(Addis Ababa, Ethiopia).
Getnet A., Ledin I. (2001). Effect of variety, soil type, and fertilizer on the establishment, growth, forage yield, quality, and voluntary intake by cattle of oats and vetches cultivated in pure stands and mixtures. Anim. Feed. Sci. Technol. 92, 95–111. doi: 10.1016/S0377-8401(01)00242-5
Gezahagn K., Fekede F., Mulisa F., Kedir M., Mesfin D., Gezahegn M., et al. (2023). Dry matter accumulation dynamics, morphological characteristics and nutritive value of desho (Pennisetum glaucifolium) grass varieties in the central Highlands of Ethiopia. J. Agric. Environ. Sci. 8 (1), 110–123. doi: 10.20372/jaes.v8i1.1479
Gezahagn K., Getnet A., Alemayehu M., Fekede F. (2014). Forage nutritive values of vetch species and their accessions grown under nitosol and vertisol conditions in the central highlands of Ethiopia. In Livestock Research for Rural Development. 26 (1), 20. Available at: http://www.lrrd.org/lrrd26/1/kebe26020.htm.
Gezahagn K., Getnet A., Fekede F., Alemayehu M., Tadesse T., Muluneh M., et al. (2017). Biomass yield potential and herbage quality of alfalfa (Medicago sativa L.) genotypes in the central highland of Ethiopia. Int. J. Res. Stud. Agric. Sci. (IJRSAS). 3 (1), 14–26. doi: 10.20431/2454-6224.0301003
Girma G., Abate T., Seyoum B., Amha S., Aschalew T., Kahsay B. (1996). “Improvement and utilization of barley straw,” in Barley research in Ethiopia: past work and future prospects. Proceedings of the first barley research review and strategy workshop held in 16 – 19 October 1993. Eds. Gebre H., Van Leur J.(Addis Ababa, Ethiopia), 171–181.
Goering J. M. A., Van Soest P. J. (1970). Forage fiber analysis. Agricultural Hand Book No. 379 (Washington D.C., USA: Agricultural Research Services United States Department of Agriculture).
Gomez K. A., Gomez A. A. (1984). Statistical procedure for agricultural research. 2nd ed. (New York: International Rice Research Institute. John Wiley and Sons Inc).
HARC (Holetta Agricultural Research Center) (2009). Forage and pasture research project progress report (Ethiopia: EIAR/HARC).
Ihsan A., Kenneth B. M., Neamat K., Ahmed A., Mohammed A. H. (2018). Productivity and nutritional value of four forage grass cultivars compared to Rhodes grass irrigated with saline water. AJCS 12 (02), 203–209. doi: 10.21475/ajcs.18.12.02.pne571
Jehanzeb (1999). Economic Efficiency of the Agrarian Structure in the Northwest Frontier Province of Pakistan: An Econometric Analysis (Pakistan: Deptt. of Econ. Univ. of Peshawar).
Kallenbach R. L., Nelson C. J., Coutts J. H. (2002). Yield, quality, and persistence of grazing-and hay-type alfalfa under three harvest frequencies. Agronomy Journal 94, 1094. doi: 10.2134/agronj2002.1094
Li Y. F., Wu Y., Hernandez-Espinosa N., Pena R. J. (2013). Heat and drought stress on durum wheat responses of genotypes, yield, and quality parameters. J. Cereal Sci. 5, 398–404. doi: 10.1016/j.jcs.2013.01.005
Lulseged G. (1981). Summary of fodder oats research undertaken by IAR (IAR, Addis Ababa: Pasture and fodder forage bulletin no. 2).
Lund M. G. (1993). Tillage and crop rotation affect corn, soybean, and winter wheat yields. J. Production. Agric. 6, 207–213. doi: 10.2134/jpa1993.0207
Mathison G. W., Soofi-Siawash R., Okine E. K., Helm J., Juskiw P. (1999). Factors influencing composition and ruminal degradability of barley straw. Can. J. Anim. Sci. 79, 343–351. doi: 10.4141/A99-012
Moore J. E., Mott G. O. (1973). “Structural inhibitors of quality in tropical grasses,” in Anti-quality Components of Forages. Ed. Matches A. G. (Madison, Wisconsin, USA: Crop Science Society of America), 53–98. CSSA Special Publication No. 4.
Muez M., Sentayehu A., Berhane L. (2015). Trait variability and genotype by environment interaction of malt barley genotypes in tigray, Ethiopia. World J. Agric. Sci. 11 (1), 42–47. doi: 10.5829/idosi.wjas.2015.11.1.1844
Mugeriwa J. S., Christianson J. A., Ochetim S. (1973). Grazing behavior of exotic dairy cattle in Uganda. East. Afr. Agric. Fores. J. 19, 1–11. doi: 10.1080/00128325.1973.11662610
Muhammad M. A., Nawab A., Muhammad O. I. (2017). Growth and yield of barley (Hordeum vulgare L.) as influenced by potassium under water deficit conditions of Peshawar valley. Agric. Vet. Sci. 1 (2), 96–102.
Mulisa F., Gezahagn K., Fekede F., Kedir M., Muluneh M., Solomon M., et al. (2021). Evaluation of ten perennial forage grasses for biomass and nutritional quality. Trop. Grasslands-Forrajes. Tropicales. 9 (3), 292–299. doi: 10.17138/tgft(9)292-299
Nelson D. W., Sommers L. E. (1982). Total carbon, organic carbon, and organic matter. In “Chemical and microbiological properties. Part 2. Agron. series no. 9”. Ed. Page A. L. (Madison, USA: ASA, SSSA), 570.
Nsahlai I. V., Zinash S., Seyoum B., Umunna N. N. (1996). “Nutritive characteristics and strategies to enhance utilization of tropical feeds for low resource livestock producers,” in Proceedings, 4th Annual Conference of the Ethiopian Society of Animal Production, 18–19 April 1996. 40–56. [Addis Ababa, Ethiopia: Ethiopian Society of Animal Production (ESAP)].
Ozpinar S. (2006). Effects of tillage systems on weed population and economics for winter wheat production under the Mediterranean dryland conditions. Soil Till. Res. 87, 1–8. doi: 10.1016/j.still.2005.02.024
Pascual J. J., Fernandez C., Diaz J. R., Garces C., Rubert-Aleman J. (2000). Voluntary intake and in vivo digestibility of different date-palm fractions by Murciano-Granadina (Capra Hircus). J. Arid. Environments. 45, 183–189. doi: 10.1006/jare.1999.0622
Rahel T., Fekadu A. (2016). Effects of seed rate and row spacing on yield and yield components of bread wheat (Triticum aestivum L.) in dalbo awtaru woreda, wolaita zone, Southern Ethiopia. J. Biol. Agric. Healthcare. 6 (7), 2016.
Ranjbar A., Sepaskhah A. R., Emadi S. (2015). Relationships between wheat yield, yield components, and physicochemical properties of soil under rain-fed conditions. Int. J. Plant Production. 9, 433–466.
Romagosa I., Ullrich S. E., Han F., Hayes P. M. (1996). Use of the additive main effects and multiplicative interaction model in QTL mapping for adaptation in barley. Theor. Appl. Genet. 93, 30–37. doi: 10.1007/BF00225723
Rotili P., Gnocchi G., Scotti C., Kertikova D. (2001). Breeding of the alfalfa plant morphology for quality. Proc. XIV. Eucarpia. Medicago. sp. Group. Meeting. Zaragoza. 45, 25–28.
SAS (Statistical Analysis System) (2012). SAS/STAT guide for personal computers. 9.4 editions (Cary, NC, USA: SAS Institute Inc.).
Schlegel A. J., Assefa Y., Haag L. A., Thompson C. R., Stone L. R. (2018). Long-term tillage on yield and water use of grain sorghum and winter wheat. Agron. J. 110, 269–280. doi: 10.2134/agronj2017.02.0104
Seyoum B., Gemechu N., Harinder M. (2018). Ethiopian feed industry: Current status, challenges, and opportunities. Feedipedia (Broadening Horizons).
Seyoum B., Getnet A., Abate T., Dereje F. (2001). “Present status and future direction in feed resources and nutrition research targeted for the wheat-based crop-livestock production system in Ethiopia. Wheat and weeds: Food and Feed,” in Proceedings of Two Stakeholder Workshops (Santa Cruz, Bolovia: CIMMYT), 207–226.
Seyoum B., Mulugeta W., G/Mariam T., Berhane L., Dereje F., Getu K., et al. (2020). Grain Yield, Yield Attributes and Straw Quality of Improved Malt Barley Varieties in Central Highlands of Ethiopia. Results of Livestock Research Completed in 2019 (Addis Ababa: EIAR).
Seyoum B., Sileshi Z., Assefa G., Gebre H. (1998). “Effect of cultivar and fertilizer application on yield and quality of barley straw,” in Proceedings of 6th conference of Ethiopian Society of Animal Production, 14- 15 May 1998. 145–152. [Addis Ababa, Ethiopia:Ethiopian Society of Animal Production (ESAP)].
Shahzad M. A., Din W. U., Sahi S. T., Khan M. M., Ehsanullah, Ahmad M. (2007). Effect of sowing dates and seed treatment on grain yield and quality of wheat. Pakistan J. Agril. Sci. 44 (4), 581–583.
Shirley R. L. (1986). Nitrogen and Energy Nutrition of Ruminants (Orlando, Florida, USA: Academic Press).
Soane B. D., Ball B. C., Arvidsson J., Basch G., Moreno F., Roger-Estrade J. (2012). No-till in northern, western and southwestern Europe: A review of problems and opportunities for crop production and the environment. Soil Tillage. Res. 118, 66–87. doi: 10.1016/j.still.2011.10.015
Tekalegn Y., Solomon M., Edao S., Fromsa I. (2017). Desho grass (Pennisetum pedicellatum) Lines Evaluation for Herbage Yield and Quality under Irrigation at Wondogenet. American-Eurasian. J. Agric. Environ. Sci. 17 (5), 427–431. doi: 10.5829/idosi.aejaes.2017.427.431
Teshale J., Ketema B., Zinash A. (2021). Evaluation of desho grass for their agronomic performances and nutritive values in highland and Midland Areas of Guji Zone, Southern Oromia, Ethiopia. Sci. Res. 9 (3), 35–40. doi: 10.11648/j.sr.20210903.11
Tilley J. M. A., Terry R. A. (1963). A two-stage technique for the in vitro digestion of forage crops. J. Br. Grassland. Soc. 18, 104–111. doi: 10.1111/j.1365-2494.1963.tb00335.x
[ad_2]