Quantifying Consolidation in the Scholarly Journals Market
[ad_1]
Scientists are trained to never to accept anything at face value. Even the most obvious of statements requires supporting data, otherwise it must be treated with skepticism.That training has been on my mind over the last few months as I’ve worked with colleagues to put together a large scale report on trends in the journals publishing market. A key trend, obvious to any publishing consultant or acquisitions editor buried in a seemingly endless (and seemingly rising) stream of independent journals seeking a partnership with a larger publisher, is the ongoing and ever-increasing market consolidation that has been accelerated by the move to open access (OA). We all know this to be true, but where is the data?
Looking at the literature, the references I can find are out of date, the most recent being Lariviére et al., from 2015, looking at conditions in 2013. With nothing available for the last decade, I set out to see if the obvious was indeed true.
Caveats: Issues with DOIs, publisher metadata, and bibliometrics databases
A trip to a local university’s library offered access to all the major bibliometric databases. While I have frequently used these databases to look at the current (or at least recent) state of individual journals and journal portfolios, this was one of the first large scale historical analyses I’ve done, and I learned many lessons along the way. What at first seemed a fairly straightforward research project very quickly got a lot more complicated, due to the, er, persistent nature of persistent identifiers (PIDs). Many of the bibliometric databases we use to analyze the literature are based around DOIs (digital object identifiers) for articles. DOIs are awesome, because they aim to resolve to their targets even if the location of that target moves somewhere new. That’s what makes them persistent, and it offers tremendous benefits when you want to find something today. But it raises problems for trying to figure out where it was yesterday.
As an example, the journal GENETICS was independently published by the Genetics Society of America (GSA), beginning in 1916. In 2021, the GSA signed a publishing services agreement with Oxford University Press (OUP). All of the journal’s back issues moved over to the OUP platform, and all of the DOIs associated with those articles now resolve to OUP. Which means that bibliometric databases that find articles based on DOIs will now tell you that OUP has always been the publisher of GENETICS, all the way back to its founding, because that’s where the DOIs point.
And that makes historical trend analysis difficult. And so I turned the Web of Science (WoS). WoS has the advantage of creating an annual snapshot of the literature that isn’t dynamically updated. Publisher information is still kind of spotty in WoS – unlike other databases, WoS still sees GENETICS as independently published by GSA (all 2022 articles are credited to the society as the publisher, despite having moved to the OUP platform). And like other bibliometric databases, WoS has failed to recognize some of the major mergers that have taken place over the last two decades. Nature journals are still listed separately and not included under “Springer Nature” despite the two merging in 2015. Hindawi remains a separate entity from its 2021 owner, Wiley. For my analysis, these mergers had to be adjusted for manually and the companies treated as one after their respective mergers. Next year’s study will likely need to manually merge De Gruyter and Brill. I don’t know if these issues are due to poor metadata supplied by publishers or are based on how each individual database chooses to capture its sources. I’ve not vetted the WoS data on a journal-by-journal basis, so the results presented below may need to be taken with a grain of salt and show large scale trends rather than accuracy on a detailed level.
One useful benefit of WoS is that it allows the user to readily filter out Meeting Abstract articles. Many journals publish the abstracts from their host society’s annual meeting, which can inflate the article totals for a journal by thousands, even if these aren’t full articles that were vetted through peer review by the journal’s editorial board. This sort of filtering much is more difficult, if it’s even possible, in some of the other major bibliometric databases.
The downside to WoS is that it is a selective database — that is, it only indexes a subset of the literature, those journals that have passed Clarivate’s criteria and been deemed worthy of inclusion. Though not a comprehensive measure of the field at large, it does at least give us a sense of what’s going on with a large portion of the journals seen as important by the research community (i.e., those with Impact Factors). So I’m using it here as a proxy for the entire market, although my conclusions should be taken with the caveat that the limited sample size ignores things like non-English language journals, regional journals, or anything beneath Clarivate’s level of inclusion.
Quantifying the Market
To get a sense of market consolidation, I first quantified the number of articles in the WoS per year (excluding Meeting Abstracts). This can be seen in Figure 1 below. In 2018, the WoS added a huge number of journals to its database via the Emerging Sources Citation Index (ESCI), but as these journals weren’t counted in earlier years, I excluded them as well to keep things consistent.
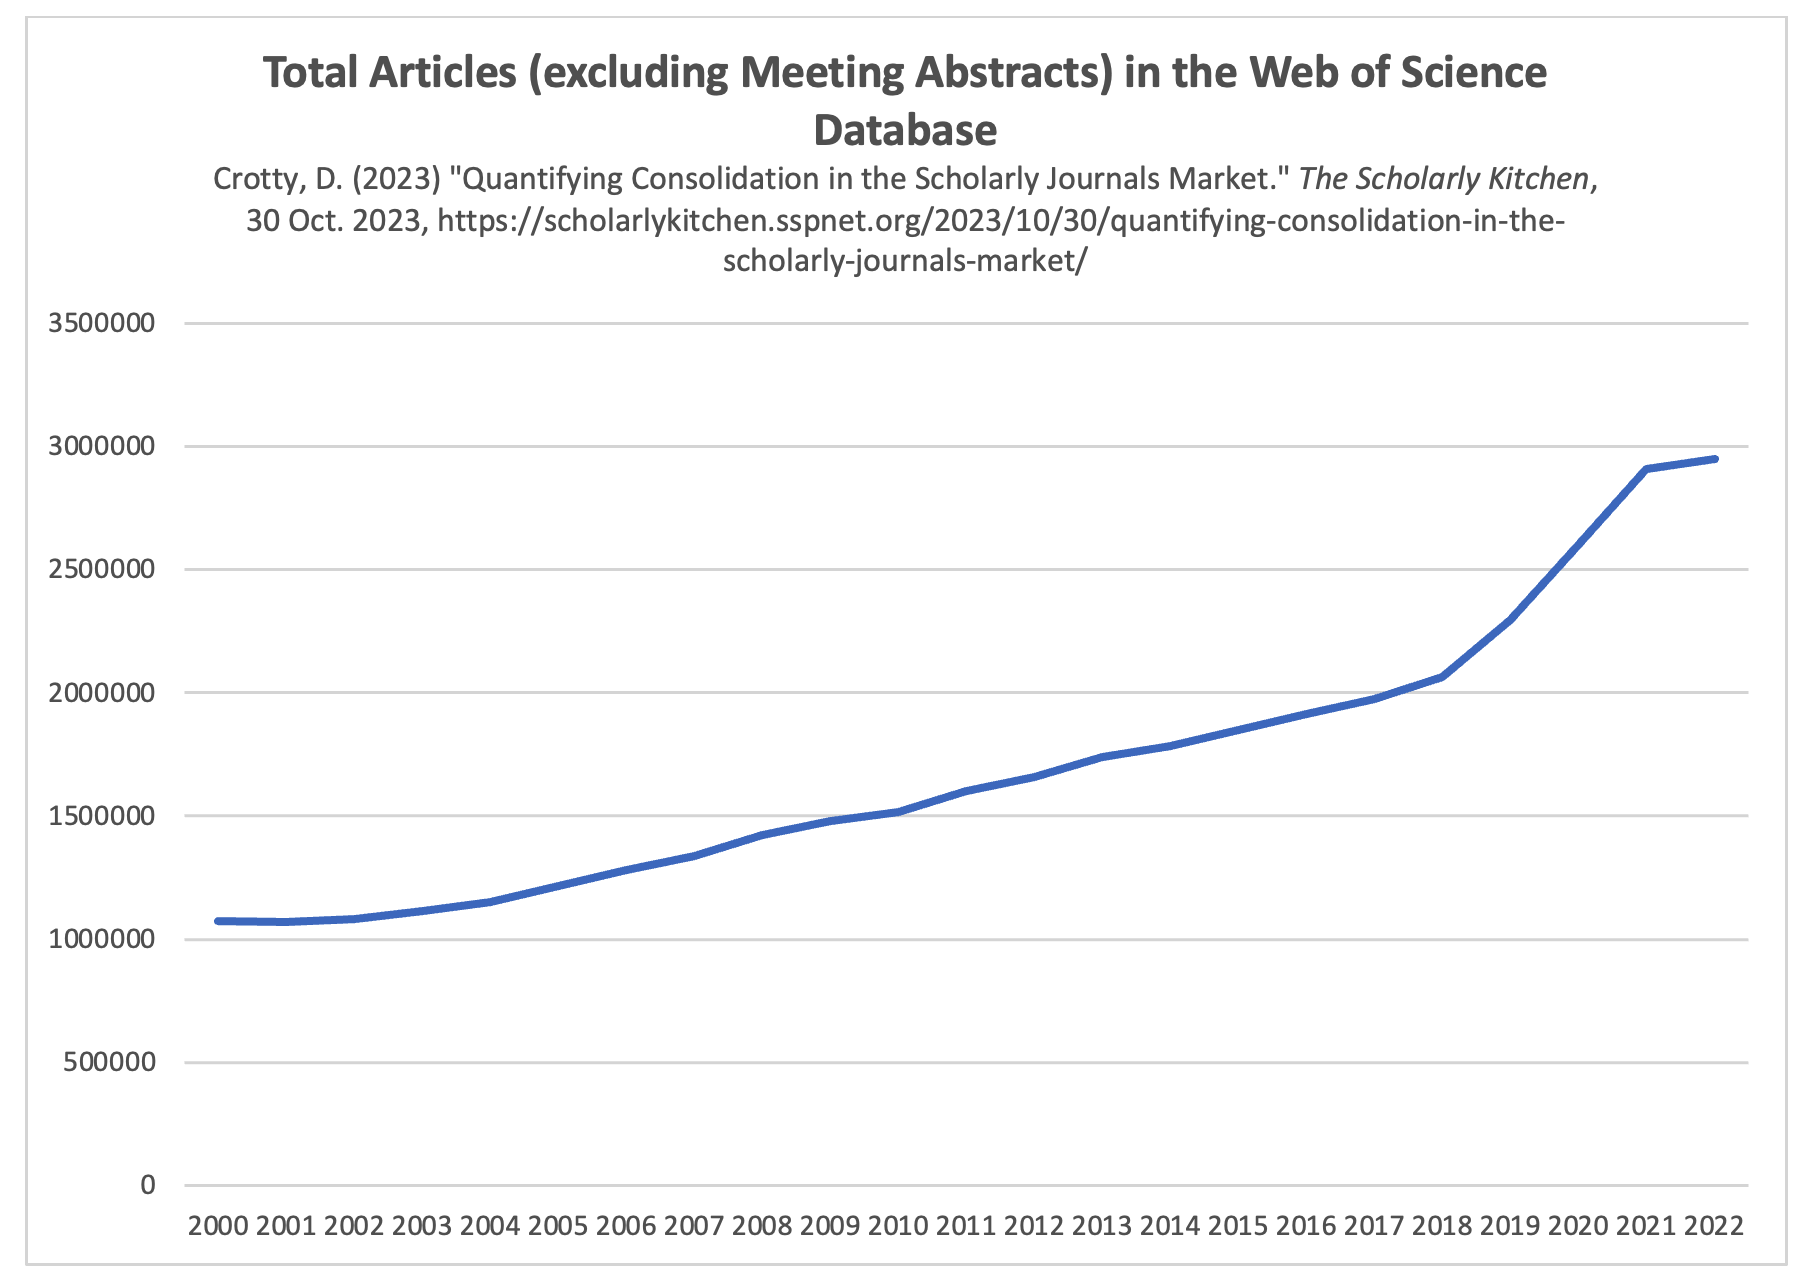
2018 appears to be something of an inflection point. After three straight years of the corpus increasing by around 60,000 articles per year, 2018 saw an increase of more than 90,000 articles, followed by an additional 228,000 in 2019. This was followed by the pandemic years (2020 and 2021) which each saw more than 300,000 additional articles than the previous year. In 2022, the pandemic spike dropped off with only a 42,000-article increase over the previous year. I’ve not uncovered a clear reason for the non-pandemic aspects of this jump, although it has not escaped my attention that 2018 is the year Plan S was launched. It also coincides with significant publication volume growth from MDPI and a big jump in the publication of special issues by MDPI and Frontiers.
Quantifying Consolidation
With a set of measurements for the size of the WoS corpus between 2000 and 2022, I then sought to measure consolidation through determining how much of that corpus could be found in the 5 largest (by article volume), the 10 largest, and the 20 largest publishers each year.
The percentages of the WoS corpus encompassed by the 5, 10, and 20 biggest publishers each year can be seen below in Figure 2.
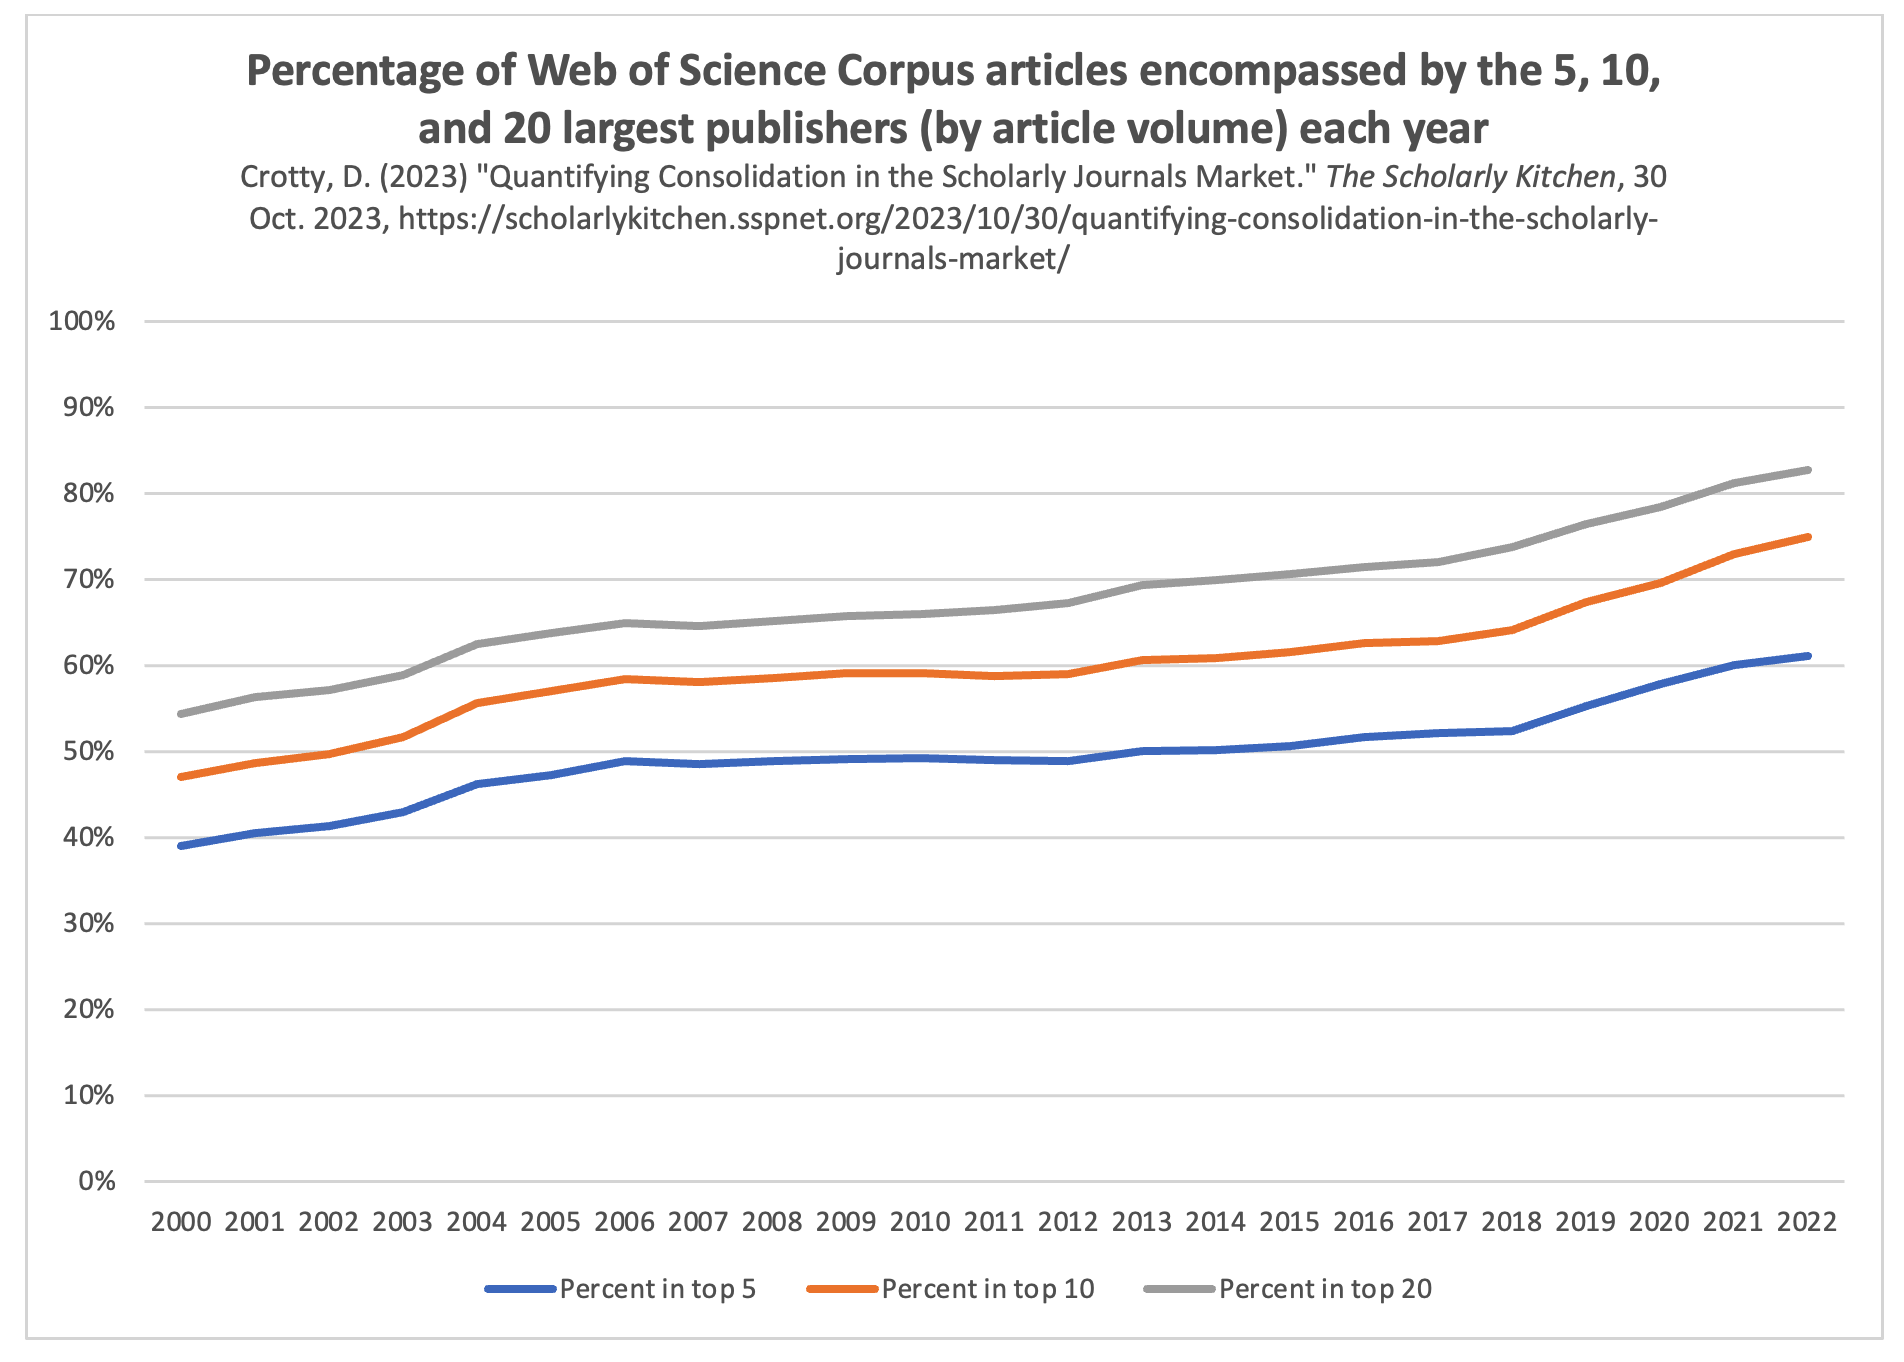
Overall, the market has significantly consolidated since 2000 — when the top 5 publishers held 39% of the market of articles to 2022 where they control 61% of it. Looking at larger sets of publishers makes the consolidation even more extreme, as the top 10 largest publishers went from 47% of the market in 2000 to 75% in 2023, and the top 20 largest publishers from 54% to controlling 83% of the corpus.
These data show two main waves of market consolidation. The first wave aligns with the rise of The Big Deal journal subscription package model, roughly 2000 to 2006. During this period, it became increasingly difficult to remain independent, as large journal packages began to swallow up more and more of each library’s budget. Getting into a Big Deal package provided financial stability as independent journals became much easier for libraries to cancel than large packages of hundreds or thousands of journals. Over this period, the top 5 largest publisher increased their share of the market from 39% to 49%, the top 10 largest increased from 47% to 58%, and the top 20 from 54% to 65%.
After that, there was a period of relative stability. From 2006 through 2018, there was only minor movement toward consolidation. The largest 5 publishers’ share remained fairly stable, moving from 49% in 2006 to 52% in 2018. On a larger scale though, the largest 10 publishers grew from 58% to 64% and the largest 20 from 65% to 74% — significant growth but still less than the previous (and shorter) 6 year period. This period of stability encompasses both the 2013 US Office of Science and Technology Policy (OSTP) Holdren Memo public access policy and the 2013 RCUK (now UKRI) OA policy. The 12-month embargo of the Holdren Memo and the relatively small percentage of the literature that fell under RCUK seem to have reduced their impact on market consolidation, which climbed 2% (top 5), 3% (top 10), and 5% (top 20) in the five years after their implementation.
The next wave of market consolidation began in 2018 and continues through the present day, presumably driven by the rise of OA due to new funder regulations. In a mere four years (2018 to 2022), the percentage of the market controlled by the 5 largest publishers has leaped from 52% to 61%, the 10 largest from 64% to 75%, and 20 largest from 74% to 83%. As 2018 turned into 2019, when I declared that we had entered “The Great Acceleration,” I was clearly on to something.
Unintended Consequences
The dominant business models for OA are volume based and reward scale, driving the biggest companies to get bigger, and smaller organizations to seek the shelter of a larger partner. Publication volume is the essential measurement of success in an author-pays OA market. Transformative agreements (aka, the “Bigger Big Deal”) have become the preferred purchasing model for journals, again favoring scale, because the resource-intensiveness required to negotiate and administer such deals leads to the benefits accruing to large publishers with large numbers of journals for researchers and scholars to publish in.
Though it was clearly not the intention of cOAlition S to consolidate market power in the hands of a small number of large commercial organizations, this is an unfortunate result of forcing the market into a rapid state of change rather than allowing amore measured evolution. As the biggest publishers continue their rapid pace of merging, acquiring new partners, launching new journals, and growing their existing journals, it’s unlikely this trend will slow any time soon.
Please Check My Work!
I would greatly appreciate any insights that bibliometricians and other analysts can add. The spreadsheet behind these charts can be downloaded here. Is there a better way to measure/track market consolidation? Do you see other trends or other reasons for the various shifts? Let me know below in the Comments, thanks!
[ad_2]