Unmanned Aircraft Systems in Road Assessment: A Novel Approach to the Pavement Condition Index and VIZIR Methodologies
[ad_1]
1. Introduction
Unmanned Aircraft Systems (UAS or drones) have become present in many industries in the field for their low cost of operation compared to traditional tools and their ability to simplify tasks without compromising quality and reliability [1]. When compared to other technologies and the final cost of operation, UAS performs better because it can reduce time spent in the field, increase the productivity of the team by providing data faster and effectively, and reduce the cost of the overall operation by completing the job with fewer resources [2].
UAS have been used widely in different fields, both outside and inside engineering. From package delivery to search and rescue operations, UAS have proven effective in helping human operators in tasks that can be dangerous, take longer, and put people outside the operation at risk [3]. In addition, it can allow the operator to spend time effectively on tasks that require complex thinking based on the collected data, such as post-processing or decision-making.
The technology has been widely spread across multiple fields, from water resources in applications that monitor damns [4] to construction in site projection [5], geomatics in developing digital twin models for further analysis [6], surveying in the development of digital terrain models [7], inspection in crack detection [8], and many more. UAS technology has proven to be an effective tool in data collection combined with other consolidated techniques that guarantee job quality in many fields. The literature has multiple studies that demonstrate that the technology has been adequate in their respective fields. Still, there are no comprehensive standards for successful operations for particular applications. In those cases, the researchers must validate their models before providing meaningful conclusions for future applications.
1.1. Pavement Maintenance
Roads are essential to everyday operations in our communities. Roads keep us connected, provide a way to transport goods, mobilize people to provide services, bring people together, and directly impact the economy. As an example of their presence, there are 4.19 million miles of road in the United States [9], 600,000 miles in France [10], 128,000 miles in Colombia [11], and 1.95 million miles in South America in general [11], connecting communities and their services.
Pavement is the surface on the road intended to receive traffic, such as vehicles or people. Pavement can be classified based on how loads are distributed (flexible or rigid), by material (concrete, asphalt, or composite), or by application (pervious and porous) [12]. Given their importance in roads, pavements need to guarantee their service throughout the life they were designed for.
In general, pavement quality is guaranteed by proper maintenance. Maintenance operations are critical to detect any deterioration in this structure that can pose a risk to its users. Cracks, potholes, and debris are among the most common defects found in a pavement structure [13]. Maintenance has also been found to be cheaper in guaranteeing connectivity compared to the alternative of reconstructing the road earlier than expected when it is severely damaged [14]. In addition, maintenance can prevent damage to the vehicles of road users by providing timely repair operations.
1.2. PCI Methodology
The Pavement Condition Index (PCI) is a numerical scale, ranging from 0 to 100, used to assess the general condition of pavements [15]. Developed by the U.S. Army Corps of Engineers and presented in ASTM D6433-23 [15], this tool provides a systematic and objective way to evaluate and record the distress observed on pavement surfaces over time. The PCI estimates the degree and type of cracking, surface deficiencies, and other factors based on visual observations. The calculated index assists municipalities, engineers, and transportation agencies in making informed pavement maintenance and rehabilitation decisions. A higher PCI value indicates a better pavement condition, while a lower value signals a need for repair or replacement. In some countries, PCI has been commonly used for rigid types of pavements, even though the methodology applies to most pavements [16].
1.3. VIZIR Methodology
The Visión Inspection de Zones et Itinéraires Á Risque (VIZIR) methodology, stemming from French practices, offers a systematic approach to evaluating the surface conditions of pavements [17]. As with PCI, VIZIR aims to provide transportation agencies and municipalities with an objective metric for assessing road wear, damage, and overall quality. VIZIR allows the quantification of the damage by type and category and provides the length and severity per section of the road. VIZIR serves as an instrumental tool in extending the lifespan of roadways and ensuring optimal resource allocation. The VIZIR methodology considered in this paper is the adaptation developed by the Colombian Department of Transportation in INV E-813-13 [18]. The numbers resulting from VIZIR analysis represent a quantified assessment of pavement damage, where each value corresponds to a specific type and severity of distress. Lower numbers typically indicate minor or negligible damage, while higher numbers reflect more severe deterioration.
1.4. PCI and VIZIR Comparison
From the analysis in the literature summarized in Table 1, the methodologies PCI and VIZIR are similar in terms of application and minimum requirements before execution. This allows for comparing results by applying both methodologies without the use of any additional technologies and as a benchmark for comparison using new technologies (UAS) for data collection.
1.5. Photogrammetry in Road Assessment
Photogrammetry, the use of pictures in surveying and mapping to measure distances, has been used in road assessment since the last century. State agencies have been interested in collecting data records (photos) to analyze pavement for cracking and rutting [20]. These methods now or then incorporate similar technological principles: a device to capture pictures (e.g., cameras) mounted on a vehicle to cover long distances (e.g., van) [21]. More recent frameworks have included navigation units with cameras synchronized with external trigger and laser projectors [22] or mobile Light Detection and Ranging (LiDAR) to monitor highway assets and pavement condition data [23]. The integration of Geographic Information Systems (GIS) and advanced image processing algorithms has further enhanced the capability to analyze and visualize pavement condition data in a more comprehensive and efficient manner [24]. The evolution of road assessment methodologies has taken a significant leap forward in recent years, moving from ground to aerial methods with the incorporation of UAS technology.
1.6. Pavement Maintenance Using UAS
With high-resolution cameras and advanced sensors, UAS can capture detailed aerial imagery of vast stretches of roadways in significantly less time than traditional methods. By flying over roads, highways, or parking lots, they can quickly detect surface defects like cracks, potholes, and scour [25]. With the integration of advanced image processing software, these captured images can be automatically analyzed to quantify and classify pavement distresses, providing a comprehensive view of pavement health [26].
UAS join photogrammetric tools used for road assessment in the literature. However, UAS can provide cheaper solutions in defect detection compared to LiDAR technology, close-range photogrammetry, and systems incorporated with navigation systems when high-quality information is not required [27]. By reducing the need for on-ground manual inspections, UAS increase efficiency and enhance safety by minimizing the exposure of inspection crews to traffic hazards. As technology continues to evolve, the integration of UAS in pavement management systems promises to revolutionize the way road networks are monitored and maintained.
While UAS have shown immense potential in enhancing pavement maintenance practices, a noticeable gap exists in the literature. Most studies have focused on the general capabilities of UAS in various fields, but there is limited comprehensive research addressing their specific use in pavement assessment using standardized methodologies like PCI and VIZIR. Furthermore, there is a lack of detailed exploration of how UAS-acquired data aligns with these methodologies and how it can be effectively integrated into existing pavement management systems. This study seeks to bridge this gap, providing a nuanced understanding of the potential synergies between UAS technology and established pavement assessment methodologies.
1.7. Objectives of This Study
The increasing prevalence of UAS in various industries has shown its potential for efficient and safe operations in diverse applications. This study seeks to delve deeper into one application—pavement assessment in urban roads. The specific objectives of this research are as follows:
-
To investigate the capability and efficiency of UAS in pavement assessment applied to urban roads, specifically in detecting surface defects such as cracks, potholes, and debris. This includes analyzing their ability to capture high-resolution aerial imagery of road sections and comparing it to information collected using traditional methods;
-
To compare the PCI and VIZIR methodologies in the context of UAS-acquired data. While similar, these methodologies offer distinct advantages and have unique procedures and training requirements;
-
To establish benchmarks for using UAS as a technology for data collection in pavement maintenance, thereby understanding its role relative to traditional techniques.
Through these objectives, this study aspires to shed light on the practicality, advantages, and potential challenges of employing UAS in pavement maintenance, setting the stage for a comprehensive and technology-driven approach to sustaining road infrastructure.
2. Materials and Methods
This study was structured in three phases to quantify and analyze pavement pathologies.
In the first phase, pertinent information was gathered by selecting flexible and rigid pavement sections. These sections were initially chosen based on preliminary identification of the roads in the study area, focusing on establishing a sample, including a mix of conditions: good, regular, and poor. This sample was adjusted based on the results of surveys presented to transportation professionals to verify and validate the pavement conditions.
The second phase involved a conventional survey of the pathologies, primarily through a visual inspection conducted in the field applying the VIZIR and PCI methodologies. A designated team was tasked with identifying the types of damage, measuring them, and assigning a severity grade to the identified damages. Concurrently, a UAS was deployed to obtain orthophotos of the designated sections. These orthophotos served to classify and quantify the defects similarly to the first visual inspection.
The final phase was dedicated to data analysis. The objective was to compare the results derived from field measurements with those obtained from the orthophotos, thereby assessing the congruence between the two data collection methods. Figure 1 summarizes the methodology followed in this study.
2.1. Area of Study
The study area was determined by analyzing the municipal government’s road infrastructure maintenance database for urban roads in Santiago de Cali, Colombia. Test sections were chosen based on the presence of pavement pathologies and maintenance or rehabilitation needs. In a reconnaissance tour of the city’s southern urban area, known for housing development and urban expansion, the authors selected five road sections. Each section had been constructed at different times. Selection criteria also included ease of field data collection, visually and via UAS, and rigid and flexible pavement structures exhibiting various pathologies. Table 2 shows the general characteristics of these sections.
2.2. PCI Methodology
The Pavement Condition Index (PCI) method starts by selecting the necessary number of samples (n) to evaluate pavement conditions accurately. This selection is based on a standard equation aiming for a ±5% accuracy in the Pavement Condition Index (PCI) estimate at a 95% confidence level. The samples are chosen systematically throughout the pavement section, with a random starting point.
The next step involves calculating the sampling interval (i), ensuring an even distribution of the samples. Field inspections are then conducted to gather detailed information about the pavement, such as dimensions of deterioration and its severity. These data lead to the computation of damage density or percentage.
The PCI methodology then applies a set of curves to determine the Deduct Value (DV) based on the severity and density of damage. These values help calculate the Corrected Deduct Value (CDV) and the allowable number of deducts (m).
Finally, the PCI is computed by iterating through deduced values and calculating the Corrected Deduct Value (CDV) for each of them. This process involves using specific PCI curves to obtain the final Pavement Condition Index (PCI) score, which is adjusted based on the maximum total deducted value (HDV). Figure 2 provides a visual summary of the PCI methodology. The complete process to follow when applying the PCI methodology is presented in the 2023 version of the standard ASTM D6433-23 [15].
2.3. VIZIR Methodology
The VIZIR methodology defines pavement damage conditions based on the Surface Deterioration Index (ls). This index is calculated from the percentage of affected area over a defined linear length of the road under study. The value is 1 for a perfectly maintained condition and 7 for a completely deteriorated or destroyed flexible pavement structure. VIZIR primarily evaluates two main types of damages: Type A, which considers structural damages based on the pavement’s structural capacity deficiencies, and Type B, which accounts for functional damages related to operational and road safety.
After defining the Deformation Index (Id) and the Cracking Index (If), the next step is determining the Type B damages using a deterioration index associated with structural failures. The calculation of the deterioration index, based on the correlation between Id and If, is presented in Table 3. In addition, Figure 3 summarizes the VIZIR methodology. The complete process to follow when applying the VIZIR methodology is shown in the original standard [17] or in the adaptation developed by the Department of Transportation of Colombia in INV E-813-13 [18].
2.4. General Procedure for Visual Inspection
Two civil engineers with pavement expertise performed a visual field inspection to assess the overall condition of the sections. This process involved documenting observed failures in the study section and measuring relevant parameters. The duration of inspections varied: roads with high deterioration took roughly 40 min, while those in regular or good condition took around 20 min for 100 m (328 ft) sections. Inspection time also depended on traffic flow; high-traffic roads precluded total closures. If a road had multiple lanes, at least one remained open, needing a traffic controller and proper signage.
2.5. UAS Technology and Flight Plan
Using an Unmanned Aircraft System (UAS), specifically the DJI Mavic Air, was fundamental for collecting imagery data. This UAS is equipped with a 1/2.3” CMOS sensor capable of capturing 12 MP images, with a lens offering a wide 85° field of view, an f/2.8 aperture, and a shooting range from 0.5 m. The UAS also incorporates sensors to enhance its flight stability: infrared sensing system for precise hovering and landing, inertial measurement unit (IMU) with accelerometers and gyroscopes, and global position system (GPS) for navigation. Figure 4 illustrates the UAS used in this study.
The procedure for data acquisition involved planned flights over the study area created automatically using flight planning software—Pix4D—with a frontal (along-track) and lateral (cross-track) overlap of 80%, as presented in Figure 5. The overlap was chosen to be higher than the recommended by the literature (70%) [28] and based on past flight experience from the authors. Lower overlap would reduce image quality for post-processing applications.
The UAS was flown at altitudes ranging between 3.00 m and 5.00 m (9.84 ft–16.40 ft). The DJI Mavic Air’s camera has the following specifications: the sensor width of the camera is 6.16 mm (actual width size obtained from 1/2.3” and not a direct inch-to-millimeter conversion [29]), the focal length of the camera is 4.5 mm (most sources list it as 24 mm, but this is an equivalent measure for the 35 mm/full frame [30]), and a maximum resolution of 4056 × 3040 pixels [31]. The projected ground sample distance (GSD) based on the previous parameters was 0.10 cm per pixel for 3 m and 0.17 cm per pixel for 5 m. The achieved GSD was 0.11 and 0.18 cm/pixel, respectively. Higher altitudes would increase GSD and reduce image quality.
The systematic flight plan also allowed for the collection of images with significant overlap, a crucial factor for the orthomosaic development and analysis. The orthomosaic was used to obtain measurements such as perimeter, area, volume, and dimensions of observed features. Flight planning was crucial to ensure comprehensive coverage and optimal image quality. The photogrammetric process included digital surface modeling and image processing using the pavement surface pictures captured by the UAS.
The UAS flights were conducted under favorable weather conditions to minimize potential disturbances and ensure stable flight operations. Additionally, the UAS’ onboard camera settings were fine-tuned for optimal image capture. The camera’s focus, exposure, and white balance were adjusted to suit the ambient lighting conditions, ensuring the captured images were clear, well-lit, and detailed. No additional focal length or lens was considered to provide a general framework, which is available in most cases.
2.6. UAS Inspection: PCI and VIZIR
The UAS inspection process started with the creation of the mission file with the geographic information. Ground control points were placed in the study area. Ground control allows for improved efficiency in the execution of the flight plan and geolocation. The control points were distributed evenly across the project area to ensure consistent measurements, and checkpoints were selected to test the measurement differences across the flight path. Finally, post-processing was conducted using the data collected to produce orthophotos that allow for 2D measurements. This process involved measurements of various pathologies, as presented in the Results and Discussion section. This step enabled the determination of relevant measures, showcasing the significant advantage of UAS-based inspection over manual methods in coverage and efficiency. Figure 6 presents a flight plan over the study area.
3. Results and Discussion
The information was analyzed using visual and UAS inspection’s VIZIR and PCI methodologies. Figure 7 shows an example of a pavement section captured during a traditional visual inspection. Figure 8 shows orthophotos generated using images captured by the UAS.
Despite the differences between the measurements taken in the field and those taken from the orthophoto, it can be observed that the qualifications of the state of the roads were the same using the two methods (visual inspection and UAS). It is important to emphasize that, even if the final condition was the same, the PCI presented a slight difference between the qualifications evaluated with the data in the field and the information from the orthophotos, as shown in Table 4.
The observed difference comes from the methodology used in measuring field deteriorations. Considering the reliability of data obtained from UAS and the measurements in the orthophotos, it can be seen that the photogrammetrically derived from UAS VIZIR and PCI assessment offer a comprehensive review of the road’s condition. Figure 9 compares the measuring procedure (red dotted line) of a pavement section measured in the field (left) and using computational measuring tools on an image captured by a UAS (right).
3.1. PCI Methodology Comparison: Visual vs. UAS
A significant limitation of the PCI methodology is the time-consuming nature of field data collection. Visual inspections of road sections require meticulous individual measurements of each typology, accurate recording of these measurements, and ensuring proper photographic documentation. Table 5 compares field data collection with UAS-based data collection.
The data in Table 6 reveal distinctions and similarities between field and UAS inspections for various road defects. This table objectively contrasts the measures obtained from both methods, particularly concerning defects such as disintegration, crack blocks, and shrinkage in section RS1, and separation joints, patches, and longitudinal cracks in RS2. For instance, the UAS recorded a 12.50% decrease in disintegration for RS1, compared to field measurements, while for RS2, it showed a notable 24.80% increase in patch area. The percentage differences, marked as increases (+) or decreases (−), highlight the precision of UAS-based measurements compared to traditional field methods. The shrinkage in RS1 and longitudinal cracks in RS2, both showing over 6% increase in UAS measurements, highlight the enhanced detail capture of UAS inspections.
3.2. VIZIR Methodology Comparison: Visual vs. UAS
The comparative analysis in Table 7 highlights the discrepancies between field and UAS inspections concerning various pavement defects. This table methodically presents the differences in measurements for defects like aggregate polishing, bumps, longitudinal cracks, surface wear, and crocodile skin across different sections. Notably, in section FS1, UAS inspection revealed a 2.30% increase in aggregate polishing and a 4.40% increase in bump measurements compared to field data. In contrast, section FS2 exhibited significant variations, with a 33.10% increase in surface wear and a 16.00% decrease in bumps as measured by the UAS. The most striking difference is observed in the crocodile skin defect in FS2, where UAS inspection recorded a 42.40% increase. These variances, denoted as either increases (+) or decreases (−) in percentage, demonstrate UAS inspections’ detailed and nuanced perspective over traditional field methods. The data from Table 7 emphasize the enhanced ability of UAS-based assessments to capture the extent and severity of various pavement defects, offering a more comprehensive view of the pavement condition that might be less perceptible in standard field inspections.
Figure 10 offers a visual representation of the defect measurements captured by both field and UAS inspections, as outlined in Table 6 and Table 7. The scatter plot clearly shows the comparison across various defects such as disintegration, crack blocks, and shrinkage for sections RS1 and RS2, as well as aggregate polishing, bumps, and crocodile skin for sections FS1, FS2, and FS3. Notably, the UAS measurements for disintegration in section RS1 and patch areas in RS2 appear slightly lower than field measurements, indicating a more conservative estimation of affected areas. However, UAS data for surface wear and crocodile skin, especially in section FS2, exhibit a higher value, suggesting that UAS may capture a broader extent of these defects. The data points for longitudinal cracks and bumps also demonstrate proximity between the two methods, with UAS data providing a marginally increased quantification in most cases. This graphical analysis underscores the meticulous detail offered by UAS inspections, which can enhance or contrast the field data, providing a nuanced perspective on road surface conditions.
3.3. PCI and VIZIR Applied to Urban Roads
In evaluating road conditions using VIZIR and PCI methods, we encounter several challenges when applied to urban roads. Some considerations can be addressed by incorporating UAS technology, but others require additional efforts. Some considerations are summarized below:
-
Data collection process: Urban road inspections require meticulous, time-consuming visual checks. Every defect needs individual measurement and photographic documentation, a task that becomes more arduous with extensive wear and tear. UAS can help speed up this process and allow better allocation of time to decision-making processes.
-
Traffic disruption: Inspections often necessitate traffic closures, introducing logistical complications and safety risks for the inspection teams, particularly in areas with high traffic volume. UAS still require some closures, but the process is faster and reduces the risk for the inspection team.
-
Inspection methods to discriminate normal wear and tear from pavement damage: VIZIR is designed to assess structural damage typically caused by heavy vehicles. However, urban streets predominantly experience lighter traffic from personal cars and public transportation. This difference means that the wear and tear observed on urban roads do not necessarily indicate structural failures. More information than the UAS assessment is needed before obtaining the pavement condition.
-
“Segment by segment” construction in urban settings: Roads often consist of segments built at different times, using varied materials, and constructed by multiple companies. This diversity in construction history adds complexity to the inspection process, as each segment may exhibit unique wear patterns and vulnerabilities not uniformly applicable across the entire road network. UAS can provide the current pavement condition, but a detailed post-processing will guide necessary actions after detecting a defect.
-
Environmental conditions: Pavement assessment can be interrupted by multiple environmental conditions: rain, snow, sleet, freezing, or high temperature, among others. UAS will have the same experience under these conditions and follow the same criteria for when the inspection needs to be stopped. However, other environmental factors must be considered when UAS takes pictures during inspection: water reflectivity after rain, snow covering portions of the pavement, foreign object debris in the road (vegetation, animals, etc.), and even shadows from surrounding objects. Under these circumstances, UAS must be accompanied by a team and equipment that can mitigate the effect of this outside variable in the inspection process.
Considering these limitations, it is imperative to consider further approaches and incorporate them in everyday inspections. This could mean modifying existing methods to better align with the nuances of urban environments or embracing innovative technologies, like UAS usage, to facilitate more efficient and less intrusive data collection.
3.4. Proposed Modifications to PCI and VIZIR Methodologies
This research introduces modifications to the Pavement Condition Index (PCI) and VIZIR methodologies to improve the measuring method and efficiency in assessing urban infrastructure. A significant innovation is the integration of UAS into pavement assessment methods. UAS utilization markedly enhances the data collection process, offering more detailed and comprehensive evaluations of pavement conditions than traditional on-ground measurements.
This study also highlights discrepancies between PCI scores from field measurements and those derived from UAS-captured orthophotos, as seen in Figure 10. This difference underscores the improved precision of photogrammetry-based data in reflecting the condition of roadways. Although the PCI method effectively assesses structural and functional damage, it exhibits limitations in its current application to local and collector roads. Interestingly, while the overall condition rating may be similar, data from photogrammetry provide a comprehensive representation of the pavement’s actual state.
The authors suggest dividing the road network into distinct segments to tackle the uniformity issues in assessing local and collector roads. This strategy would allow for more precise, pertinent data collection, leading to a thorough understanding of the varied conditions across different road sections. These proposed modifications aim to enhance the precision and applicability of PCI and VIZIR methodologies in urban settings. Integrating advanced technologies like UAS and segmenting road networks for targeted analysis can provide more reliable and actionable insights for pavement condition assessment and maintenance planning.
4. Conclusions and Recommendations
This research study underscores the efficacy of photogrammetry, facilitated by UAS, as a viable alternative. This technology offers a blend of quantitative and qualitative analysis, enabling a more comprehensive assessment of pavement damages. Integrating UAS into pavement condition assessment has proven to provide a comprehensive assessment and significantly reduce the time and resources required for field inspections. Furthermore, this approach minimizes safety risks associated with on-ground inspections, especially in high-traffic urban areas.
This study highlights the inherent limitations of the VIZIR and PCI methodologies in assessing urban road conditions. The VIZIR method, although robust, struggles with efficient data collection over extensive road networks and cannot account for functional damages in its assessments. Similarly, the PCI method faces challenges in data collection efficiency, particularly in urban environments where traffic and logistical constraints complicate field inspections. Both methods face challenges when incorporated in urban settings that need to be studied in future work; these challenges include the data collection process, traffic disruption, differentiating damage from wear and tear, segmented construction, and environmental conditions.
This study recommends the adoption of UAS-assisted photogrammetry as a standard practice in urban infrastructure management. It offers a scalable, efficient, cost-effective pavement condition assessment solution. Future research should focus on refining the integration of UAS technology with existing pavement assessment methodologies, establishing standardized protocols, and exploring the potential of machine learning and artificial intelligence in automating damage detection and classification. These advancements will pave the way for more proactive and preventive maintenance strategies, ultimately contributing to the longevity and safety of urban road networks. Furthermore, this study did not use different height configurations, cross-flights, convergent photography, GIS integration, and AI detection approaches since the objective was to provide a faster and readily available framework for implementation. However, future research should explore this flight configuration and how they could improve certain parameters in this study.
In addition, future research should explore the implications of using UAS technology in urban infrastructure regarding public regulation. For example, the Federal Aviation Administration of the United States regulates flying over people, flights at night, and operations within restricted airspace. Infrastructure owners will have to navigate the legal environment and work with regulatory agencies to provide seamless integration in urban roads.
Finally, the VIZIR methodology considers defects that compromise the pavement’s structural integrity, also known as structural defects. However, the methodology does not consider defects that affect the pavement’s performance or efficiency without necessarily compromising its structural integrity, also known as functional defects. These defects can affect the pavement’s condition and, if considered in the assessment, can decrease the rating condition. Future work should address functional defects and adapt the methodology to include their effects in the analysis.
Author Contributions
Conceptualization, D.M.O.R. and J.A.P.C.; Formal Analysis, D.M.O.R., J.A.P.C. and M.A.R.M.; Methodology, D.M.O.R., J.C.S. and J.A.P.C.; Validation, D.M.O.R., J.C.S., J.A.P.C. and M.A.R.M.; Writing—Original Draft, D.M.O.R., J.C.S., J.A.P.C. and M.A.R.M.; Writing—Review and Editing, J.C.S. and M.A.R.M. All authors have read and agreed to the published version of the manuscript.
Funding
This research received no external funding.
Data Availability Statement
Data are available upon reasonable request.
Acknowledgments
The authors appreciate the support of the Pontificia Universidad Javeriana Cali through the Research Seedbeds in Sustainable Intermodal Infrastructure and Mobility Organization (SIIMON) and Construction Materials (MATCON). Publication of this article was funded in part by Purdue University Libraries Open Access Publishing Fund.
Conflicts of Interest
The authors declare no conflicts of interest.
References
- Shi, W.; Zhou, H.; Li, J.; Xu, W.; Zhang, N.; Shen, X. Drone Assisted Vehicular Networks: Architecture, Challenges and Opportunities. IEEE Netw. 2018, 32, 130–137. [Google Scholar] [CrossRef]
- Paucar, C.; Morales, L.; Pinto, K.; Sánchez, M.; Rodríguez, R.; Gutierrez, M. Use of Drones for Surveillance and Reconnaissance of Military Areas. In Developments and Advances in Defense and Security; Rocha, Á., Guarda, T., Eds.; Smart Innovation, Systems and Technologies; Springer International Publishing: Cham, Switzerland, 2018; pp. 119–132. Volume 94. [Google Scholar] [CrossRef]
- Kellermann, R.; Biehle, T.; Fischer, L. Drones for parcel and passenger transportation: A literature review. Transp. Res. Interdiscip. Perspect. 2020, 4, 100088. [Google Scholar] [CrossRef]
- Zhu, Y.; Tang, H. Automatic Damage Detection and Diagnosis for Hydraulic Structures Using Drones and Artificial Intelligence Techniques. Remote Sens. 2023, 15, 615. [Google Scholar] [CrossRef]
- Nwaogu, J.M.; Yang, Y.; Chan, A.P.C.; Chi, H. Application of drones in the architecture, engineering, and construction (AEC) industry. Autom. Constr. 2023, 150, 104827. [Google Scholar] [CrossRef]
- Kikuchi, N.; Fukuda, T.; Yabuki, N. Future landscape visualization using a city digital twin: Integration of augmented reality and drones with implementation of 3D model-based occlusion handling. J. Comput. Des. Eng. 2022, 9, 837–856. [Google Scholar] [CrossRef]
- Cledat, E.; Jospin, L.V.; Cucci, D.A.; Skaloud, J. Mapping quality prediction for RTK/PPK-equipped micro-drones operating in complex natural environment. ISPRS J. Photogramm. Remote Sens. 2020, 167, 24–38. [Google Scholar] [CrossRef]
- Jimeno, S.P.; Salinas, J.C.; Caicedo, J.A.P.; Manzano, M.A.R. An integrated framework for non-destructive evaluation of bridges using UAS: A case study. J. Build. Pathol. Rehabil. 2023, 8, 80. [Google Scholar] [CrossRef]
- ARTBA. The American Road & Transportation Builders Association (ARTBA)—FAQ. The American Road & Transportation Builders Association (ARTBA). Available online: https://www.artba.org/about/faq/ (accessed on 11 October 2023).
- Length of Roads by Type France. Statista. Available online: https://www.statista.com/statistics/759437/length-roads-by-road-type-france/ (accessed on 11 October 2023).
- Transport and Infrastructure in Colombia. Available online: https://www.worlddata.info/america/colombia/transport.php (accessed on 11 October 2023).
- Hamim, O.F.; Aninda, S.S.; Hoque, M.S.; Hadiuzzaman, M. Suitability of pavement type for developing countries from an economic perspective using life cycle cost analysis. Int. J. Pavement Res. Technol. 2021, 14, 259–266. [Google Scholar] [CrossRef]
- Common Asphalt Pavement Defects and Their Causes. Pavement Management Services. Available online: https://www.pavement.com.au/news/common-asphalt-pavement-defects-and-their-causes (accessed on 11 October 2023).
- Gu, W.; Ouyang, Y.; Madanat, S. Joint optimization of pavement maintenance and resurfacing planning. Transp. Res. Part B Methodol. 2012, 46, 511–519. [Google Scholar] [CrossRef]
- E17 Committee. Practice for Roads and Parking Lots Pavement Condition Index Surveys; ASTM International: West Conshohocken, PA, USA, 2023. [Google Scholar] [CrossRef]
- Sosa, G.C.; Oyola, L.V.; Torres Ortega, R. Indice de Condición del Pavimento Rígido en la Ciudad de Cartagena De Indias y Medidas de Conservación. Caso Estudio: Carrera 1 ra del Barrio Bocagrande; Torres Ortega, R., Ed.; Universidad de Cartagena: Cartagena de Indias, Colombia, 2017. [Google Scholar] [CrossRef]
- Autret, P. Vizir-methode assistee par ordinateur pour l’estimation des besoins en entretien d’un reseau routier. In Techniques et Methodes des Laboratoires des ponts et Chaussees; Laboratoire Central des Ponts et Chausees (LCPC): Paris, France, 1991. [Google Scholar]
- INVIAS. Determination of the Surface Deterioration Index of an Asphalt Pavement Using the VIZIR Method. 2013. Available online: https://www.invias.gov.co/index.php/archivo-y-documentos/documentos-tecnicos/7713-manual-de-mantenimiento-de-carreteras-2016-v1/file (accessed on 10 November 2023).
- Papageorgiou, G. Appraisal of Road Pavement Evaluation Methods. J. Eng. Sci. Technol. Rev. 2019, 12, 158–166. [Google Scholar] [CrossRef]
- Hintz, R.; Degner, J.; Ruth, B.; Karakadas, C. Construction and Statistical Evaluation of a Computerized Photologging System for Identification and Measurement of Pavement Cracking; Final Report No. FL/DOT/BMR/88-315; Florida University: Gainesville, FL, USA, 1988. [Google Scholar]
- Hintz, R.; Karakadas, C.; Kang, J.-M. Analysis of pavement cracking and rutting using close-range phtography. Photogramm. Eng. Remote Sens. 1989, 55, 217–221. [Google Scholar]
- Kertész, I.; Lovas, T.; Barsi, A. Photogrammetric pavement detection system. Int. Arch. Photogramm. Remote Sens. Spat. Inf. Sci. 2008, 37, 897–902. [Google Scholar]
- Farhadmanesh, M.; Cross, C.; Mashhadi, A.H.; Rashidi, A.; Wempen, J. Highway Asset and Pavement Condition Management using Mobile Photogrammetry. Transp. Res. Rec. 2021, 2675, 296–307. [Google Scholar] [CrossRef]
- Marzolff, I.; Poesen, J. The potential of 3D gully monitoring with GIS using high-resolution aerial photography and a digital photogrammetry system. Geomorphology 2009, 111, 48–60. [Google Scholar] [CrossRef]
- Mineta Transportation Institute. Pavement Condition Survey Using Drone Technology. Available online: https://transweb.sjsu.edu/research/2202-Pavement-Condition-Survey-Drones (accessed on 16 November 2023).
- Chen, C.; Chandra, S.; Han, Y.; Seo, H. Deep Learning-Based Thermal Image Analysis for Pavement Defect Detection and Classification Considering Complex Pavement Conditions. Remote Sens. 2022, 14, 106. [Google Scholar] [CrossRef]
- Dong, D.; Li, Z. Smartphone Sensing of Road Surface Condition and Defect Detection. Sensors 2021, 21, 5433. [Google Scholar] [CrossRef]
- Aero, P. Five Points You Should Know about Drone Data Accuracy. Propeller. Available online: https://www.propelleraero.com/five-points-you-should-know-about-drone-data-accuracy/ (accessed on 3 March 2024).
- Digital Camera Database. Digital Camera Sensor Sizes. Sensor Sizes. Available online: https://www.digicamdb.com/sensor-sizes/ (accessed on 5 March 2024).
- Pilots, M. Need to Calculate Camera Values. DJI Mavic, Air & Mini Drone Community. Available online: https://mavicpilots.com/threads/need-to-calculate-camera-values.41359/ (accessed on 5 March 2024).
- DJI Photo Academy. Image Size 4:3, 3:2 or 16:9 for Drone Photography? DJI Aerial Photo Academy. Available online: https://djiphotoacademy.com/image-size-43-32-or-169-for-drone-photography/ (accessed on 5 March 2024).
Figure 1.
Methodology followed in this study for phases I, II, and III.
Figure 1.
Methodology followed in this study for phases I, II, and III.
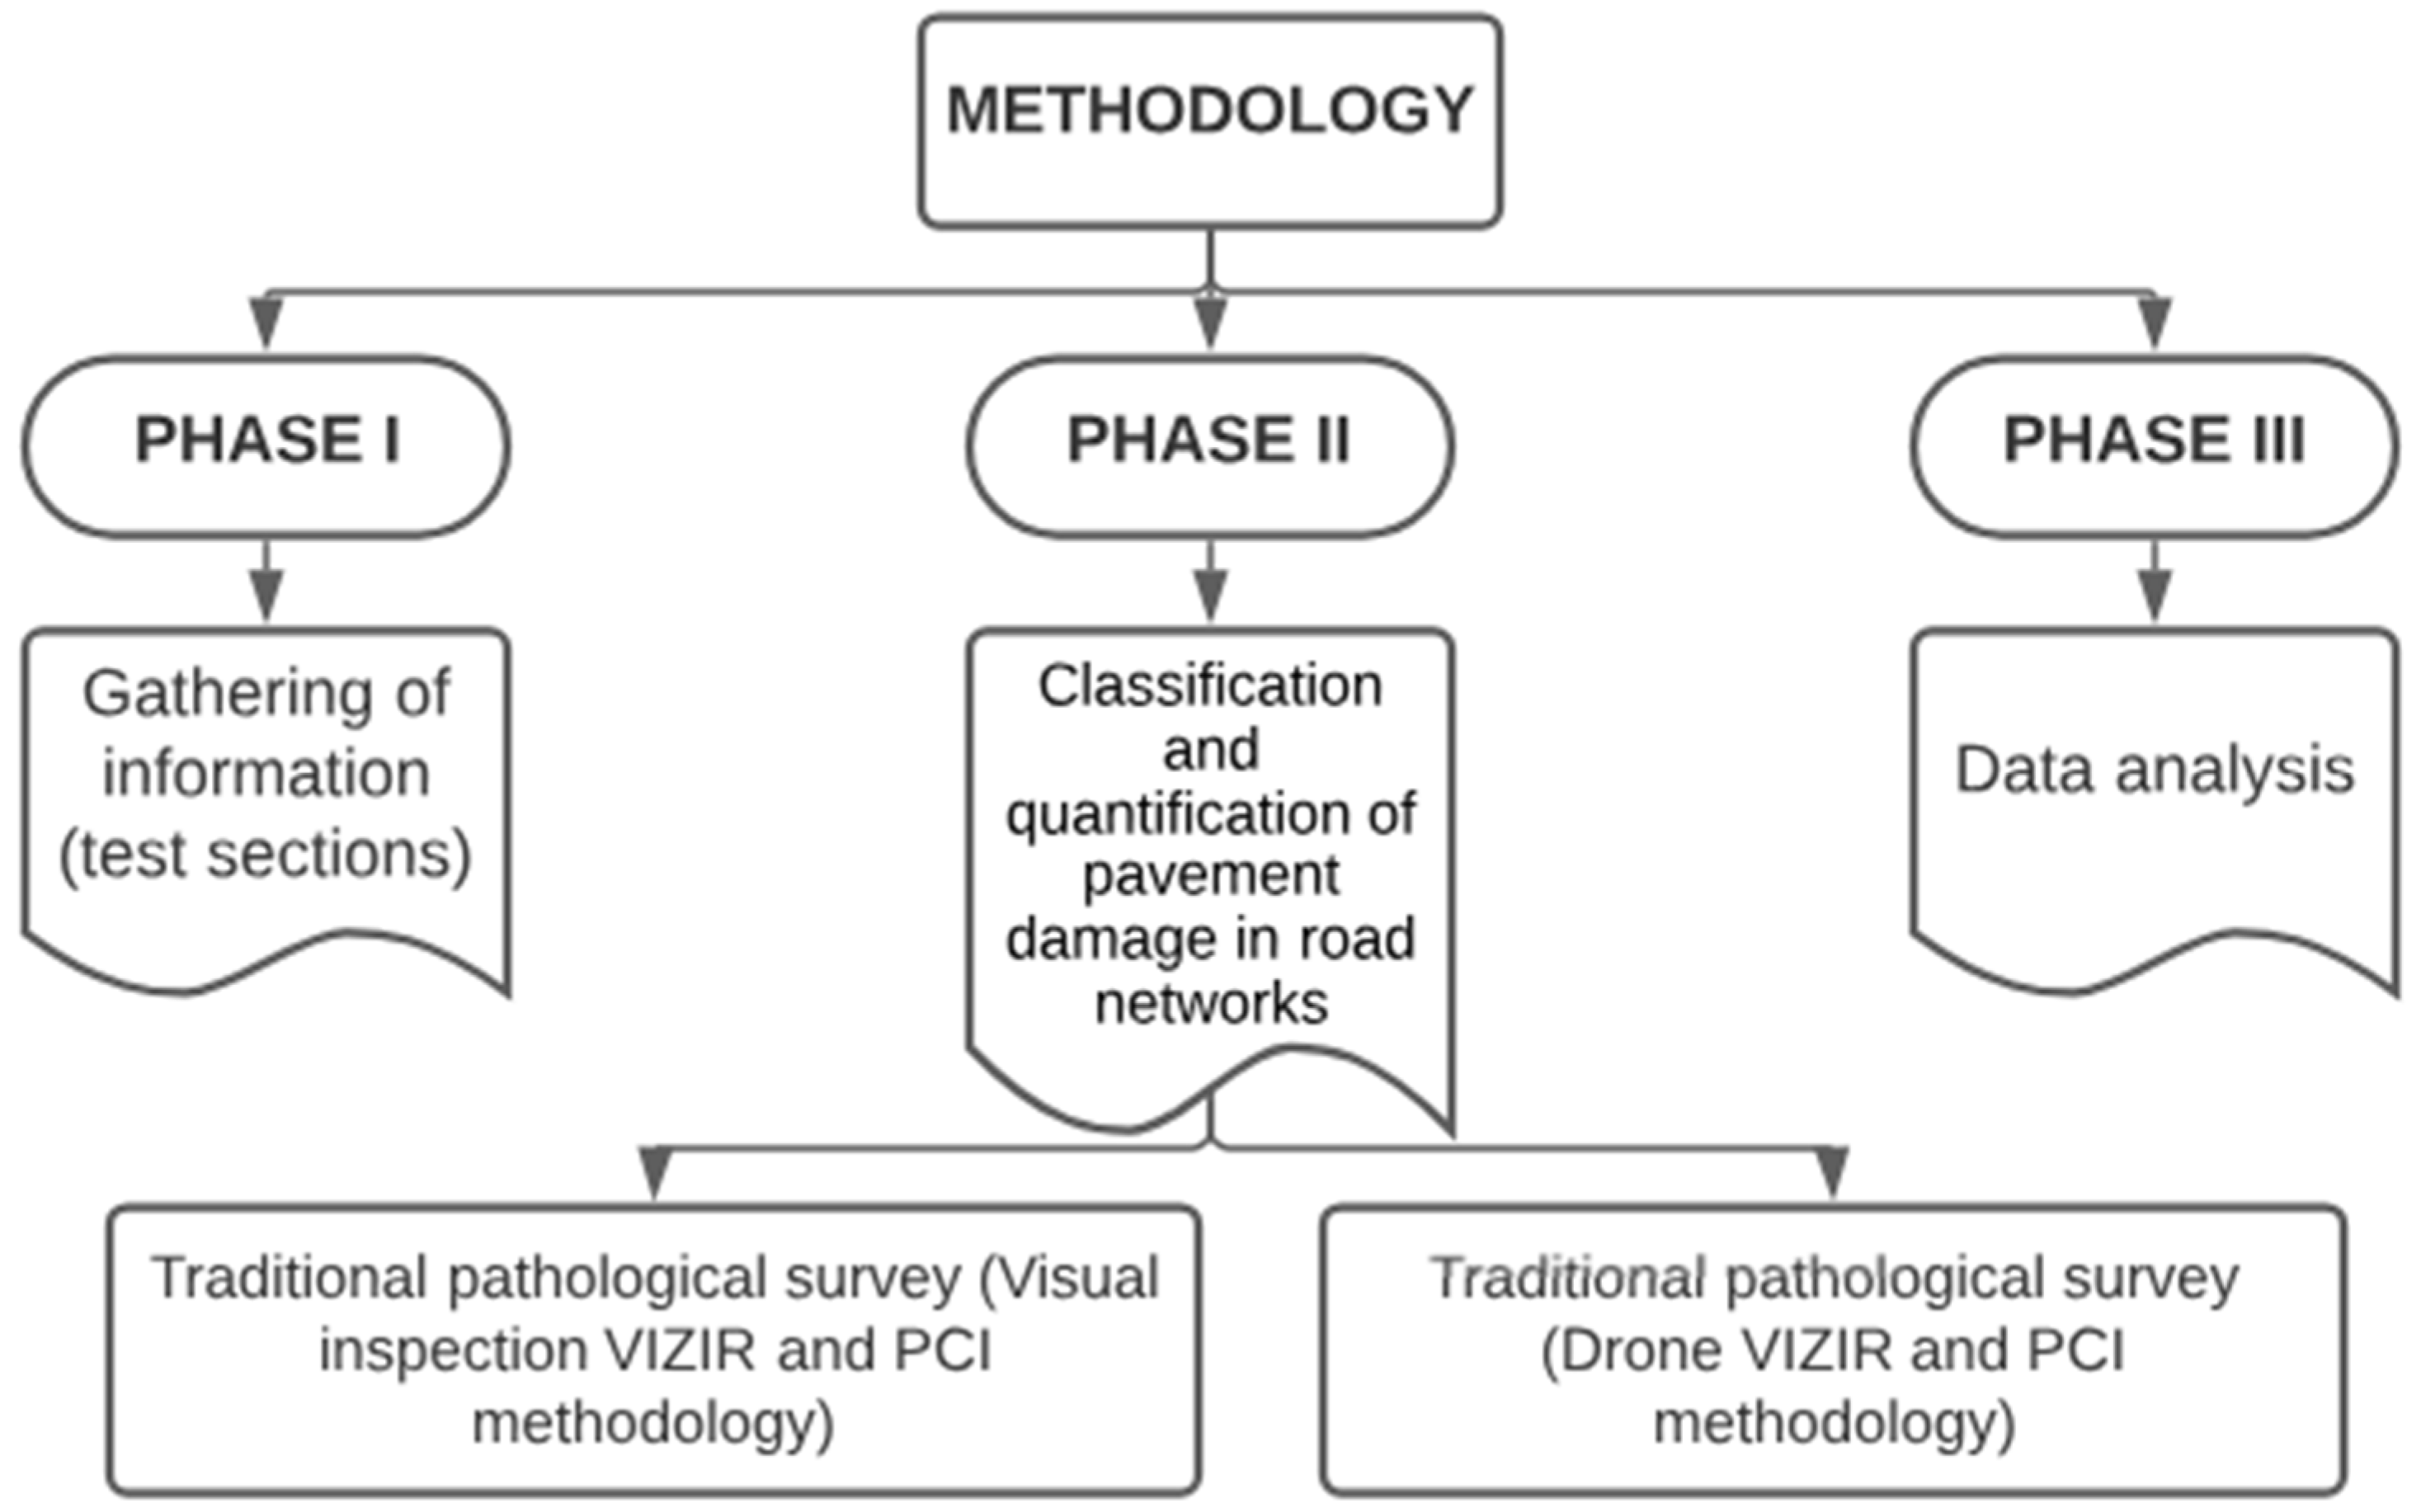
Figure 2.
Summary of PCI methodology.
Figure 2.
Summary of PCI methodology.
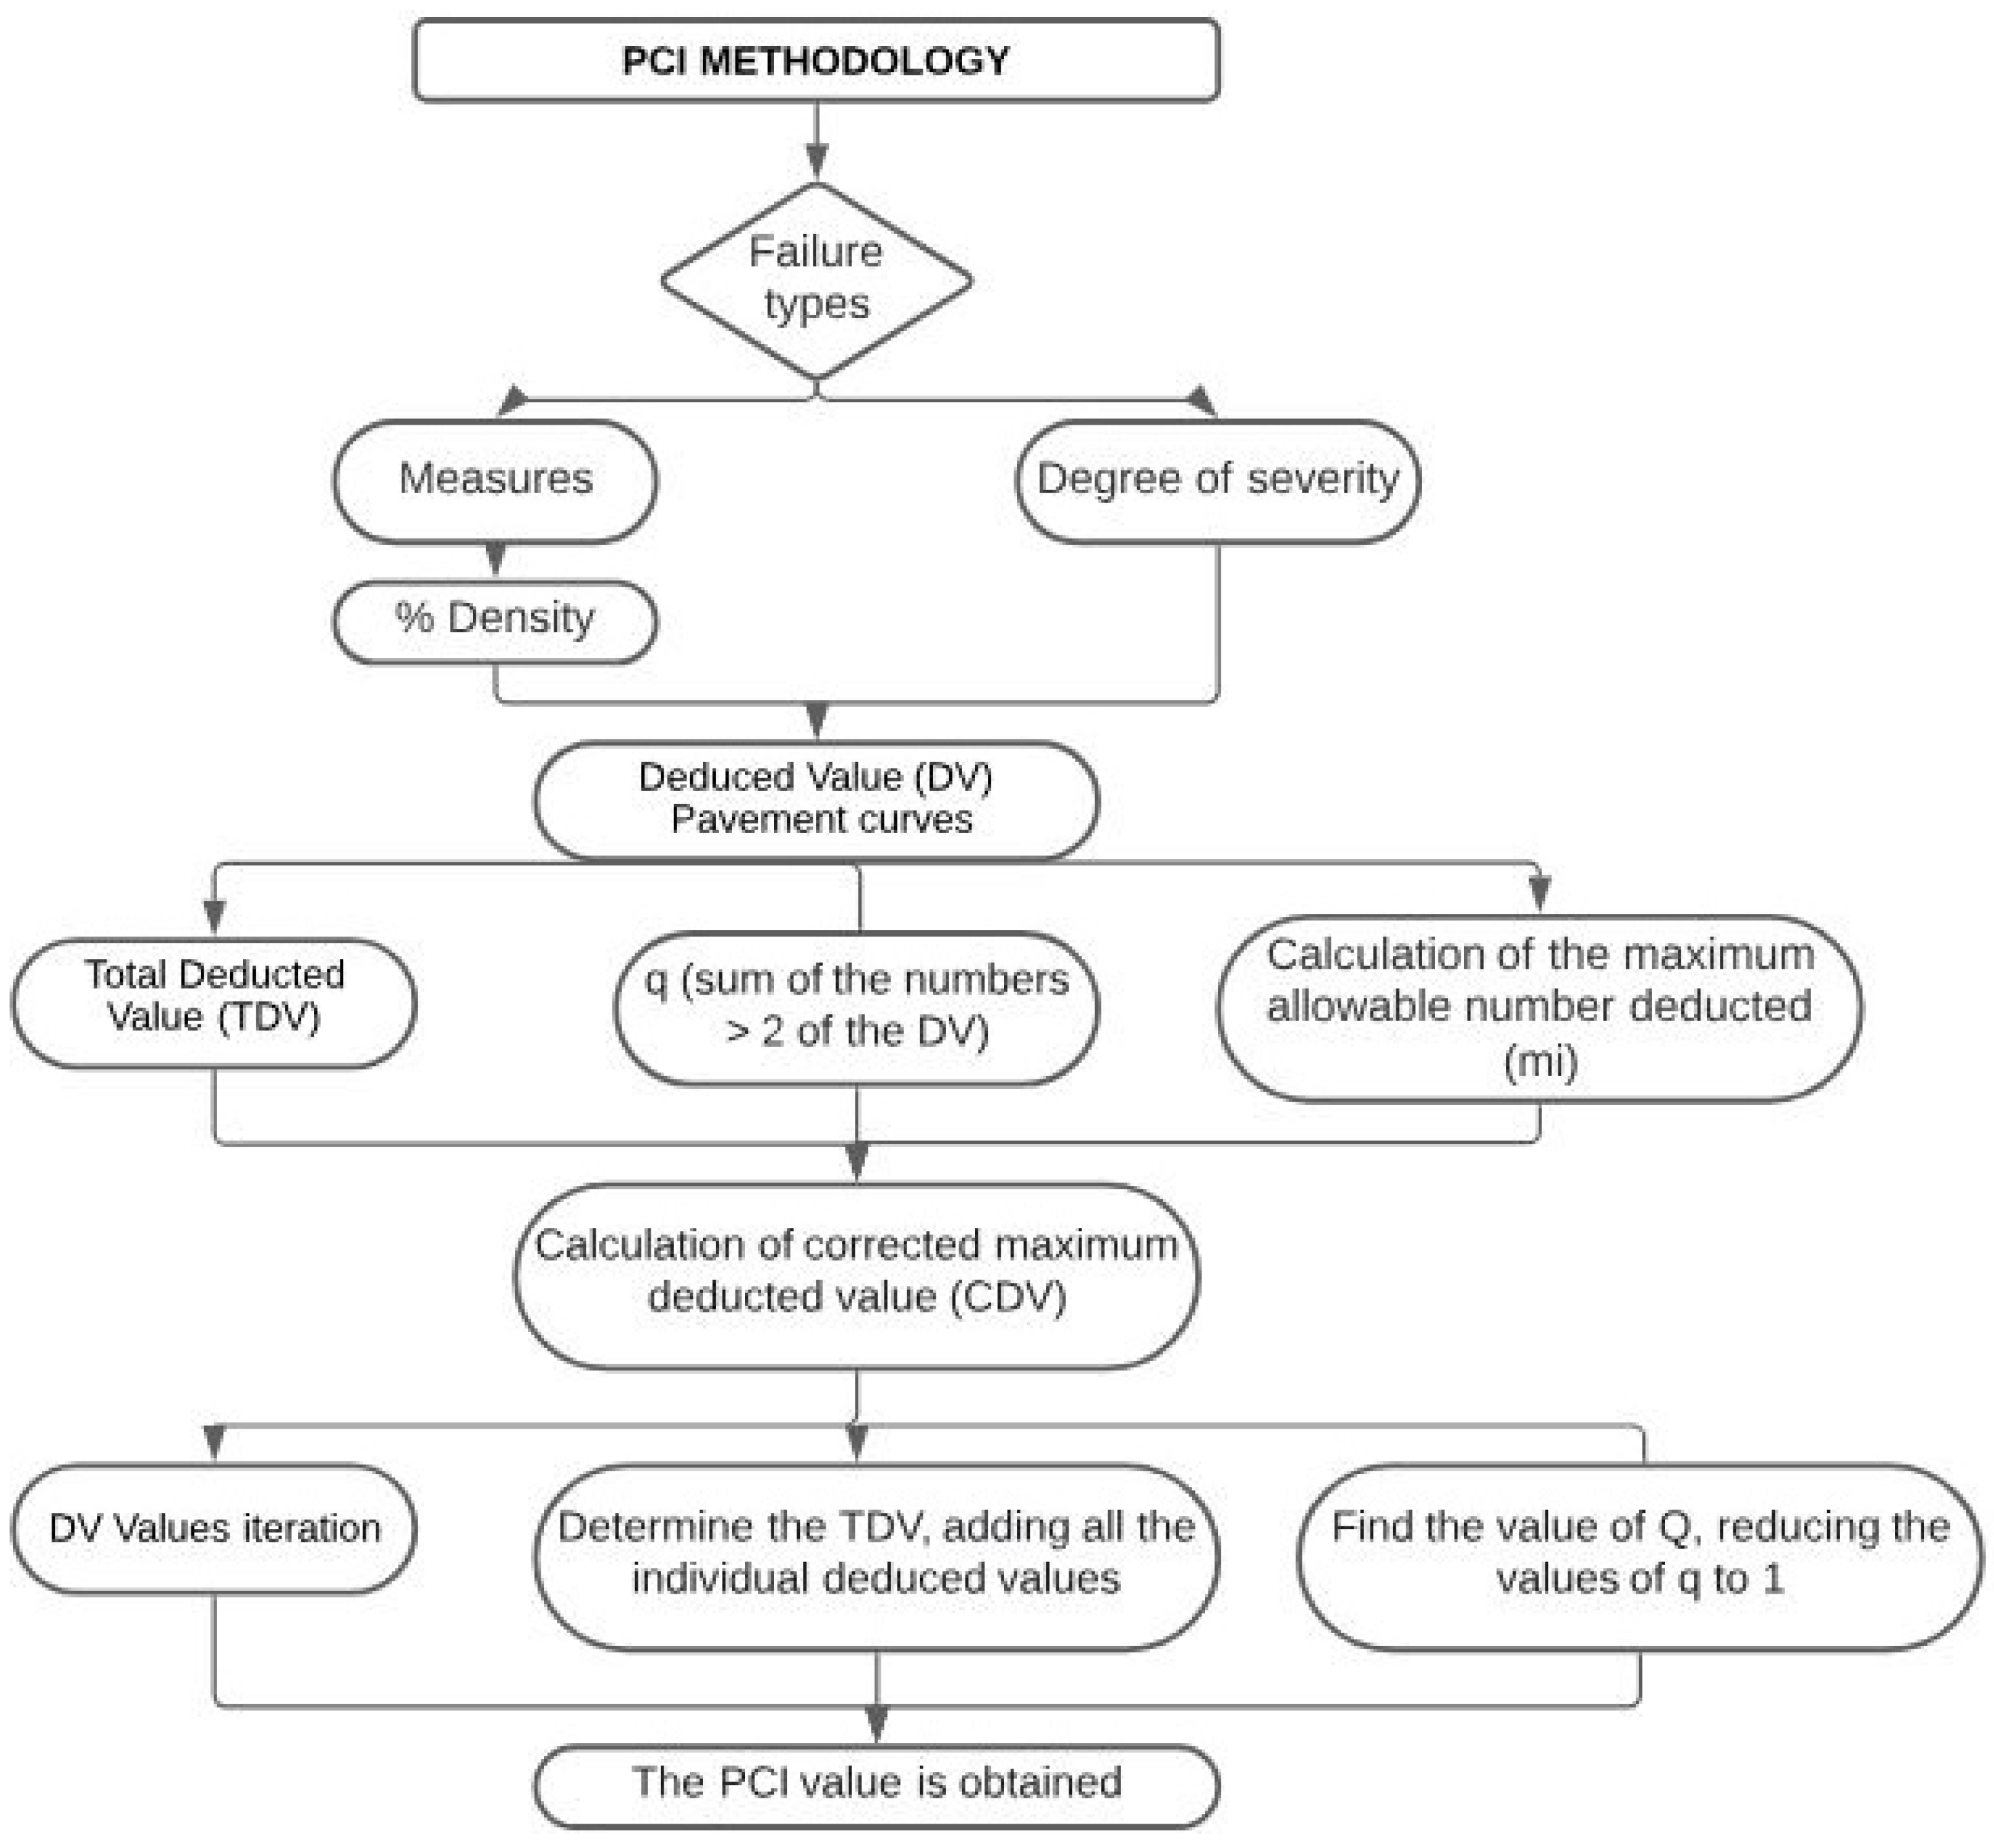
Figure 3.
Summary of VIZIR methodology.
Figure 3.
Summary of VIZIR methodology.
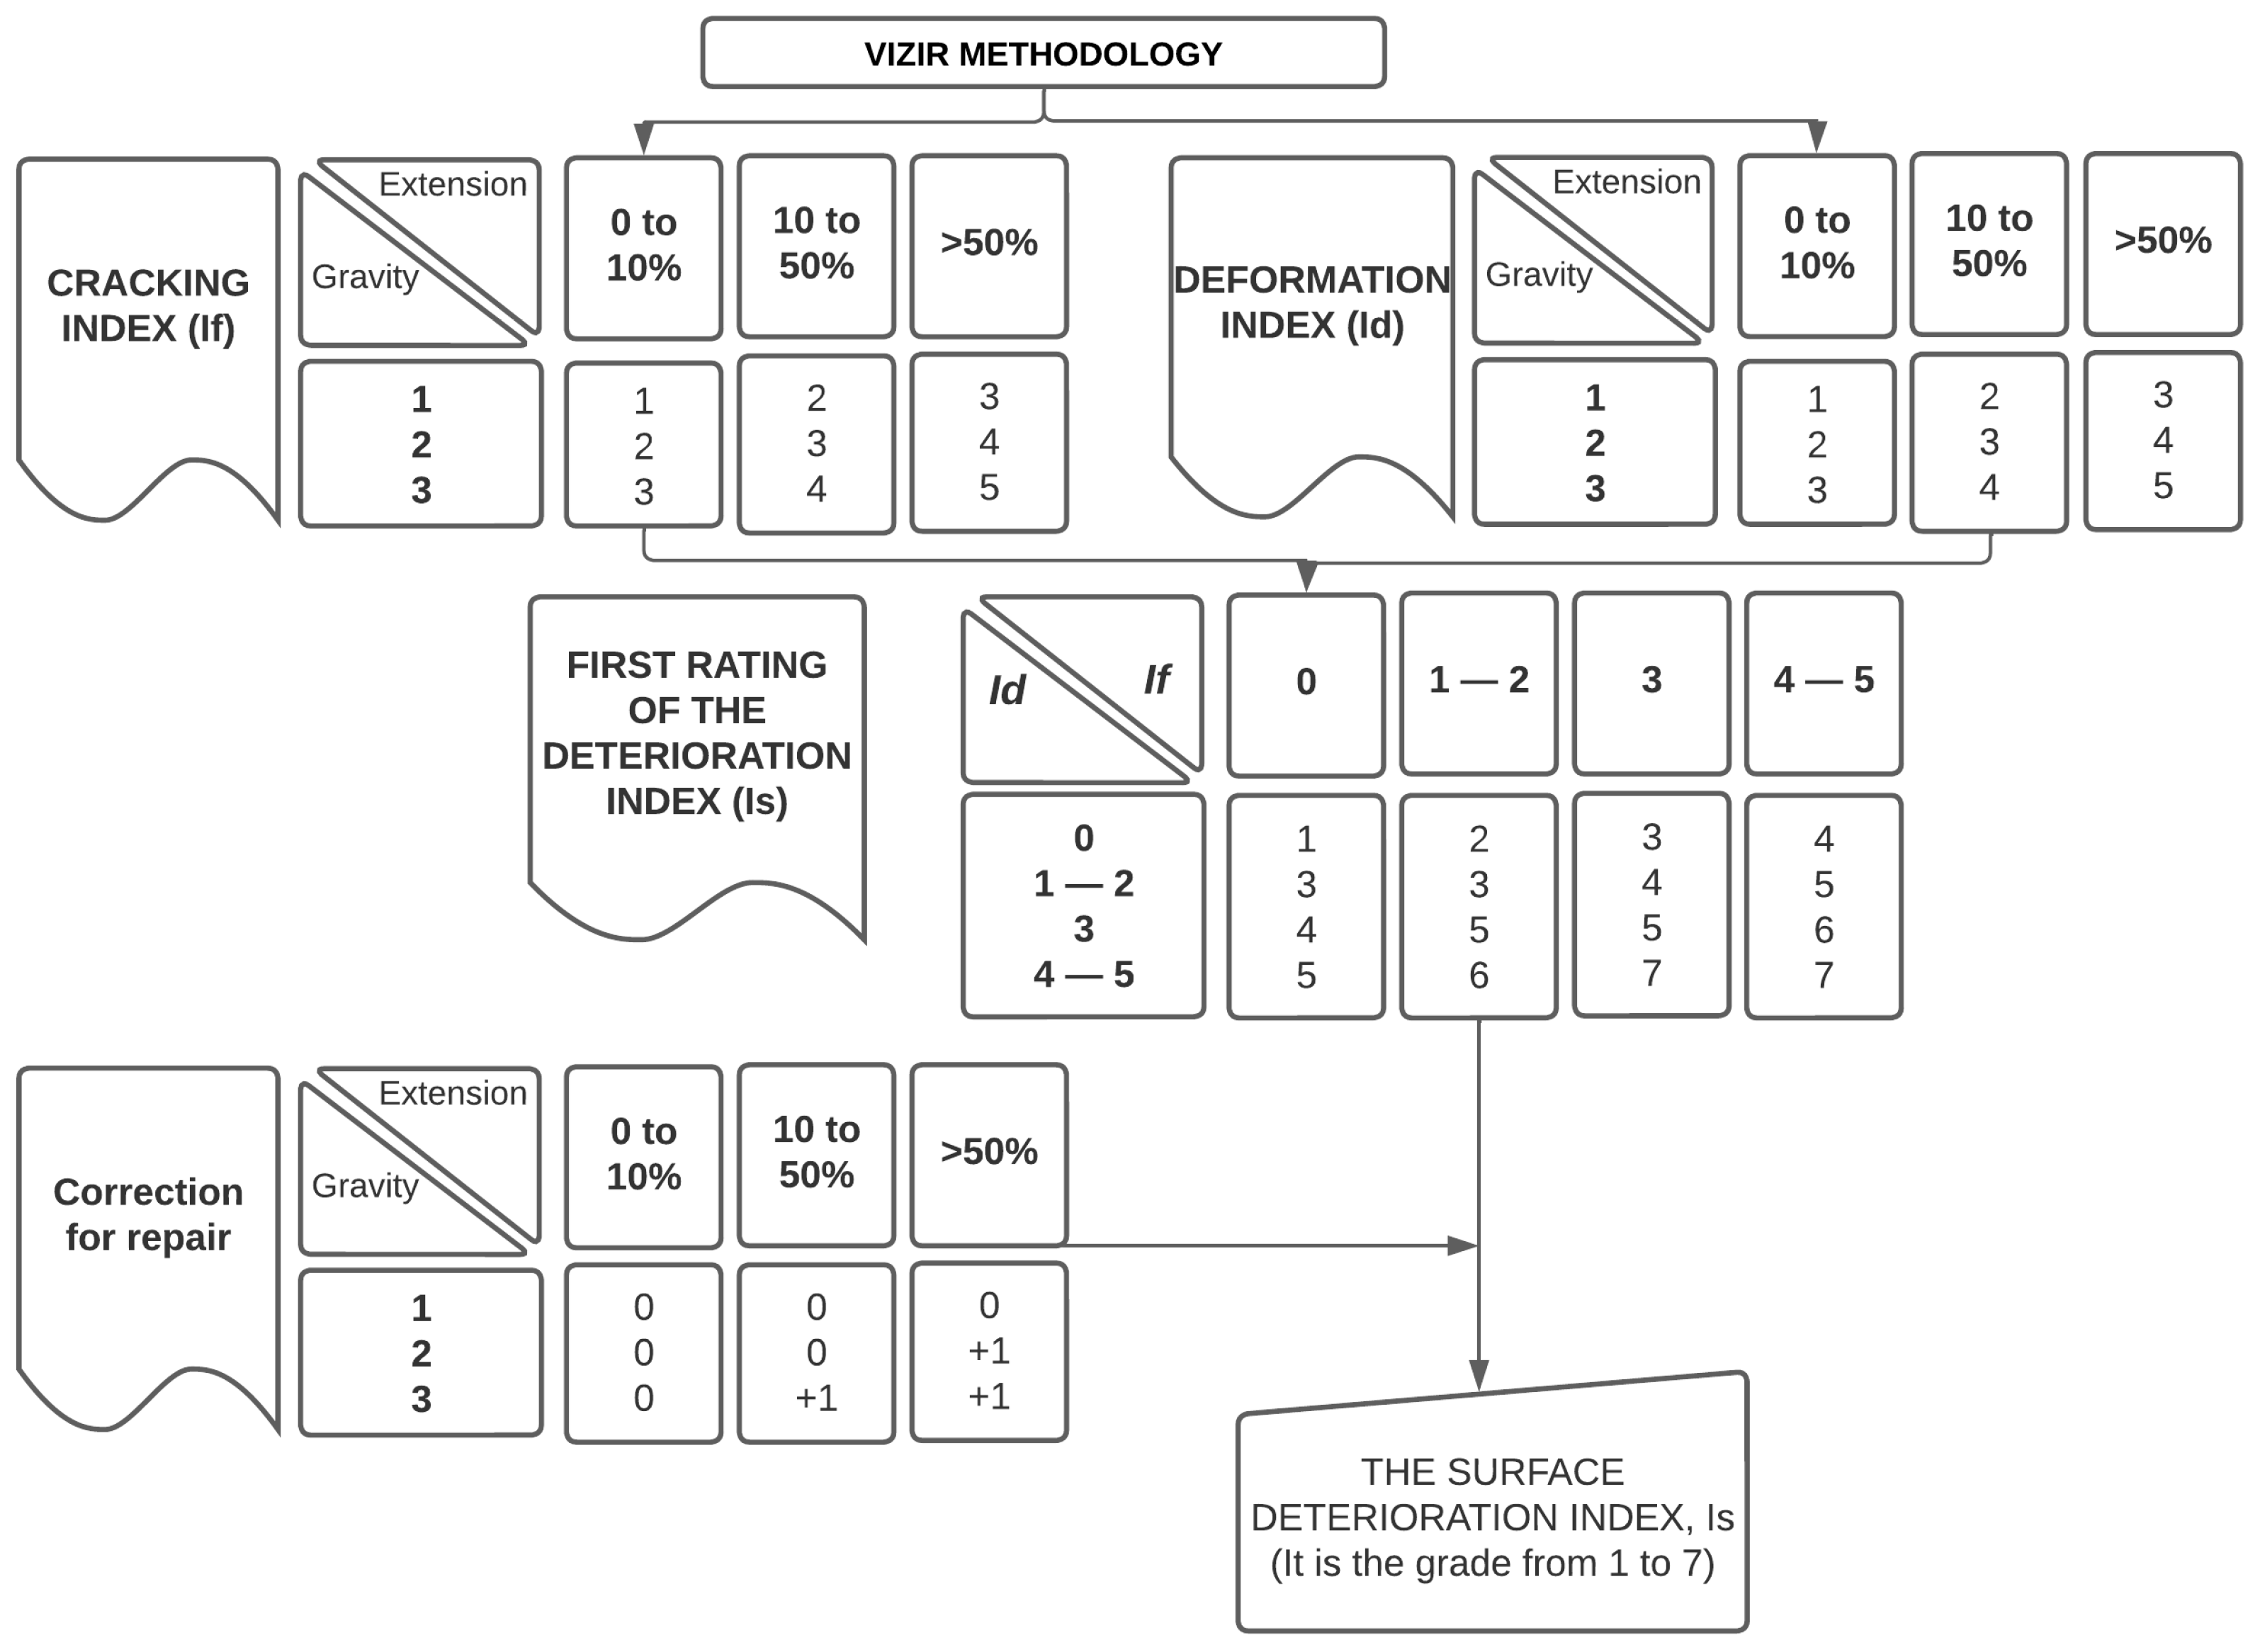
Figure 4.
DJI Mavic Air used in this study.
Figure 4.
DJI Mavic Air used in this study.
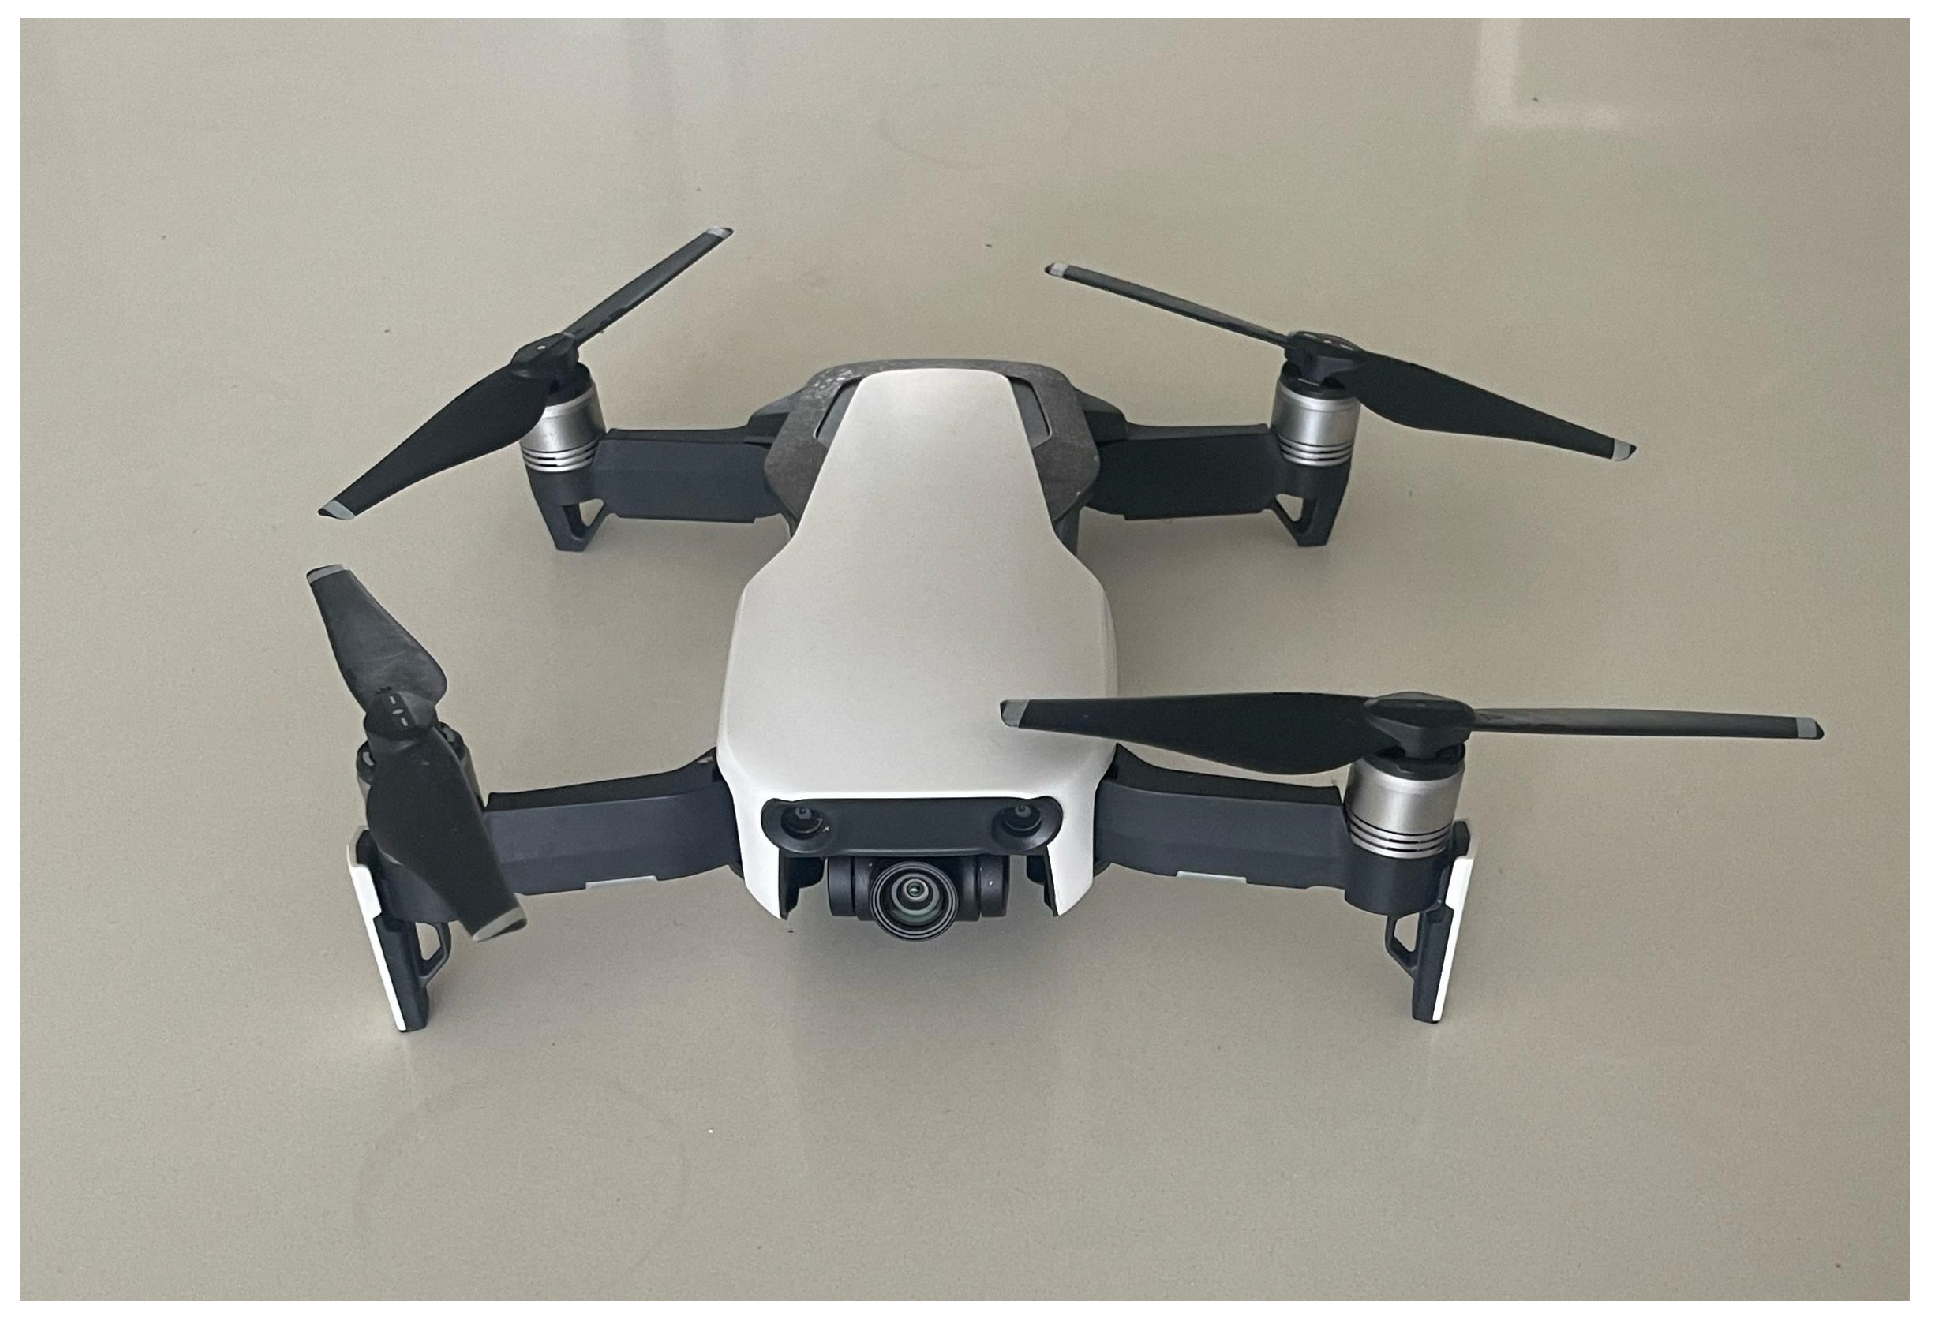
Figure 5.
Flight plan over the study area at an altitude of 5.00 m (16.40 ft).
Figure 5.
Flight plan over the study area at an altitude of 5.00 m (16.40 ft).
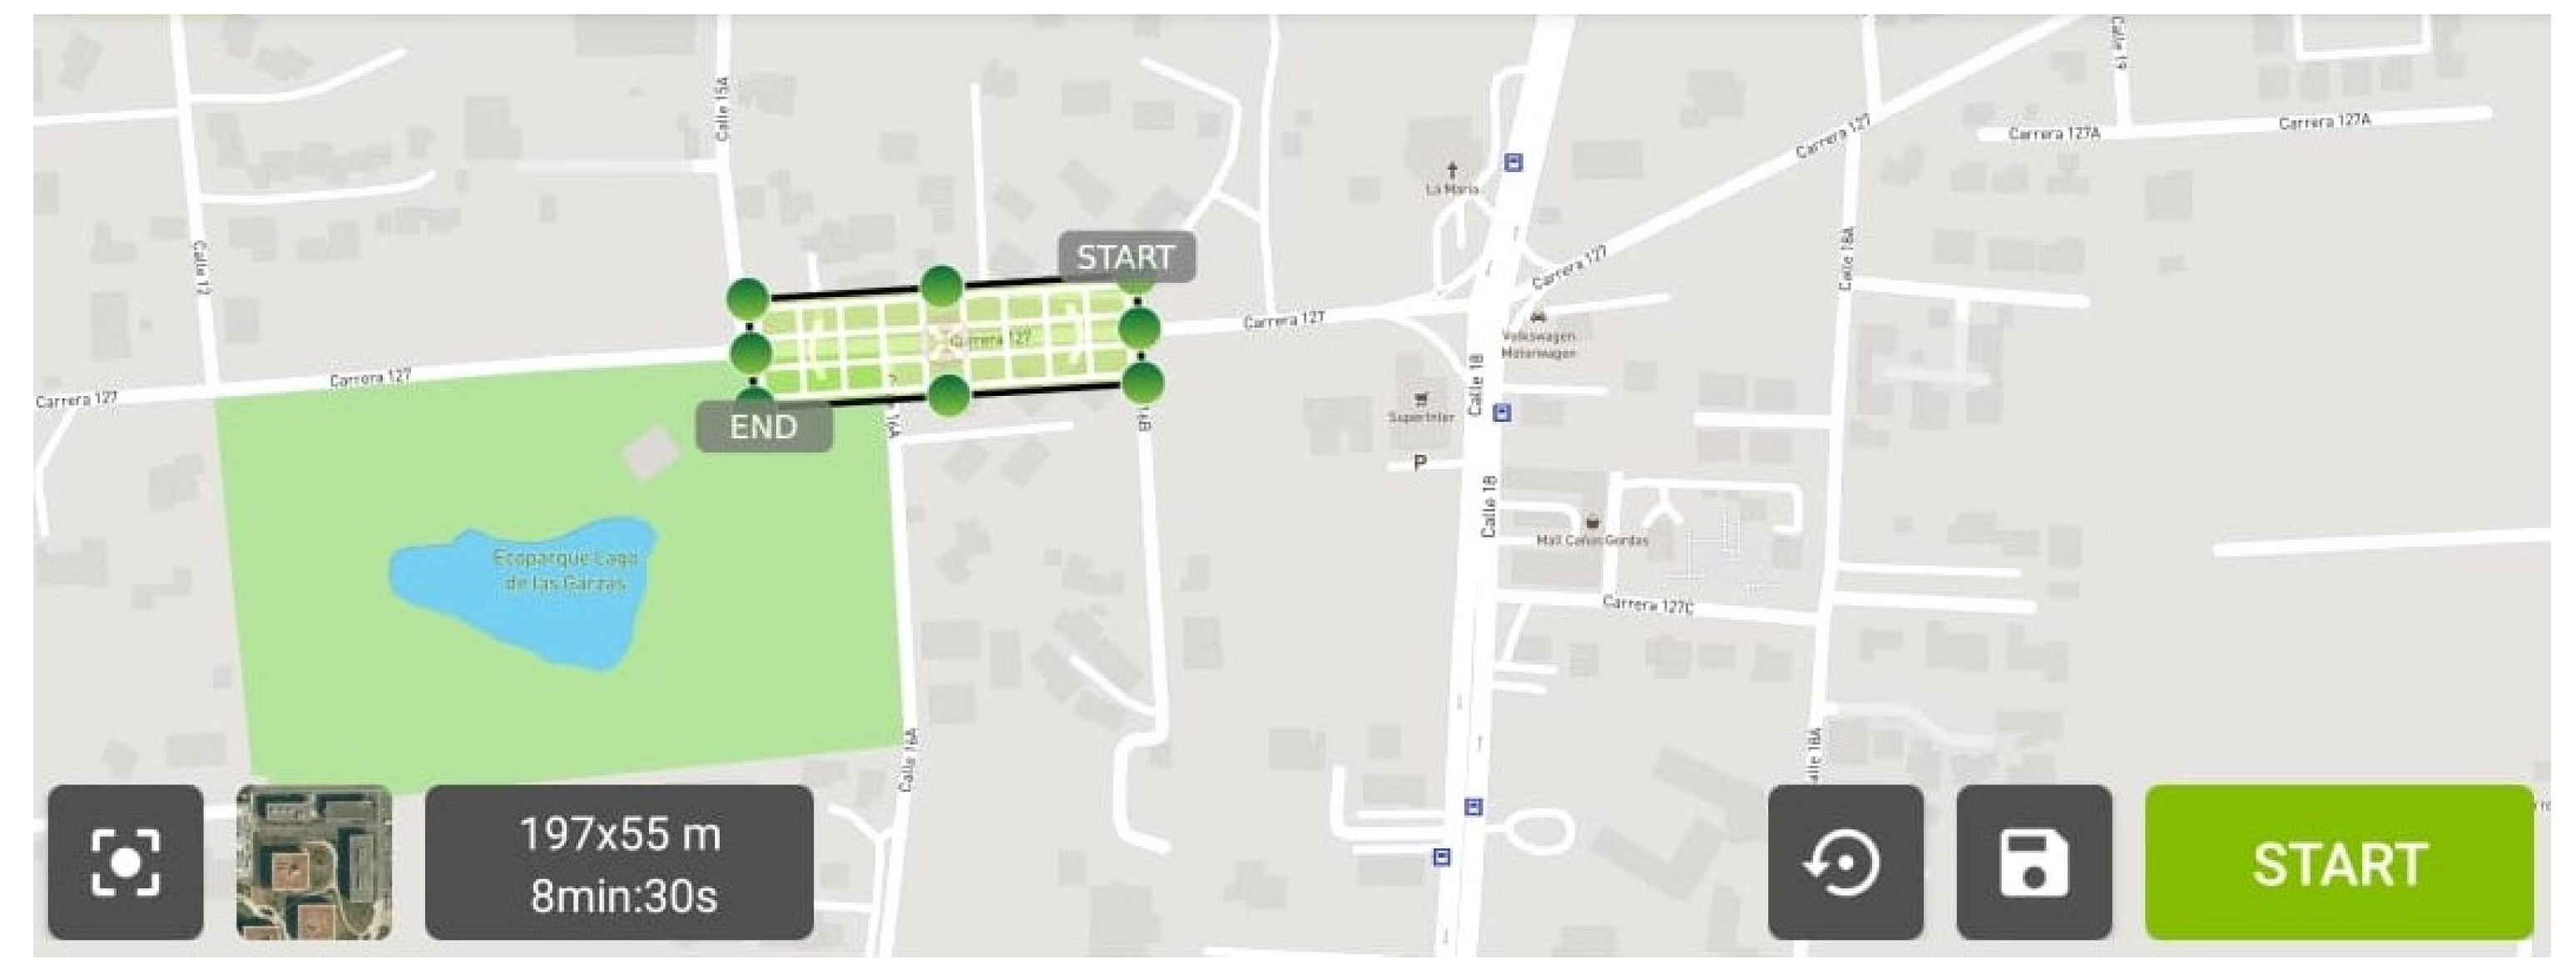
Figure 6.
Flight plan over the study area at an altitude of 3.00 m (9.84 ft).
Figure 6.
Flight plan over the study area at an altitude of 3.00 m (9.84 ft).
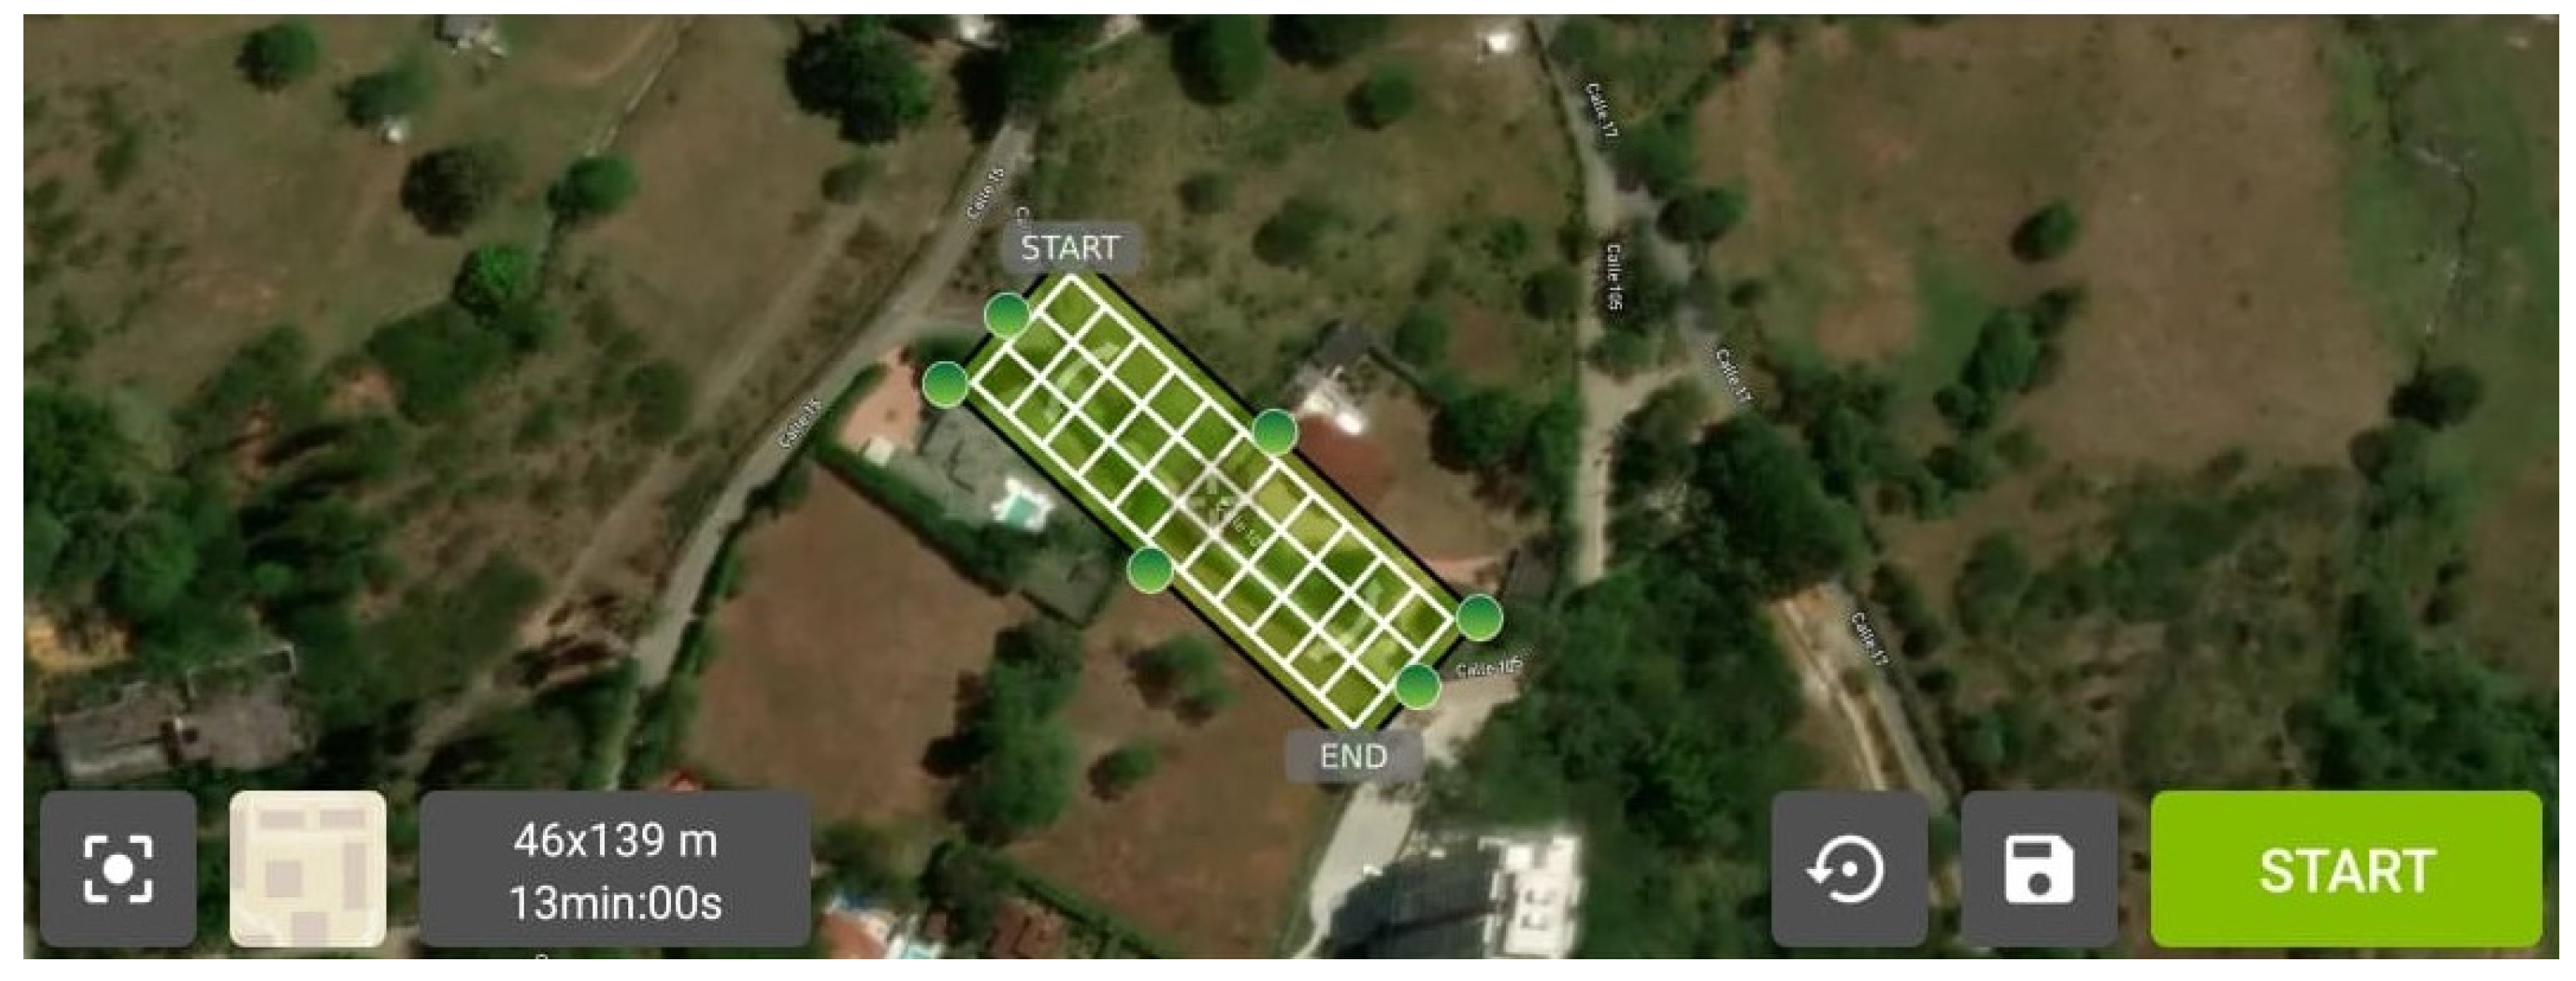
Figure 7.
Pavement section captured from traditional visual inspection.
Figure 7.
Pavement section captured from traditional visual inspection.
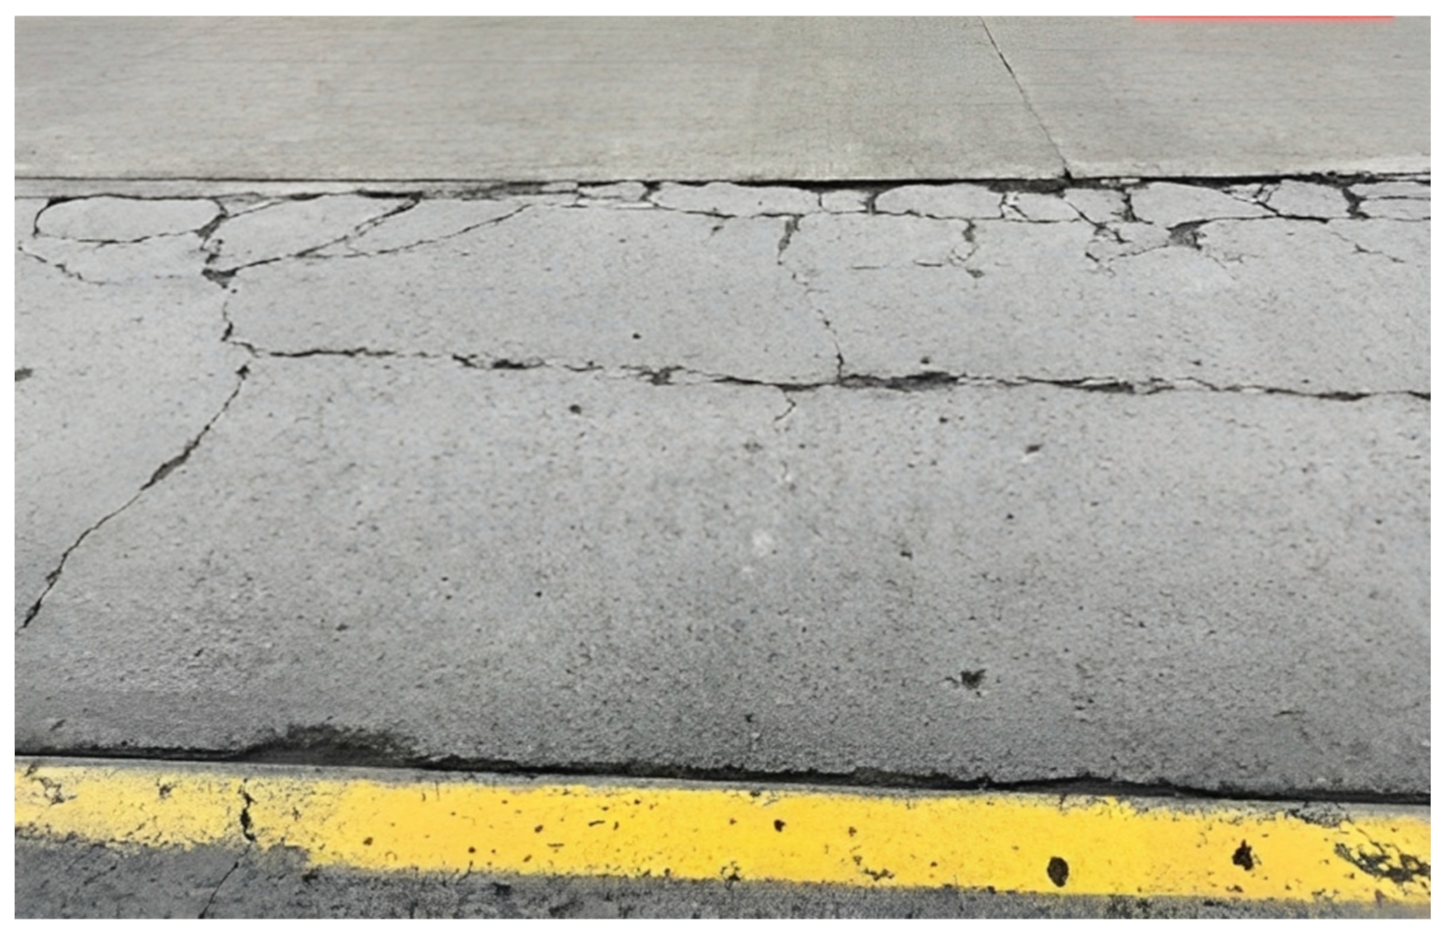
Figure 8.
Three-dimensional models of the area of study generated by images captured by UAS.
Figure 8.
Three-dimensional models of the area of study generated by images captured by UAS.
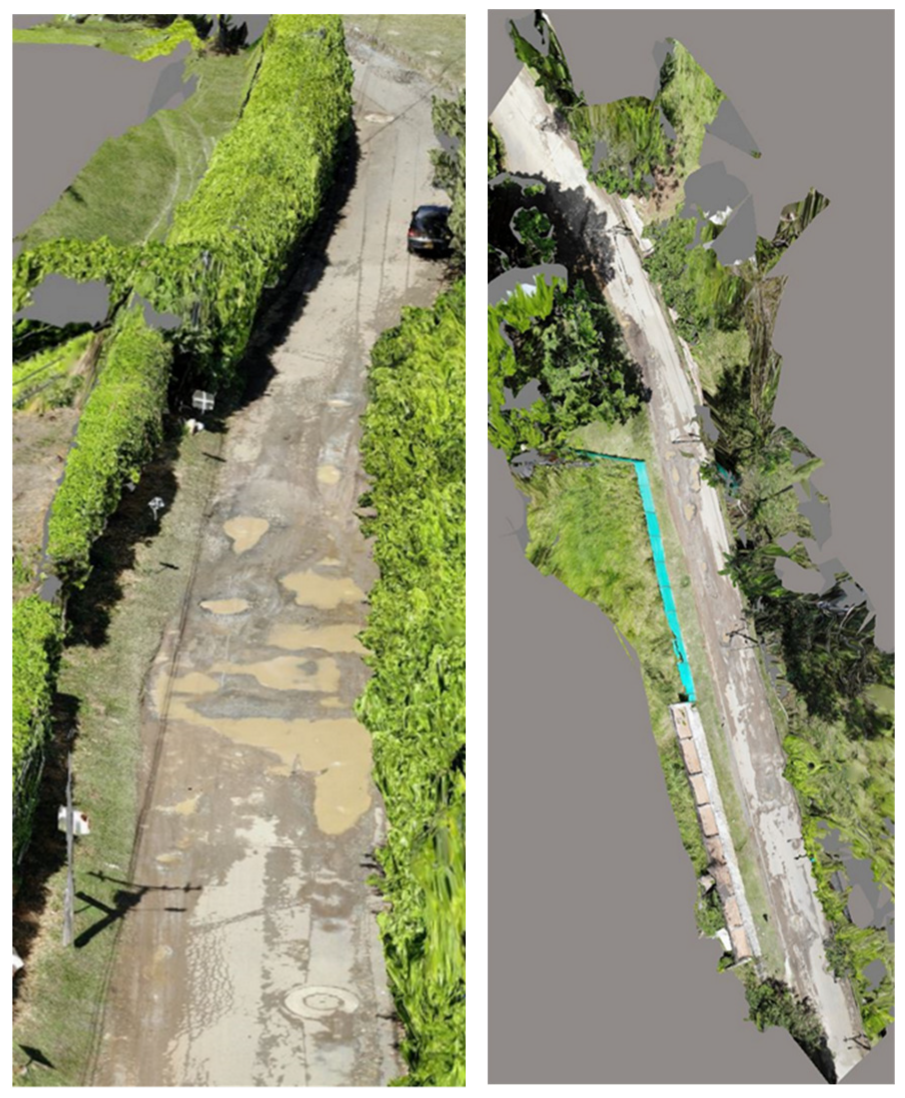
Figure 9.
Measurement comparison using traditional tools (left) and computational tools (right). The measurements to the right show a perimeter of 50.40 m and area of 41.20 m2.
Figure 9.
Measurement comparison using traditional tools (left) and computational tools (right). The measurements to the right show a perimeter of 50.40 m and area of 41.20 m2.
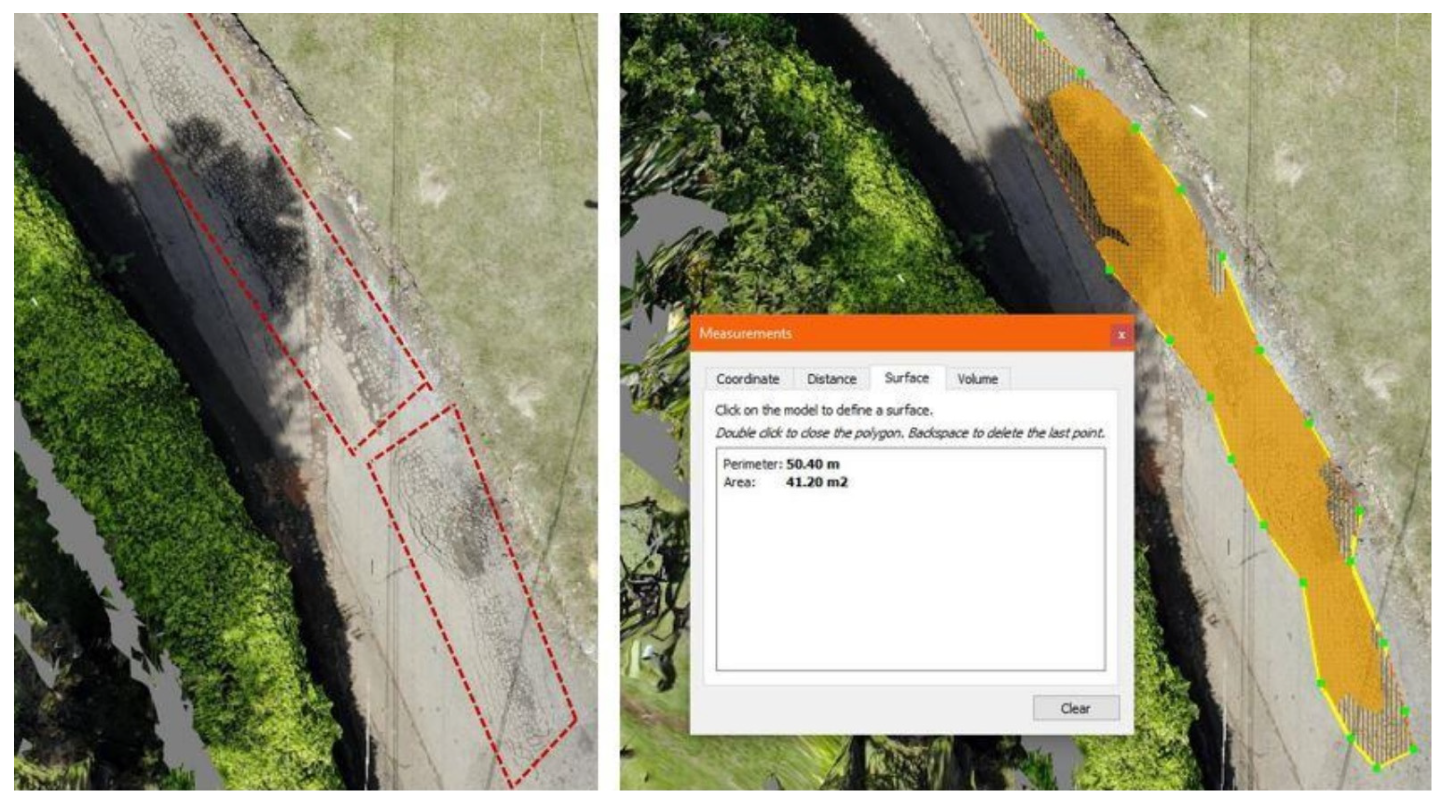
Figure 10.
Defect comparison between visual and UAS inspection measurements.
Figure 10.
Defect comparison between visual and UAS inspection measurements.
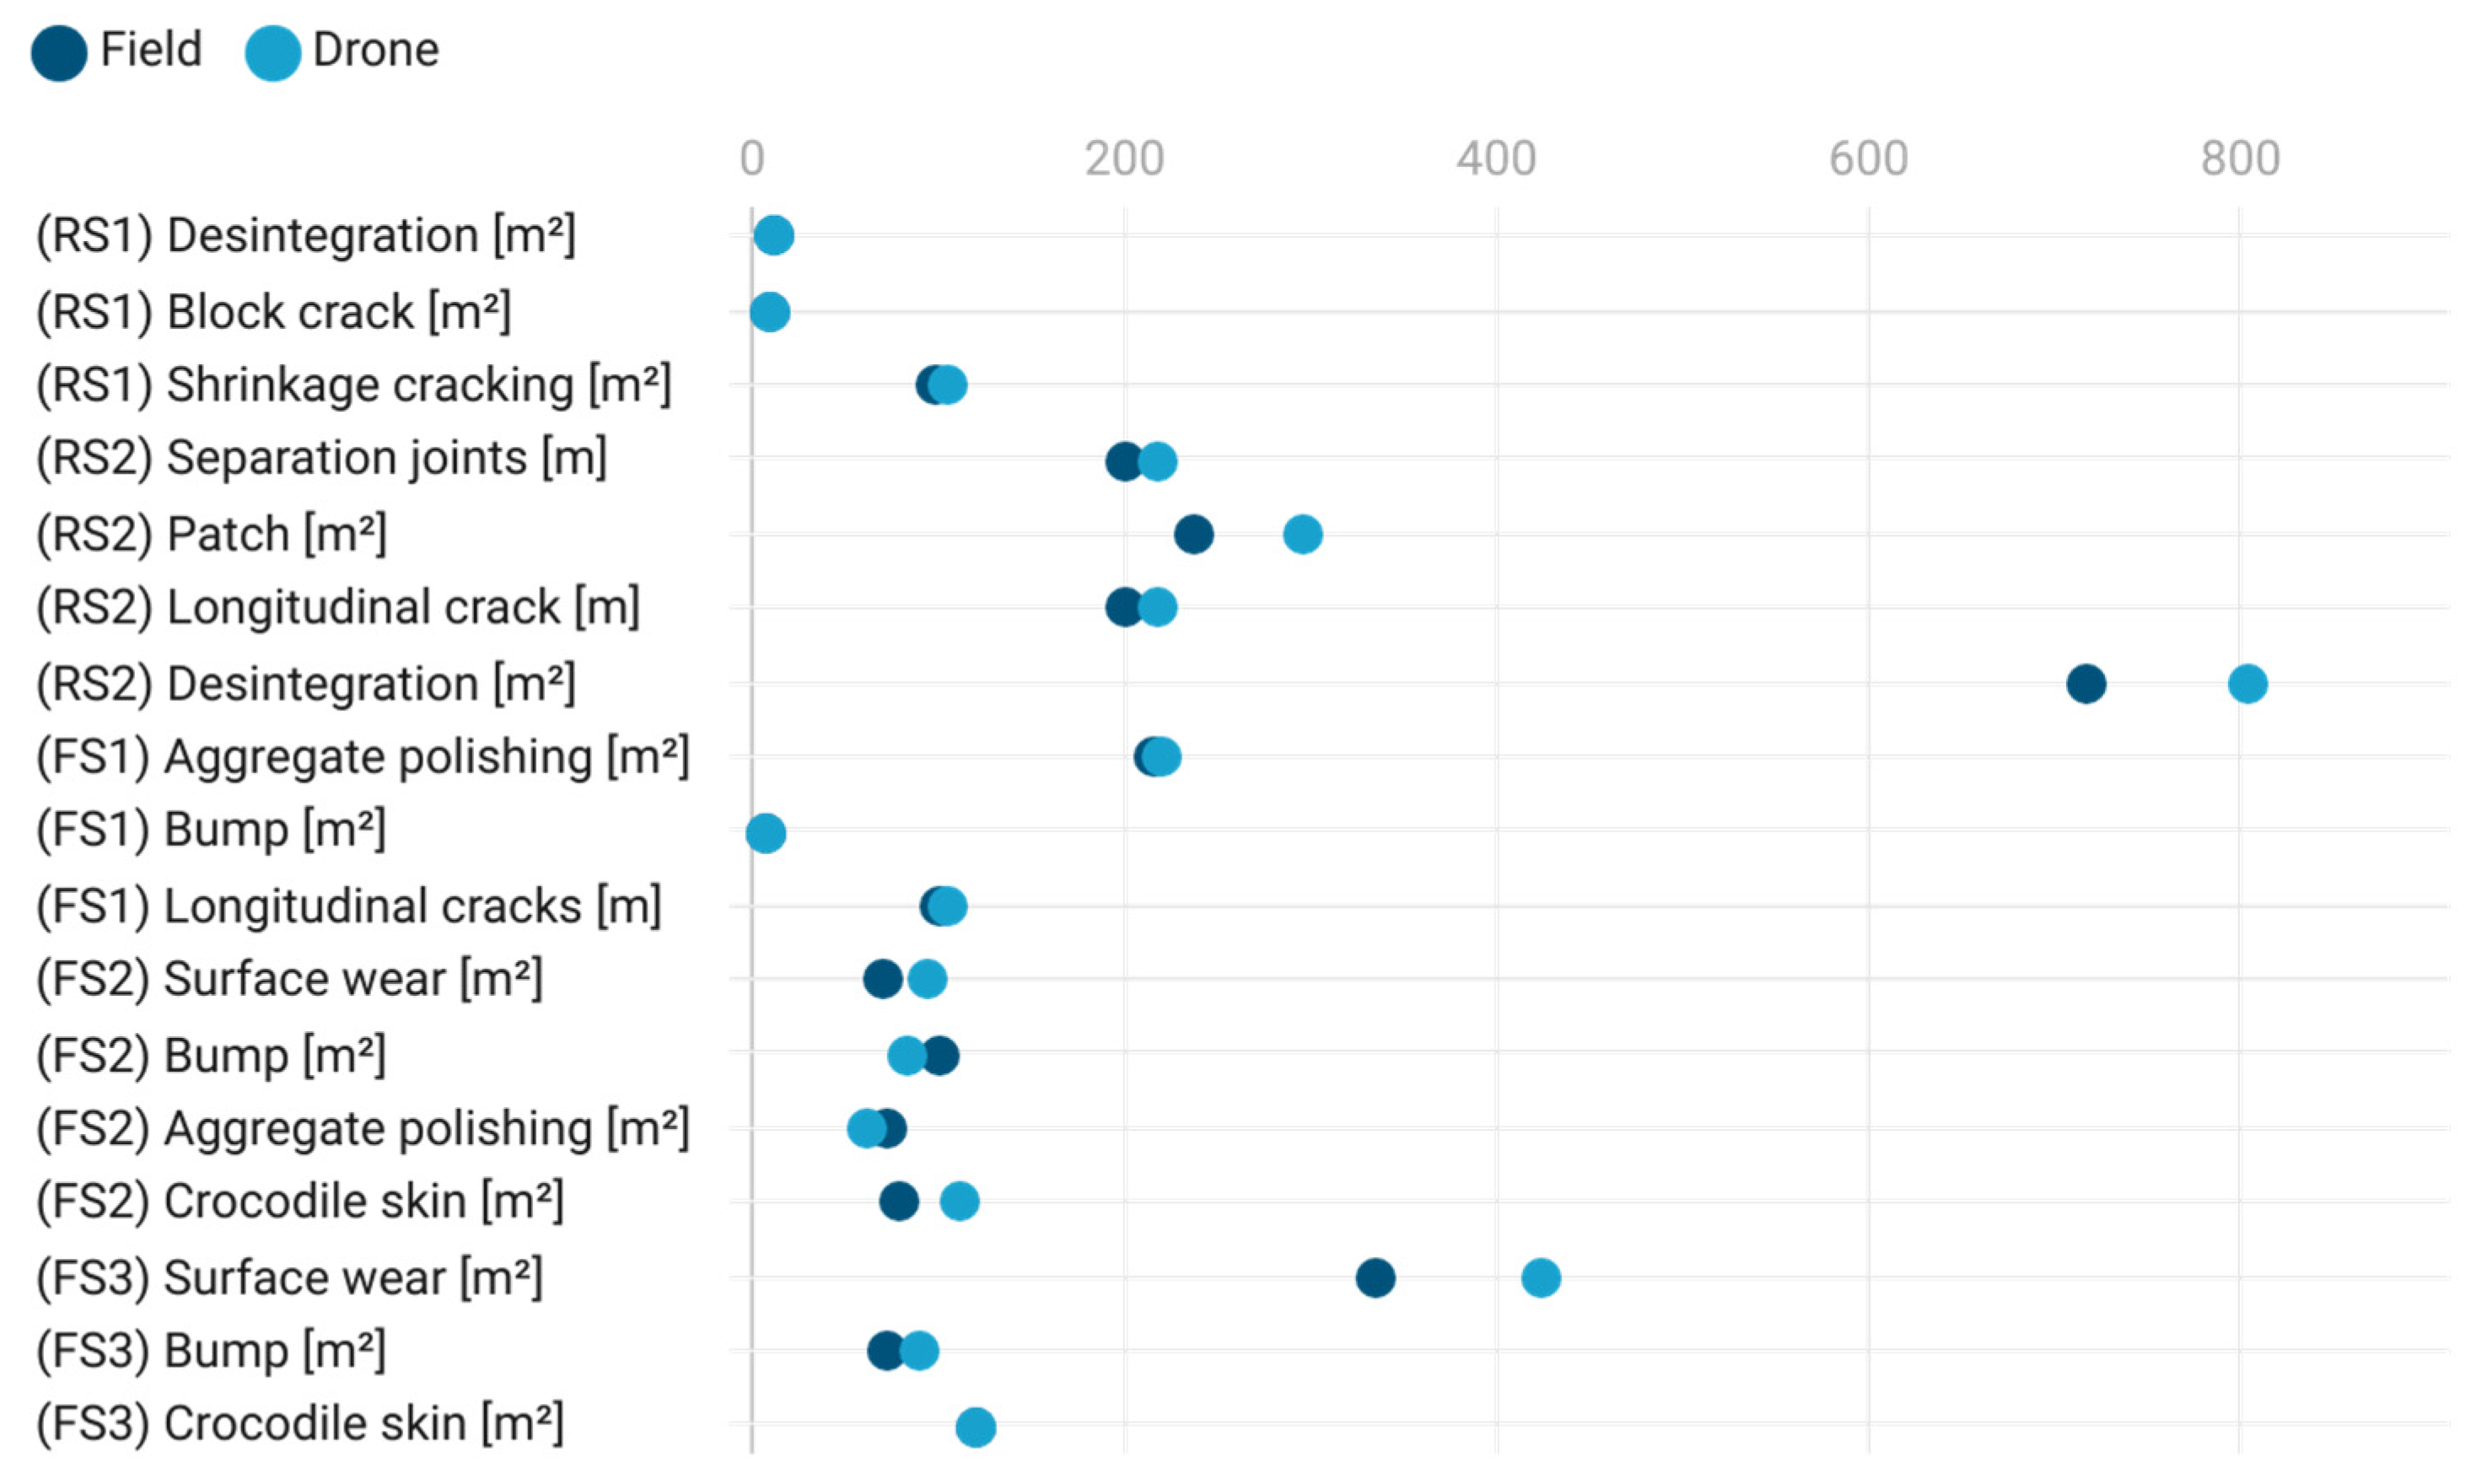
Table 1.
PCI and VIZIR comparison.
Table 1.
PCI and VIZIR comparison.
| Category | PCI | VIZIR |
|---|---|---|
| Pavement type | Flexible, rigid, composite, gravel | Flexible, rigid, composite |
| Road category | Freeway, arterial, collector, local | All |
| Advantages | Accuracy | Easy implementation |
| Equipment | Moderate | Minimum |
| Staff training | Moderate | Minimum |
Table 2.
General characteristics of the study area.
Table 2.
General characteristics of the study area.
| ID | Pavement | Material | Length (m) [ft] | Average Width (m) [ft] |
|---|---|---|---|---|
| FS1 | Flexible | Asphalt | 334.63 [1097.87] | 7.00 [22.97] |
| FS2 | Flexible | Asphalt | 164.20 [538.71] | 7.00 [22.97] |
| FS3 | Flexible | Asphalt | 216.60 [710.63] | 6.00 [19.69] |
| RS1 | Rigid | Concrete | 259.36 [850.92] | 12.32 [40.42] |
| RS2 | Rigid | Concrete | 243.00 [797.24] | 7.00 [22.97] |
Table 3.
Deformation Index (Id) and the Cracking Index (If) relationship.
Table 3.
Deformation Index (Id) and the Cracking Index (If) relationship.
| If|If | 0 | 1–2 | 3 | 4–5 |
|---|---|---|---|---|
| 0 | 1 | 2 | 3 | 4 |
| 1–2 | 3 | 3 | 4 | 5 |
| 3 | 4 | 5 | 5 | 6 |
| 4–5 | 5 | 6 | 7 | 7 |
Table 4.
VIZIR and PCI rating comparison by visual inspection and UAS.
Table 4.
VIZIR and PCI rating comparison by visual inspection and UAS.
| Section | Visual Inspection Rating | UAS Rating |
|---|---|---|
| VIZIR Method | ||
| FS1 | 3 | 3 |
| FS1 | 3 | 3 |
| FS2 | 3 | 3 |
| PCI Method | ||
| RS1 | 94 | 94 |
| RS2 | 66 | 58 |
Table 5.
Criteria comparison for visual and UAS PCI inspection.
Table 5.
Criteria comparison for visual and UAS PCI inspection.
| Criteria | Visual Inspection | UAS Inspection |
|---|---|---|
| Duration of data capture | It can take at least 40 min on highly deteriorated roads | Up to 20 min for 100 m sections (328 ft), inclusive of all processes described above |
| Method of inventory | Conducted in the field | Conducted through orthophotos |
| Method of measurements | Regular geometric shapes (Square and/or Rectangle) | Based on the existing road irregularity |
| Personnel required | Minimum of 2 people | One person for flight and data processing |
| Road closures | Total or partial closure during the inspection, causing traffic delays | Complete closure for approximately 10 min during UAS flight |
| Safety concerns | Risk of accidents, e.g., being hit by a vehicle | Limited risk to the operator and people aiding in the flight operation |
Table 6.
Measure comparison between field and UAS inspection for sections RS1 and RS2.
Table 6.
Measure comparison between field and UAS inspection for sections RS1 and RS2.
| Section | Type of Defect | Unit | Field | UAS | Difference | Difference (%) |
|---|---|---|---|---|---|---|
| RS1 | Disintegration | m2 [ft2] |
12.00 [129.17] |
10.50 [113.02] |
1.50 [16.15] |
−12.50 |
| Crack block | m2 [ft2] |
9.60 [103.33] |
10.20 [109.79] |
0.60 [6.46] |
+6.30 | |
| Shrinkage | m2 [ft2] |
99.00 [1065.63] |
105.00 [1130.21] |
6.00 [64.58] |
+6.10 | |
| RS2 | Separation joints | m [ft] |
200.00 [656.17] |
217.49 [713.55] |
17.49 [57.38] |
−8.70 |
| Patch | m2 [ft2] |
236.60 [2546.74] |
295.18 [3177.29] |
58.58 [630.55] |
+24.80 | |
| Longitudinal crack | m [ft] |
200.00 [656.17] |
217.49 [713.55] |
17.49 [57.38] |
+8.70 | |
| Disintegration | m2 [ft2] |
717.50 [7723.11] |
804.60 [8660.64] |
87.10 [937.54] |
+12.10 |
Table 7.
Measure comparison between field and UAS inspection.
Table 7.
Measure comparison between field and UAS inspection.
| Section | Type of Defect | Unit | Field | UAS | Difference | Difference (%) |
|---|---|---|---|---|---|---|
| FS1 | Aggregate polishing | m2 [ft2] |
215.00 [2314.24] |
220.00 [2368.06] |
5.00 [53.82] |
+2.30 |
| Bump | m2 [ft2] |
7.43 [79.98] |
7.76 [83.53] |
0.33 [3.55] |
+4.40 | |
| Longitudinal cracks | m [ft] |
100.00 [328.08] |
105.00 [344.49] |
5.00 [16.40] |
+5.00 | |
| FS2 | Surface wear | m2 [ft2] |
70.00 [753.47] |
93.20 [1003.20] |
23.20 [249.72] |
+33.10 |
| Bump | m2 [ft2] |
100.00 [328.08] |
84.00 [904.17] |
16.00 [172.22] |
−16.00 | |
| Aggregate polishing | m2 [ft2] |
72.00 [775.00] |
61.30 [659.83] |
10.70 [115.17] |
−14.90 | |
| Crocodile skin | m2 [ft2] |
78.00 [839.59] |
111.10 [1195.87] |
33.10 [356.29] |
+42.40 | |
| FS3 | Surface wear | m2 [ft2] |
336.00 [3616.67] |
425.00 [4574.66] |
89.00 [957.99] |
+26.50 |
| Bump | m2 [ft2] |
72.00 [775.00] |
88.70 [954.76] |
16.70 [179.76] |
+23.20 | |
| Crocodile skin | m2 [ft2] |
120.00 [1291.67] |
120.00 [1291.67] |
0.00 [0.00] |
0.00 |
|
Disclaimer/Publisher’s Note: The statements, opinions and data contained in all publications are solely those of the individual author(s) and contributor(s) and not of MDPI and/or the editor(s). MDPI and/or the editor(s) disclaim responsibility for any injury to people or property resulting from any ideas, methods, instructions or products referred to in the content. |
[ad_2]