US CoreLogic S&P Case-Shiller Index Continues to Strengthen, With Annual Gain of 5.5% in December
[ad_1]
High mortgage rates at the end of 2023 continued to dampen monthly appreciation in December, pulling prices down by 0.4% from November
With a full year of data on record as of December 2023, the CoreLogic S&P Case-Shiller Index again indicated the resiliency of home prices against surging borrowing costs and historic housing supply shortages. In 2023, home prices increased by 2.4% compared with 2022, when gains averaged 14.8% for the year. Between 2014 and 2019, home price growth averaged 5.2%.
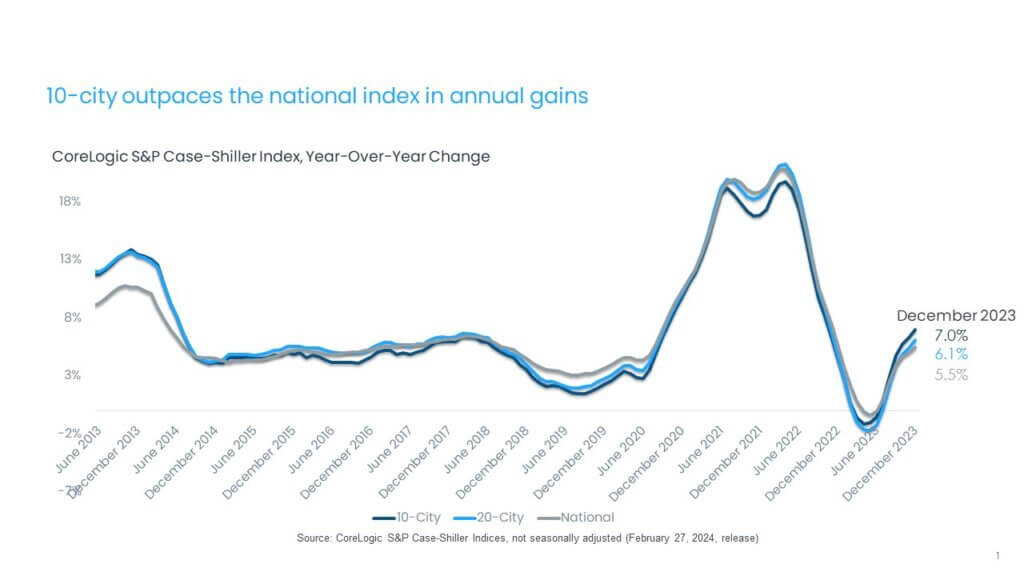
In December, the CoreLogic S&P Case-Shiller Index rose by 5.5% year over year, the sixth month of annual increases following two months of annual declines (Figure 1). With the rebound in appreciation in 2023, home prices are now up by 0.6% compared with the June 2022 peak and up by 6.1% from the January 2023 bottom.
While prospects for 2024 housing market activity looked promising coming into the year, elevated mortgage rates, which recently took another step higher, are posing a challenge for both buyers and sellers. With early data for the supply of homes for sale and contracts signed in January and February, the expected 2024 rebound has yet to be seen, particularly as the spring homebuying season nears. But despite constrained sales activity, home prices are expected to moderate as the imbalance between buyers and sellers continues. The latest CoreLogic Home Price Index (HPI) forecast estimates that home prices will increase by another 3% on average in 2024.
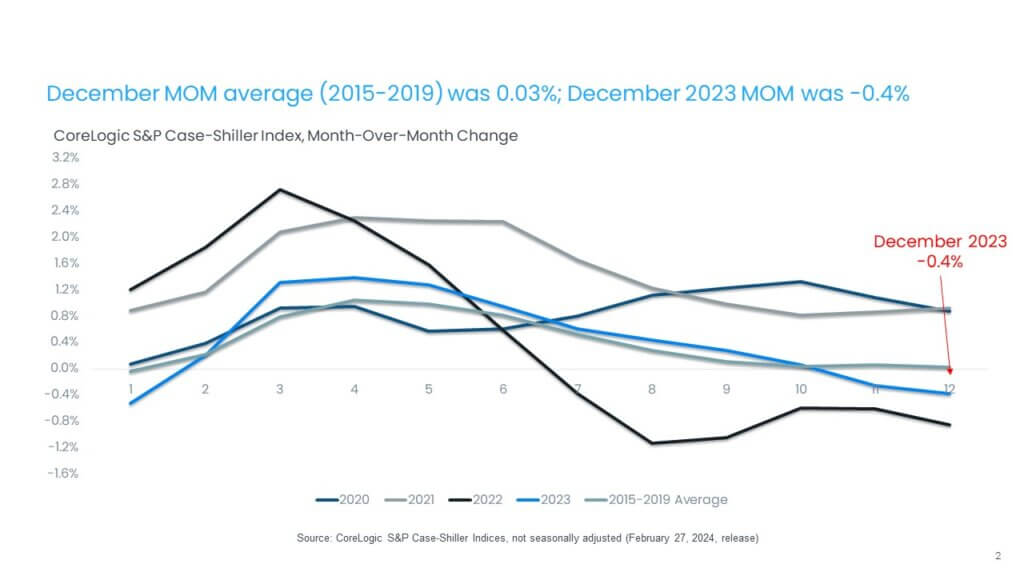
High mortgage rates continued to impact monthly price gains in December, with the non-seasonally adjusted month-over-month index declining for the second time since January 2023, down by 0.4% in December, compared with the seasonally adjusted no change recorded on average between 2015 and 2019 (Figure 2).
The 10-city and 20-city composite indexes posted six months of annual increases in December, up by 7% and 6.1%, respectively. Both indexes are also up by 7.4% and 6.7%, respectively, since the beginning of 2023. The 10-city index includes currently better-performing metro areas such as New York and Chicago, which have seen relatively stronger housing markets since mid-2022, as the return to cities and offices continues. Many of these metros are catching up on home prices gains that pandemic-era boomtowns experienced during COVID-19. The metros with the strongest gains since the beginning of 2023 include San Diego, (up by 9.9%), Detroit (up by 9.1%) and Chicago (up by 8.6%).
Compared with the 2006 peak, the 10-city composite index is now 47% higher, while the 20-city composite is up by 54%. Adjusted for inflation, which is showing signs of easing, the 10-city index is now 1% higher than its 2006 level, while the 20-city index is up by 5% compared with its 2006 high point. Nationally, home prices are 15% higher (adjusted for inflation) compared with 2006.
© 2024 CoreLogic,Inc., All rights reserved.
© 2024 CoreLogic,Inc., All rights reserved.
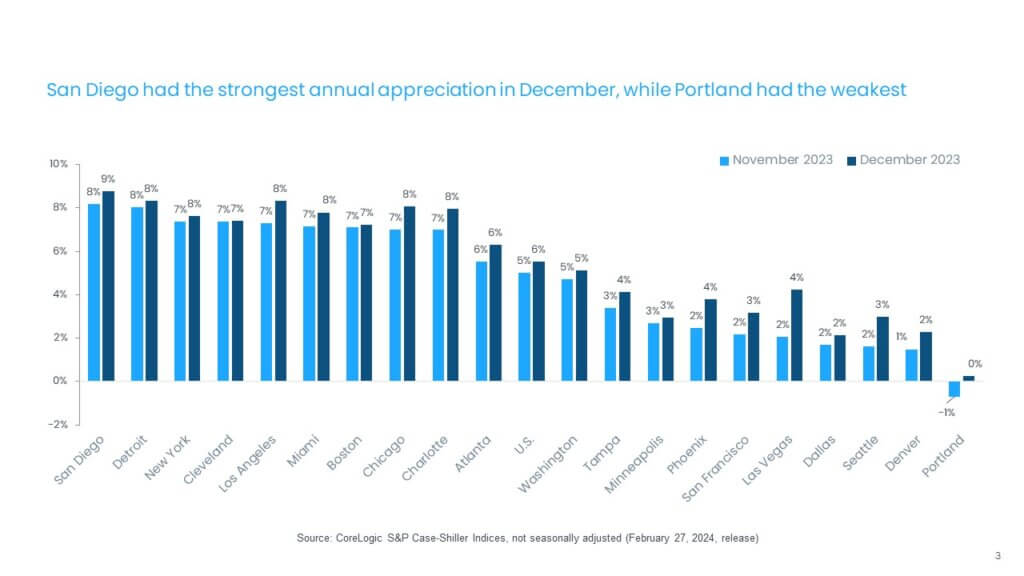
In December, all metros saw faster price growth year over year compared with the prior month (Figure 3). Acceleration in annual gains mostly reflects declining prices seen in December of 2022.
San Diego (up by 8.8%) and Los Angeles and Detroit (both up by 8.3%) now lead the 20-city index. These metros are followed by Chicago and Charlotte, North Carolina, up by 8.1% and 8%, respectively.
However, the strongest month-over-month price acceleration was again seen in the Western U.S., particularly in Las Vegas, Phoenix, Seattle and Los Angeles. And while no metros posted slowing annual gains, Minneapolis, Detroit and Boston showed almost no change in year-over-year increases compared with the previous month.
© 2024 CoreLogic,Inc., All rights reserved.
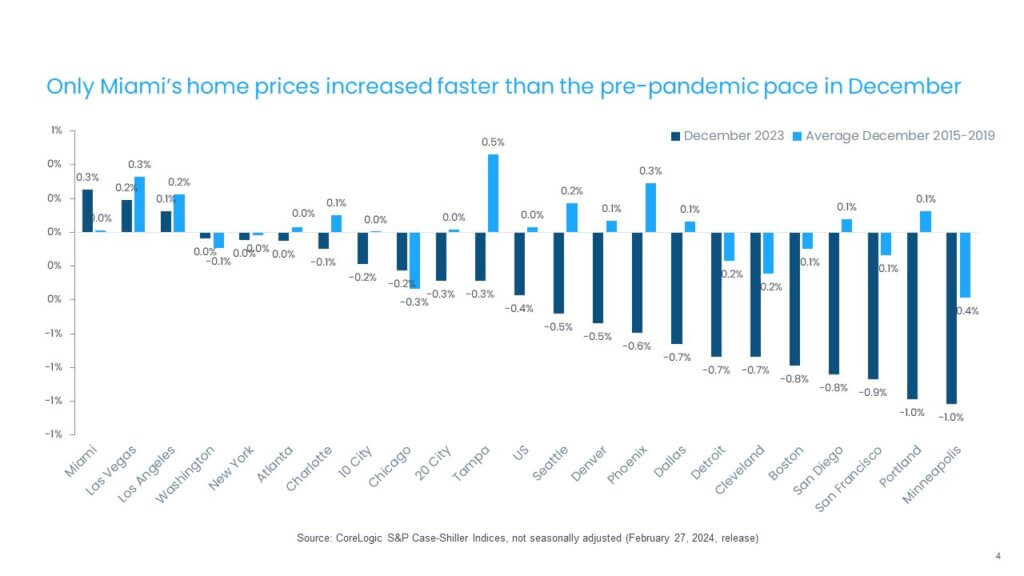
While home prices declined by 0.4% nationally from November to December, regional variances continued. Figure 4 summarizes the current year’s monthly changes in December compared with averages recorded between 2015 and 2019.
Miami and Las Vegas posted the nation’s largest monthly gains, 0.3% and 0.2%, respectively. Detroit, which saw strength in home price growth in recent months, cooled off in December and posted a 0.7% decline, which was a larger decrease than seen in this period in Detroit prior to pandemic. In general, high mortgage rates in October and November of 2023 had an increasingly depressing impact on home prices in December before rates took a downward turn at the very end of the year.
Overall, 14 metro areas posted monthly price declines in December. Minneapolis and Portland, Oregon topped the list, with 1% declines in prices over the month – relatively more than these metros tend to see (Figure 4).
© 2024 CoreLogic,Inc., All rights reserved.
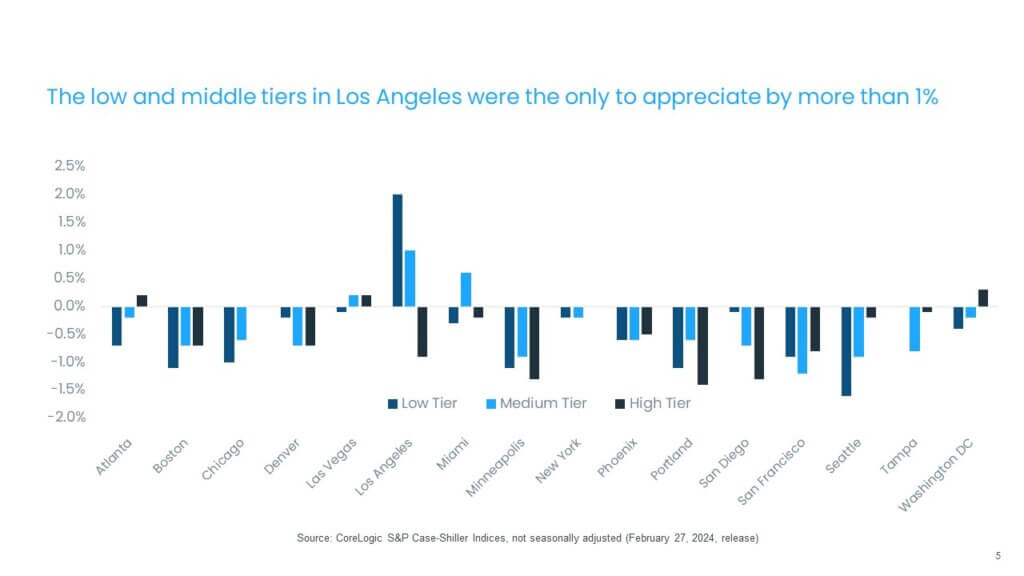
The month-over-month comparison of appreciation by price tier and location also reveals relative changes in demand across the country. In December, most metros and price tiers saw home prices fall. The largest slowdowns were in the high tier in Portland, Minneapolis and San Diego, while the high tiers in Washington, Las Vegas and Atlanta fared on the positive side. But all tiers on average saw price declines (Figure 5).
© 2024 CoreLogic,Inc., All rights reserved.
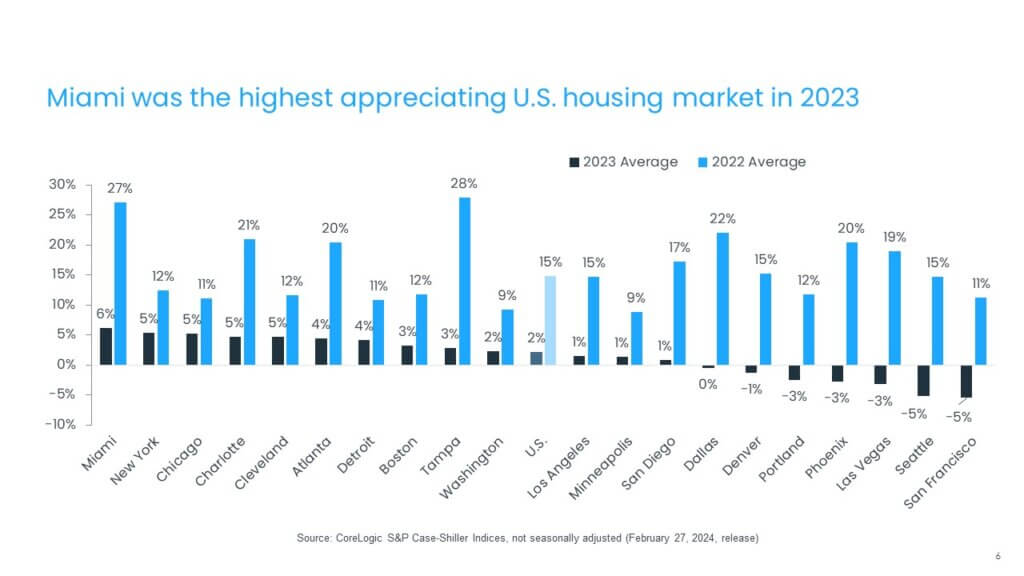
Lastly, Figure 6 illustrates average home price gains in 2023 compared with 2022. While 2023 saw a considerably slower rate of appreciation, areas in the South and Midwest continued to outpace the national average. The Northwest recorded declines for the year, though recent strength in that region suggests that home prices will bounce back in 2024.
© 2024 CoreLogic,Inc., All rights reserved.
While the S&P CoreLogic Case-Shiller Index continues to show home price resiliency against surging borrowing costs, it also highlights continued headwinds for the housing market, namely elevated mortgage rates and a severe lack of existing homes for sale. And as mortgage rates continue to hover in the 7% range, it will be difficult to convince existing homeowners to move at the current time. Nevertheless, as recent surge in mortgage application data has shown, following a drop in rates, buyers are anxiously waiting to jump into the market. That means that 2024 is likely to show another year of home price highs.
© 2024 CoreLogic,Inc., All rights reserved.
[ad_2]