US CoreLogic S&P Case-Shiller Index Moves Ahead Compared With 2023 Winter Bottom, Up by 6% Annually in January
A slight drop in mortgage rates coming into 2024 slowed winter home price declines
Mortgage rates dropped as 2024 began, leading to high housing market expectations. Nevertheless, with rates creeping up since the year started, the spring homebuying season is off to a weaker start than many had hoped for.
But signs of a thawing housing market are clear, especially when examining the availability of existing for-sale inventory, with new listings finally showing positive increases on an annual basis in recent months. And while more new listings give homebuyers more options, additional inventory could also prevent the home price spiral seen in the spring of 2023, particularly if mortgage rates decline further. Still, despite the expected slowing of home price growth in 2024, CoreLogic’s Home Price Index (HPI) forecasts another year of gains averaging about 3.2% for the year.
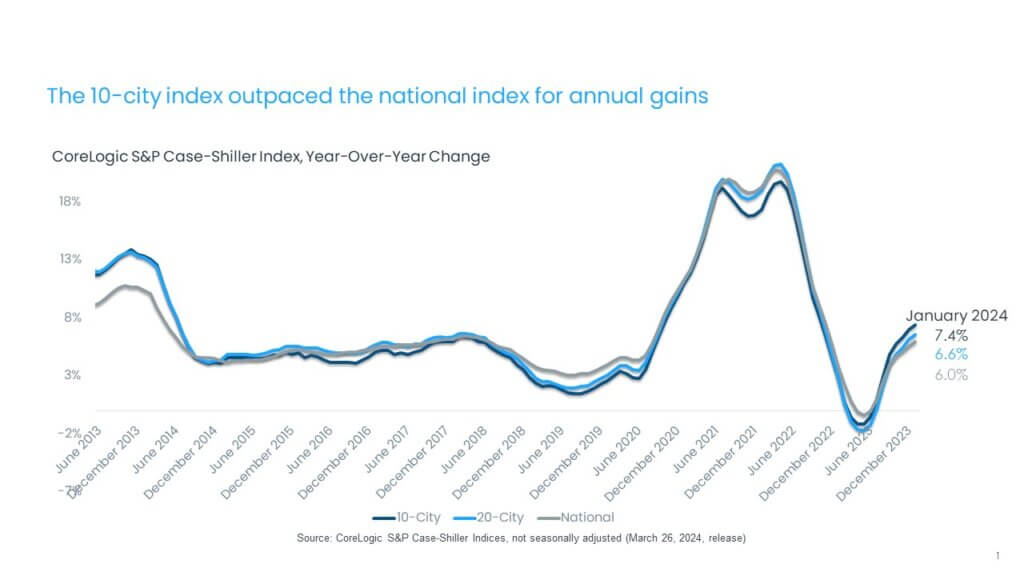
In January, the CoreLogic S&P Case-Shiller Index rose by 6% year over year, the seventh consecutive month of annual increases following two months of annual declines (Figure 1). With the rebound in appreciation in 2023, home prices are now up by 1% compared with the June 2022 peak and up by 6% from January 2023, when they bottomed out.
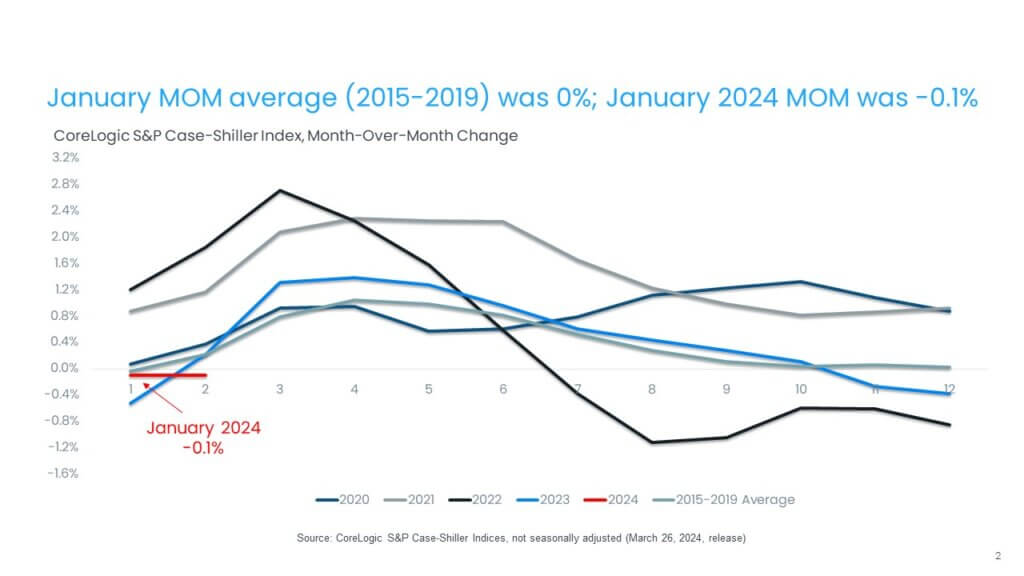
High mortgage rates continued to impact monthly price gains in January, with the non-seasonally adjusted month-over-month index declining for the third time since January 2023, down by 0.1% in January compared with the seasonally adjusted no change recorded on average between 2015 and 2019 (Figure 2). The January monthly decline is smaller than the 0.4% decline recorded in December and the 0.3% decrease seen in November.
The 10-city and 20-city composite indexes posted the seventh straight month of annual increases in January, up by 7.4% and 6.6%, respectively, the same increase since the January 2023 bottom. The 10-city index includes currently better-performing metro areas such as New York and Chicago, which have seen relatively stronger housing markets since mid-2022, as the return to cities and offices continues. Many of these metros are catching up on home prices gains that pandemic-era boomtowns experienced during COVID-19.
Among the top 100 largest metro areas, the five with the highest rate of home price appreciation this year are in Northeast, with most surrounding New York City, including Camden, New Jersey (up by 13%); Hartford, Connecticut (up by 13%) and Newark, New Jersey (up by 11%).
Compared with the 2006 peak, the 10-city composite index is now 47% higher, while the 20-city composite is up by 54%. Adjusted for inflation, which is showing signs of easing, the 10-city index is now 1% higher than its 2006 level, while the 20-city index is up by 5% compared with its 2006 high point. Nationally, home prices are 15% higher (adjusted for inflation) compared with 2006.
© 2024 CoreLogic,Inc., All rights reserved.
© 2024 CoreLogic,Inc., All rights reserved.
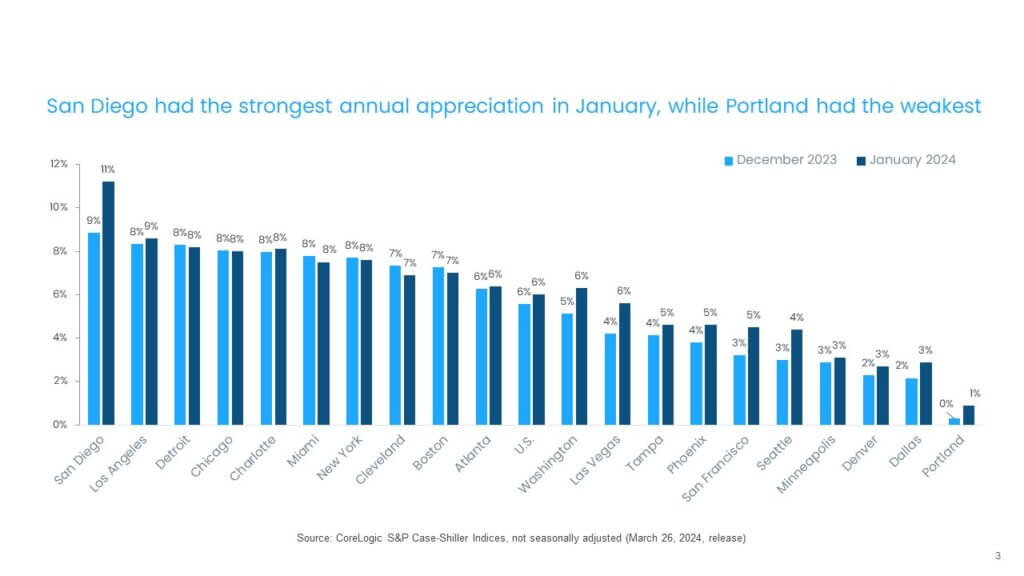
In January, 14 metros saw faster price growth year over year compared with the previous month (Figure 3). Acceleration in annual gains continues to reflect a comparison with the home price bottom in January 2023.
San Diego, Los Angeles and Detroit continued to lead the 20-city index, with respective annual gains of 11.2%, 8.6% and 8.2%. Eleven metros saw annual prices gains higher than the national 6% increase.
The strongest annual price acceleration compared with the previous month was again seen in the Western U.S., particularly in San Diego, Seattle, San Francisco and Las Vegas.
On the other hand, while still showing annual gains, Cleveland, Boston and Miami reported slowing appreciation in January. Portland, Oregon saw the slowest rate of home price gains, up by 1% compared with January 2023.
© 2024 CoreLogic,Inc., All rights reserved.
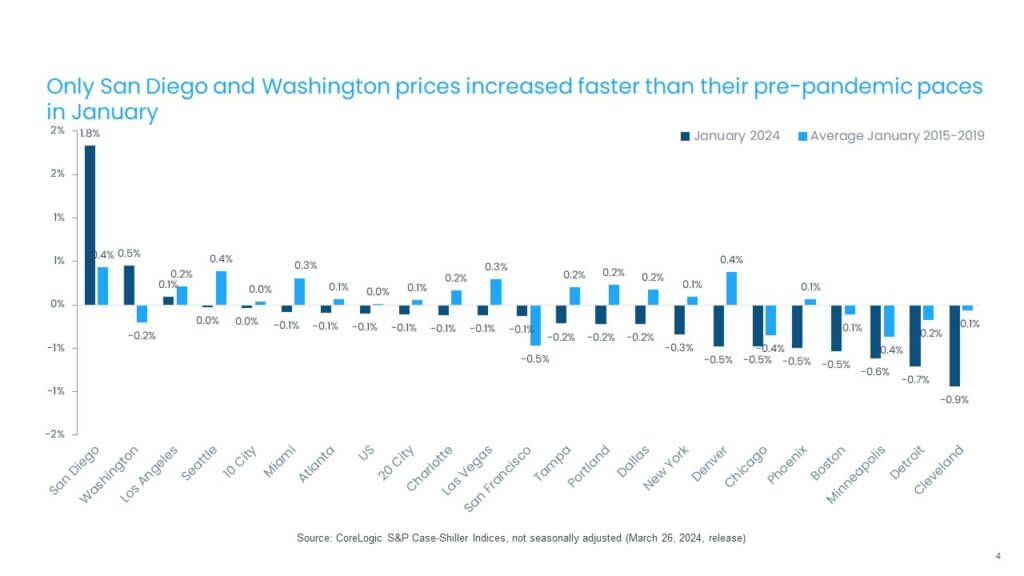
While home prices declined by 0.1% nationally from December to January, regional variances continued. Figure 4 summarizes the current year’s monthly changes in January compared with averages recorded between 2015 and 2019.
San Diego and Washington posted the nation’s largest monthly gains, a respective 1.8% and 0.5%. Metros in the Midwest, including Cleveland, Detroit, Minneapolis and Chicago, which saw strength in home price growth in recent months, cooled off in January. In general, while high mortgage rates at the end of 2023 had an increasingly dampening impact on home prices by the end of the year, more affordable Midwestern metros continued to struggle with affordability challenges as mortgage rates remained elevated.
And while all metros except for San Diego, Washington and Los Angeles posted monthly declines, decreases were relatively stronger in Cleveland and Denver in January compared with trends in monthly changes seen prior to the pandemic (Figure 4).
© 2024 CoreLogic,Inc., All rights reserved.
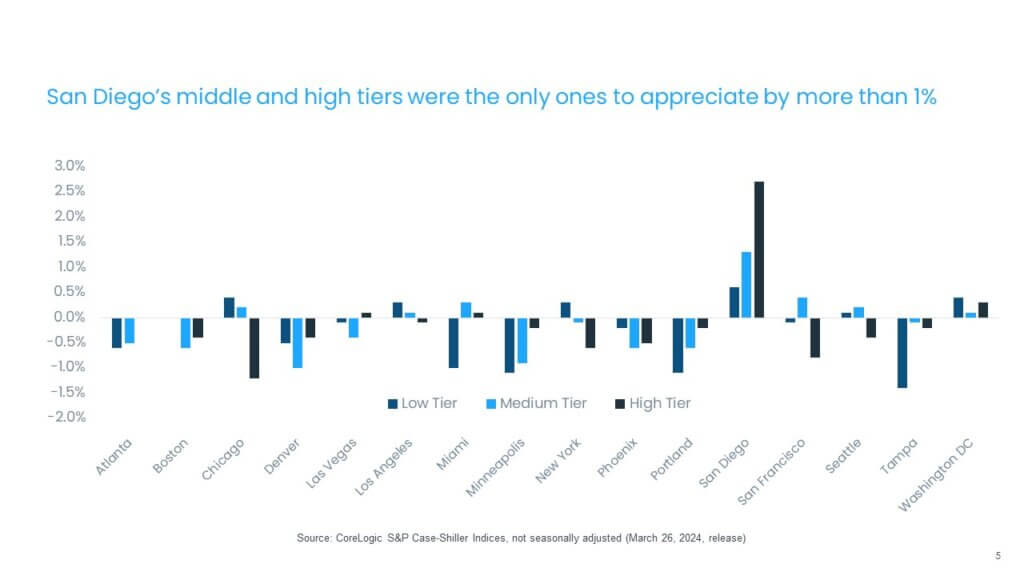
The month-over-month comparison of appreciation by price tier and location also reveals relative changes in demand across the country. In January, most metros and price tiers saw home prices fall, except for the exceptionally strong gains seen in San Diego, particularly in the high tier. The largest slowdowns were in the low tier in Tampa, Florida; Portland; Minneapolis and Miami. All tiers on average saw price declines (Figure 5).
© 2024 CoreLogic,Inc., All rights reserved.
While the S&P CoreLogic Case-Shiller Index continues to show home price resiliency in the wake of surging borrowing costs, it also highlights continued headwinds for the housing market, namely affordability challenges for potential homebuyers due to rising home prices and elevated mortgage rates. Also, the slowing of gains in some affordable regions reflects greater sensitivity to higher homeownership costs in those areas. But improvement in the availability of new listings is a welcome change, which may help relieve some pressure on home prices going forward.