Analysis on Using 3D Scanning and BIM to Reduce the Physical and Non-Physical Construction Waste for Sustainable Fireproofing of Steel Trusses
[ad_1]
1. Introduction
The AEC industry is one of the most important industries in the global economy, but it is very inefficient because productivity in this sector has been on a downward trend for more than 30 years [1], and also because about 57% of costs in this industry are generated by different types of waste [2]. Waste represents losses caused by the consumption of material or non-material resources that generate direct or indirect costs without adding value to the final product [3]. Construction waste is classified into physical waste that includes material waste and non-physical waste that is generated by time and cost overruns [4]. Reducing this waste is very important to reduce the environmental impact of the construction industry. Studies conducted by different authors demonstrate that, in general, 3D laser scanning facilitates fast and accurate data acquisition, and that these data can be used to produce a 3D model in BIM software to automatically generate accurate areas or bills of quantities (BOQ) [5].
1.1. Steel Fireproofing
Steel trusses are structures composed of multiple small-section profiles that have the advantage of being able to cover very large spans in an economical manner and with low material consumption. The configuration of these trusses generates several challenges in terms of fire resistance, surveying, modeling in BIM programs, and then calculating the coverage areas of the steel profiles for fireproofing. Regarding the fire performance of steel elements, it should be noted that they are non-combustible, but without protection, they can resist fire for only 15 min. The main reason is that, at temperatures above 550 °C, steel loses more than 50% of its strength, and in case of fires and standard tests, these temperatures are reached in about 5 min [6]. Fire protection of steel structures is achieved through active systems involving the use of fire-fighting systems (extinguishers and sprinklers) and passive systems involving the covering of steel elements with different materials that increase fire resistance (intumescent coating, cement-based coatings, and fire-resistant board) [7]. Intumescent coatings are often chosen as a fire protection solution because they are applied similarly to paint and are therefore quick to apply, thin, lightweight, do not take up space, and do not affect the appearance of the metal structure [8]. The fire resistance of these paints is determined by the thickness of the coating, and this is related to the cross-section of the steel elements and the design temperature. Depending on this thickness, the intumescent coating must be applied in one or more layers. In the case of multilayer applications, the correct calculation of the coverage areas becomes very important, as it leads to a multiplication of the amount of waste or losses generated as a result of purchasing an excessive or insufficient amount of paint.
Statistics presented by Eurostat in 2020 highlight that the construction industry is the main waste generator in Europe, being responsible for 37.5% of the waste generated. These statistics also highlight that, from 2004 to 2020, the amount of waste produced by the construction industry increased by 12.5% [9]. At the same time, the studies carried out in the UK revealed that 13% of the materials that arrive at construction sites are thrown away, without being used [10]. Also, in the construction sector, cost overruns are a common phenomenon generated by several factors. Most often, cost overruns are caused by time overruns, frequent project changes, and inaccurate time and cost estimates [11]. Part of these estimation errors are caused by the fact that the areas underlying the estimates are calculated incorrectly.
Areas and BOQs are traditionally extracted manually from 2D drawings, but this process is very slow, requires higher effort, and presents high risks in terms of results’ accuracy because this process involves the interpretation of information extracted from 2D drawings that often do not capture all the data necessary to understand complex structures like steel trusses [12]. For projects that involve interventions on existing buildings, these 2D drawings are often made using traditional survey techniques, which, in the case of complex structures, including the steel trusses studied in this paper, involve another process of abstraction and approximation of the structure. Therefore, all of these phases that take place before establishing the BOQ assume a series of data interpretations that can cause the accumulation of errors, the obtainment of wrong quantities, and, ultimately, physical or non-physical waste.
To reduce or even eliminate these deficiencies, the traditional survey process can be replaced by terrestrial laser scanning surveys to generate point clouds that can be processed in Building Information Modeling (BIM) software to create more accurate 3D models, 2D drawings, and quantities.
1.2. Terrestrial Laser Scanning (TLS)
This advanced surveying technique utilizes laser beams to capture highly detailed and precise three-dimensional information about the surveyed environment. The statistics associated with 3D terrestrial laser scanning underscore its growing significance in the construction industry and quantity surveying practices [13]. One key statistic highlighting the efficiency of 3D laser scanning is its rapid data acquisition speed. Traditional surveying methods using pen, paper, and measuring tapes, and also methods involving the use of total station class surveying equipment, often require significant time and resources to collect data, particularly in large and complex construction sites. In contrast, 3D laser scanning can capture thousands of points per second, allowing for swift and comprehensive data acquisition. This efficiency not only accelerates the surveying process but also minimizes disruptions to ongoing construction activities [14,15,16].
Another notable statistic pertains to the level of detail achievable through 3D laser scanning. This technology can produce highly accurate point clouds, representing millions of individual points in a surveyed space. This wealth of data enables quantity surveyors to create precise and detailed models of existing structures or construction sites, facilitating more accurate quantity takeoffs and cost estimations. The ability to capture intricate details with minimal human intervention enhances the reliability of the surveying process.
Three-dimensional terrestrial laser scanning has emerged as a revolutionary technology in the field of quantity surveying, offering unprecedented capabilities for accurate and efficient data collection. With the help of a 3D laser scanner, a 3D point cloud is generated by using a time-of-flight technique for computing the 3D coordinates of consistent areas, which are then modeled to obtain a 3D as-built replica of the real world. Due to the capability to obtain a massive volume of data in a relatively short time, this approach is suitable for large-scale and infrastructure projects [17,18], such as the measurement and modeling of bridges and tunnels (without disrupting ongoing traffic and endangering the lives of the surveyors), the modeling of complex industrial sites, and the digital conservation of buildings with valuable architectural details.
In terms of safety, 3D terrestrial laser scanning also presents compelling statistics. The non-contact nature of laser scanning reduces the need for surveyors to physically access hazardous or hard-to-reach areas. This enhances overall project safety by minimizing the risks associated with on-site data collection, particularly in complex construction environments [19]. Regarding the surveying of steel trusses, it should be noted that there are several challenges due to their geometrical complexity and the fact that these structures are often positioned at great heights, making it unsafe, difficult, or even impossible to understand the configuration and details of these structures to be surveyed manually using conventional techniques. The non-contact nature of laser scanning reduces the need for surveyors to physically access hazardous or hard-to-reach areas. This enhances overall project safety by minimizing the risks associated with on-site data collection, particularly in complex construction environments [7]. However, laser scanning also presents some challenges in terms of data acquisition due to the complex configuration of the steel truss, which results in shadowed areas where the laser beam cannot reach [20]. This problem can be overcome by using multiple terrestrial stations or positioning them according to this limitation by using UAVs (Unmanned Aerial Vehicles) equipped with scanning instruments to complement the data acquired by terrestrial scanning [21], or by collecting data using conventional techniques (manual surveying and photographs) when possible.
1.3. Building Information Modeling (BIM)
Three-dimensional models contain robust data about construction projects that are essential to the BIM (Building Information Modeling) process and are far superior to traditional construction approaches. BIM workflows provide the ability to classify and organize project-related data, such as construction typology, building geometry, and material properties, that can be used to make informed decisions [22,23,24,25].
BIM is a complex process that involves, among other things, a software component that facilitates the production of 3D models, their analysis, and communication between all the stakeholders involved in the project [26,27]. Thus, improving the level of automation in the AEC domain progressively becomes a standard in many countries [28].
Studies comparing traditional quantity surveying techniques with those based on the automatic extraction of quantities from the BIM model demonstrate that the use of this methodology has multiple advantages, such as streamlining calculation processes by increasing accuracy and productivity [29]. At the same time, some studies highlight that, by using BIM software instead of the traditional method, the time required to make quantity takeoffs and estimates can be reduced by 80%, and the results obtained can have deviations of up to 3% [30].
It is important to note that these advantages depend, to the greatest extent, on the level of detail (LOD) of the BIM model [19,31,32]. The fact that detailing the BIM model leads to increased design times and costs means that the BIM model is rarely detailed enough to be used in extracting BOQs [33,34]. The study carried out by Olson and Taylor highlights the fact that BIM models that reach general contractors contain only 50% of the information needed to extract quantities because they do not contain finishes; temporary structures; mechanical, electrical, and plumbing installations; and landscaping [30,33,35]. A similar situation occurred in the project presented in this article. The initial project that was carried out for the modernization of the University of Oradea auditorium building did not have the BOQ required for contracting the steel trusses’ fireproofing, and to get these quantities, it was necessary to carry out the research presented in this article.
Taking all of these aspects into account, the research presented in this paper has a few distinct goals that represent the main research motivation and significance of the paper: (a) analyzing the implications of using 3D laser scanning and BIM software on the calculation of steel truss-fireproofing coverage areas; (b) a sustainable methodology of an efficient and accurate combination that integrates the TLS technology and traditional survey to rigorously calculate the areas to avoid the production of non-physical waste; and (c) a comprehensive analysis of a few key elements that are prone to the shadowing effect that appears in highly complex construction structures that can blunder the 3D model. Furthermore, the proposed methodology for quantity surveying using the 3D TLS and traditional survey techniques for assessing the non-physical waste represents a novelty in advanced research in sustainability in the AEC sector.
Although the research shows no material waste, the innovation within the article presents a more unpleasant type of waste—the so-called non-physical waste which is generated because of cost and time overruns. The cost overruns imply that the actual cost of fireproofing is higher than the approved budget for this work, and that an additional budget needs to go through all administrative procedures from the beginning to be able to complete the work. Thus, it results in a chain effect, resulting in time overruns caused by the fact that, for public investments, approvals for budget supplements involve a time-consuming bureaucratic process, and the construction team that performs the fireproofing works has to stop and relocate both materials and human assets until the necessary budget is approved.
2. Materials and Methods
2.1. The Case Study: Aula Magna Hall of the University of Oradea
The Aula Magna Hall, situated within the campus of the University of Oradea, stands as a distinguished facility within this esteemed institution of higher learning. Renowned as the most expansive hall within the university, it is frequently used for a plethora of significant events, encompassing ceremonies, conferences, seminars, and a variety of other scholarly activities. Architecturally, it is designed to accommodate a capacity of 300 individuals. The Aula Magna is a component of Building F (Figure 1a,b), which was constructed in the period spanning from 1993 to 1998. This particular building underwent rehabilitation as a part of the “SMART Campus—University of Oradea” project. Within this framework, the present research emerged, especially since one of the rehabilitation’s objectives encompassed fire safety.
The campus’s contemporary character is defined by several key elements:
- ➢
-
The university buildings have undergone an organic evolution, incorporating the architectural nuances of the Secessionist style. This is exemplified by 12 heritage buildings of significant value, constructed between 1911 and 1913, under the guidance of architect Jozsef Vago. The project, while retaining the essence of their spatial organization, originally commenced as a Gendarmerie School [36].
- ➢
-
The implementation of initiatives like “SMART Campus—University of Oradea” demonstrates a dedication to modernization, technological integration, and enhanced accessibility. These efforts underscore a strategic pivot towards innovation and technological advancement within the university’s framework.
- ➢
-
The EU GREEN project, spearheaded by the University of Oradea, places a strong emphasis on sustainability and educational approaches to sustainable development. The university’s active participation in this project signifies a robust commitment to fostering sustainable development principles. Through this project, there is a concerted effort to elevate the level of awareness and engagement among faculty and students concerning sustainable development concepts.
The interdisciplinary nature of these initiatives has fostered a project that serves as a testament to the interpretation of field data, aiming to convert this information into the most precise quantifiable measures for the hall’s rehabilitation project. Additionally, this rehabilitation effort has been augmented by incorporating adjustments to align with the latest fire safety standards.
The metal roof truss over the Aula Magna Hall is a spatial structure composed of transversally arranged truss beams, supported by the reinforced concrete structure, with a span of 20.45 m. The spatial structure is stiffened longitudinally through roof panels fixed over the top chord, at the nodes of the truss beams, and by cross bracings arranged in the plane of the roof. At the lower part, the stiffening of the trusses is achieved through longitudinal beams. Additionally, the bottom horizontal chord of the truss beam is equipped with a fastening system for the suspended ceiling, which uses tension rods, over which mineral wool thermal insulation is laid.
The members of the truss beam are composed of sections made from two equal-flange angles slightly spaced apart, joined together by gusset plates, and fixed through welding. Laminated steel profiles with standardized sections were used. Subsequently, the metal structure was protected against corrosion by at least two layers of paint, which increased the dimensions of the metal profiles identified in the survey. To verify the accuracy of the manual survey and the 3D scanning, it was necessary to establish the initial size of the sections. The initial section of the metal elements was determined based on the standard dimensions of the steel profiles, as given in technical catalogues for hot-rolled steel profiles.
2.2. Traditional Surveying Methods and Terrestrial Laser Scanner Surveying
In the context of our project, the execution of the traditional survey necessitated a specific set of tools, comprising a clipboard, A4 paper sheets, a graphite pencil, a standard tape measure, and a caliper. The methodological approach to the surveying process involved several critical stages.
This methodical process was pivotal in ensuring the collection of precise and comprehensive data necessary for the accurate 3D modeling of the elements in the subsequent phases of the project.
The initial phase involved manually surveying and identifying the profiles through the use of standard catalogues. The traditional surveying process of a steel frame truss structure was made manually, using simple tools like a measuring tape for assessing the dimensions of the steel profiles and a caliper to measure their thickness. Several sketches of sections of the roof structure had to be made on paper on-site in order to mark the specific dimensions of the different measured members. Firstly, the profiles were marked with the actual measured dimensions. Secondly, after completing the manual survey, the steel sections identified were compared with the standard steel sections from technical catalogues for hot-rolled steel profiles.
The steel profile catalogues give the exterior surface of a standard profile based on its section dimensions. The steel structure was protected against rust with at least two coats of paint. In addition, in the corners of the flanges and especially on the lower joints, layers of cemented dust increased the dimensions of the steel sections in comparison with the initial standard section. Thus, in order to manually determine the actual fireproofing surface, the steel sections had to be approximated to a standardized section. Regarding this project, it was not possible to carry out a full survey using traditional techniques because of the lack of safe access to most of the roof elements, but also because the process would not have been time-efficient due to the complexity of the structure. Therefore, the survey process relied mostly on terrestrial laser scanning (TLS) technology.
Terrestrial laser scanning (TLS) is a geospatial surveying technique that utilizes laser technology to capture three-dimensional spatial information of objects and environments from a stationary position on the Earth’s surface. TLS is recognized for its accuracy, efficiency, and versatility in capturing complex geometries and has found application in fields such as architecture, engineering, geology, forestry, cultural heritage preservation, and quantity surveying [37]. The resulting point cloud data can be further processed and analyzed to derive valuable insights, making TLS a fundamental tool in modern geospatial research and spatial data acquisition [38]. The TLS is highly efficient if the resulting point cloud has an accuracy considerably higher than the changes from the real-word surface; however, the necessary changes in the real-word surface that have to be captured by the TLS have to be properly defined by the architect or the engineer. If the subtle changes that have to be measured by the TLS are in the order of a few millimeters, then the required TLS equipment has to be properly chosen because the point position is somewhere between ±2 and ±50 mm [39]. Although, if we are modeling the point cloud, we can improve the accuracy up to 20 times compared to single point accuracy, according to [40].
In general, there are four fundamental intricate steps to obtain a 3D geometric model from the resulting 3D point cloud [17]:
-
Data collection—using the 3D scanner to obtain the necessary point cloud of the specified construction site from different stations,
-
Data post-processing—referencing and geo-referencing of the assembly of all the stations from which we made the scanning and applying the necessary computational models for noise reduction and adjustment,
-
Geometric modeling of the refined point cloud to generate the 3D model as a mesh or as an object,
-
Generating the digital documentation.
For obtaining the 3D point cloud, we used the Trimble X7 laser scanner, which is a professional-grade terrestrial laser scanner designed for high-precision 3D scanning and data acquisition applications in fields such as construction, surveying, and building documentation. Trimble X7’s key features are as follows:
- ➢
-
High-speed scanning: The Trimble X7 is known for its fast and efficient data capture capabilities. It can rapidly collect dense point cloud data, allowing for the quick and comprehensive 3D scanning of structures and environments. The TLS is capable of working at speeds up to 500 kHz (thus capturing up to half a million points per second).
- ➢
-
Integrated imaging: The scanner typically comes equipped with integrated imaging capabilities, such as high-resolution cameras. This allows users to capture colored panoramic images alongside the 3D point cloud data, providing additional visual context.
- ➢
-
Automated operation: The X7 is designed to streamline the scanning process with automation features. Automated workflows and onboard software—we used the Trimble Perspective software 1.1.3 to assist in simplifying data capture, making it more accessible for users with varying levels of expertise.
- ➢
-
User-friendly interface: The device is often designed with a user-friendly interface to enhance the overall user experience. This includes a touch screen or other intuitive controls for easy operation in the field.
- ➢
-
Lightweight and portable: While still being a professional-grade scanner, the Trimble X7 is typically designed to be relatively compact and lightweight compared to some other laser scanning solutions, with the scanner weighing just 5.8 kg and measuring 178 mm (W) × 353 mm (H) × 170 mm (D) (both values without tripod), according to the data provided in Table 1. This enhances its portability and ease of transportation to different job sites.
- ➢
-
Accuracy and range: The scanner is engineered to provide high accuracy in point cloud data. It offers a range suitable for various applications, from close-range detailed scans to capturing data from a distance, with the range accuracy (measured distance between the scanner and object) being 2 mm and the absolute point accuracy of the 3D model being dependent on the scanner–object distance (Table 1, 3D point accuracy section).
The Trimble X7 is commonly used for applications such as building documentation, construction site monitoring, quality control, clash detection, and creating accurate as-built models.
Each individual scan is defined by a station and, thus, is identified by a number, a specified color, and a marked position; hence, the point cloud registration can be performed automatically in the field. This can be performed also with the help of the built-in Inertial Measurement Unit (IMU), which has the ability to orient the scanner when we move it from one station to another so that the initial cloud alignment can be obtained. The aforementioned point cloud registration or auto-registration is achieved typically with a high degree of success without any user input or intervention into the Trimble specific software.
The main surveying equipment that was used to obtain the 3D point cloud was the Trimble X7 scanner. The relevant technical specifications are listed in Table 1.
Table 1.
The technical specification of Trimble X7 laser scanner according to [41].
The technical specification of Trimble X7 laser scanner according to [41].
Table 1.
The technical specification of Trimble X7 laser scanner according to [41].
The technical specification of Trimble X7 laser scanner according to [41].
| Scan Parameters | Trimble X7 Specifications |
|---|---|
| Range principle | High speed, digital time-of-flight distance measurement data |
| Range noise | <2.5 mm @ 30 m |
| Range | 0.6–80 m |
| Field of view (degree) | 360° × 282° |
| Scan speed | Up to 500 kHz |
| Range accuracy | 2 mm |
| Angular accuracy | 21″ |
| 3D point accuracy | 2.4 mm @ 10 m, 3.5 mm @ 20 m, 6.0 mm @ 40 m |
| Scanning EDM laser class | Laser class 1, eye safe in accordance with IEC EN 60825-1 [42] |
| Laser wavelength | 1550 nm, invisible |
| Weight | 5.8 kg |
| Dimensions | 178 mm (W) × 353 mm (H) × 170 mm (D) |
2.3. Three-Dimensional Modeling BIM Software
The process of 3D scanning modeling was performed using the Revit 2021 software, which encompassed the following stages:
-
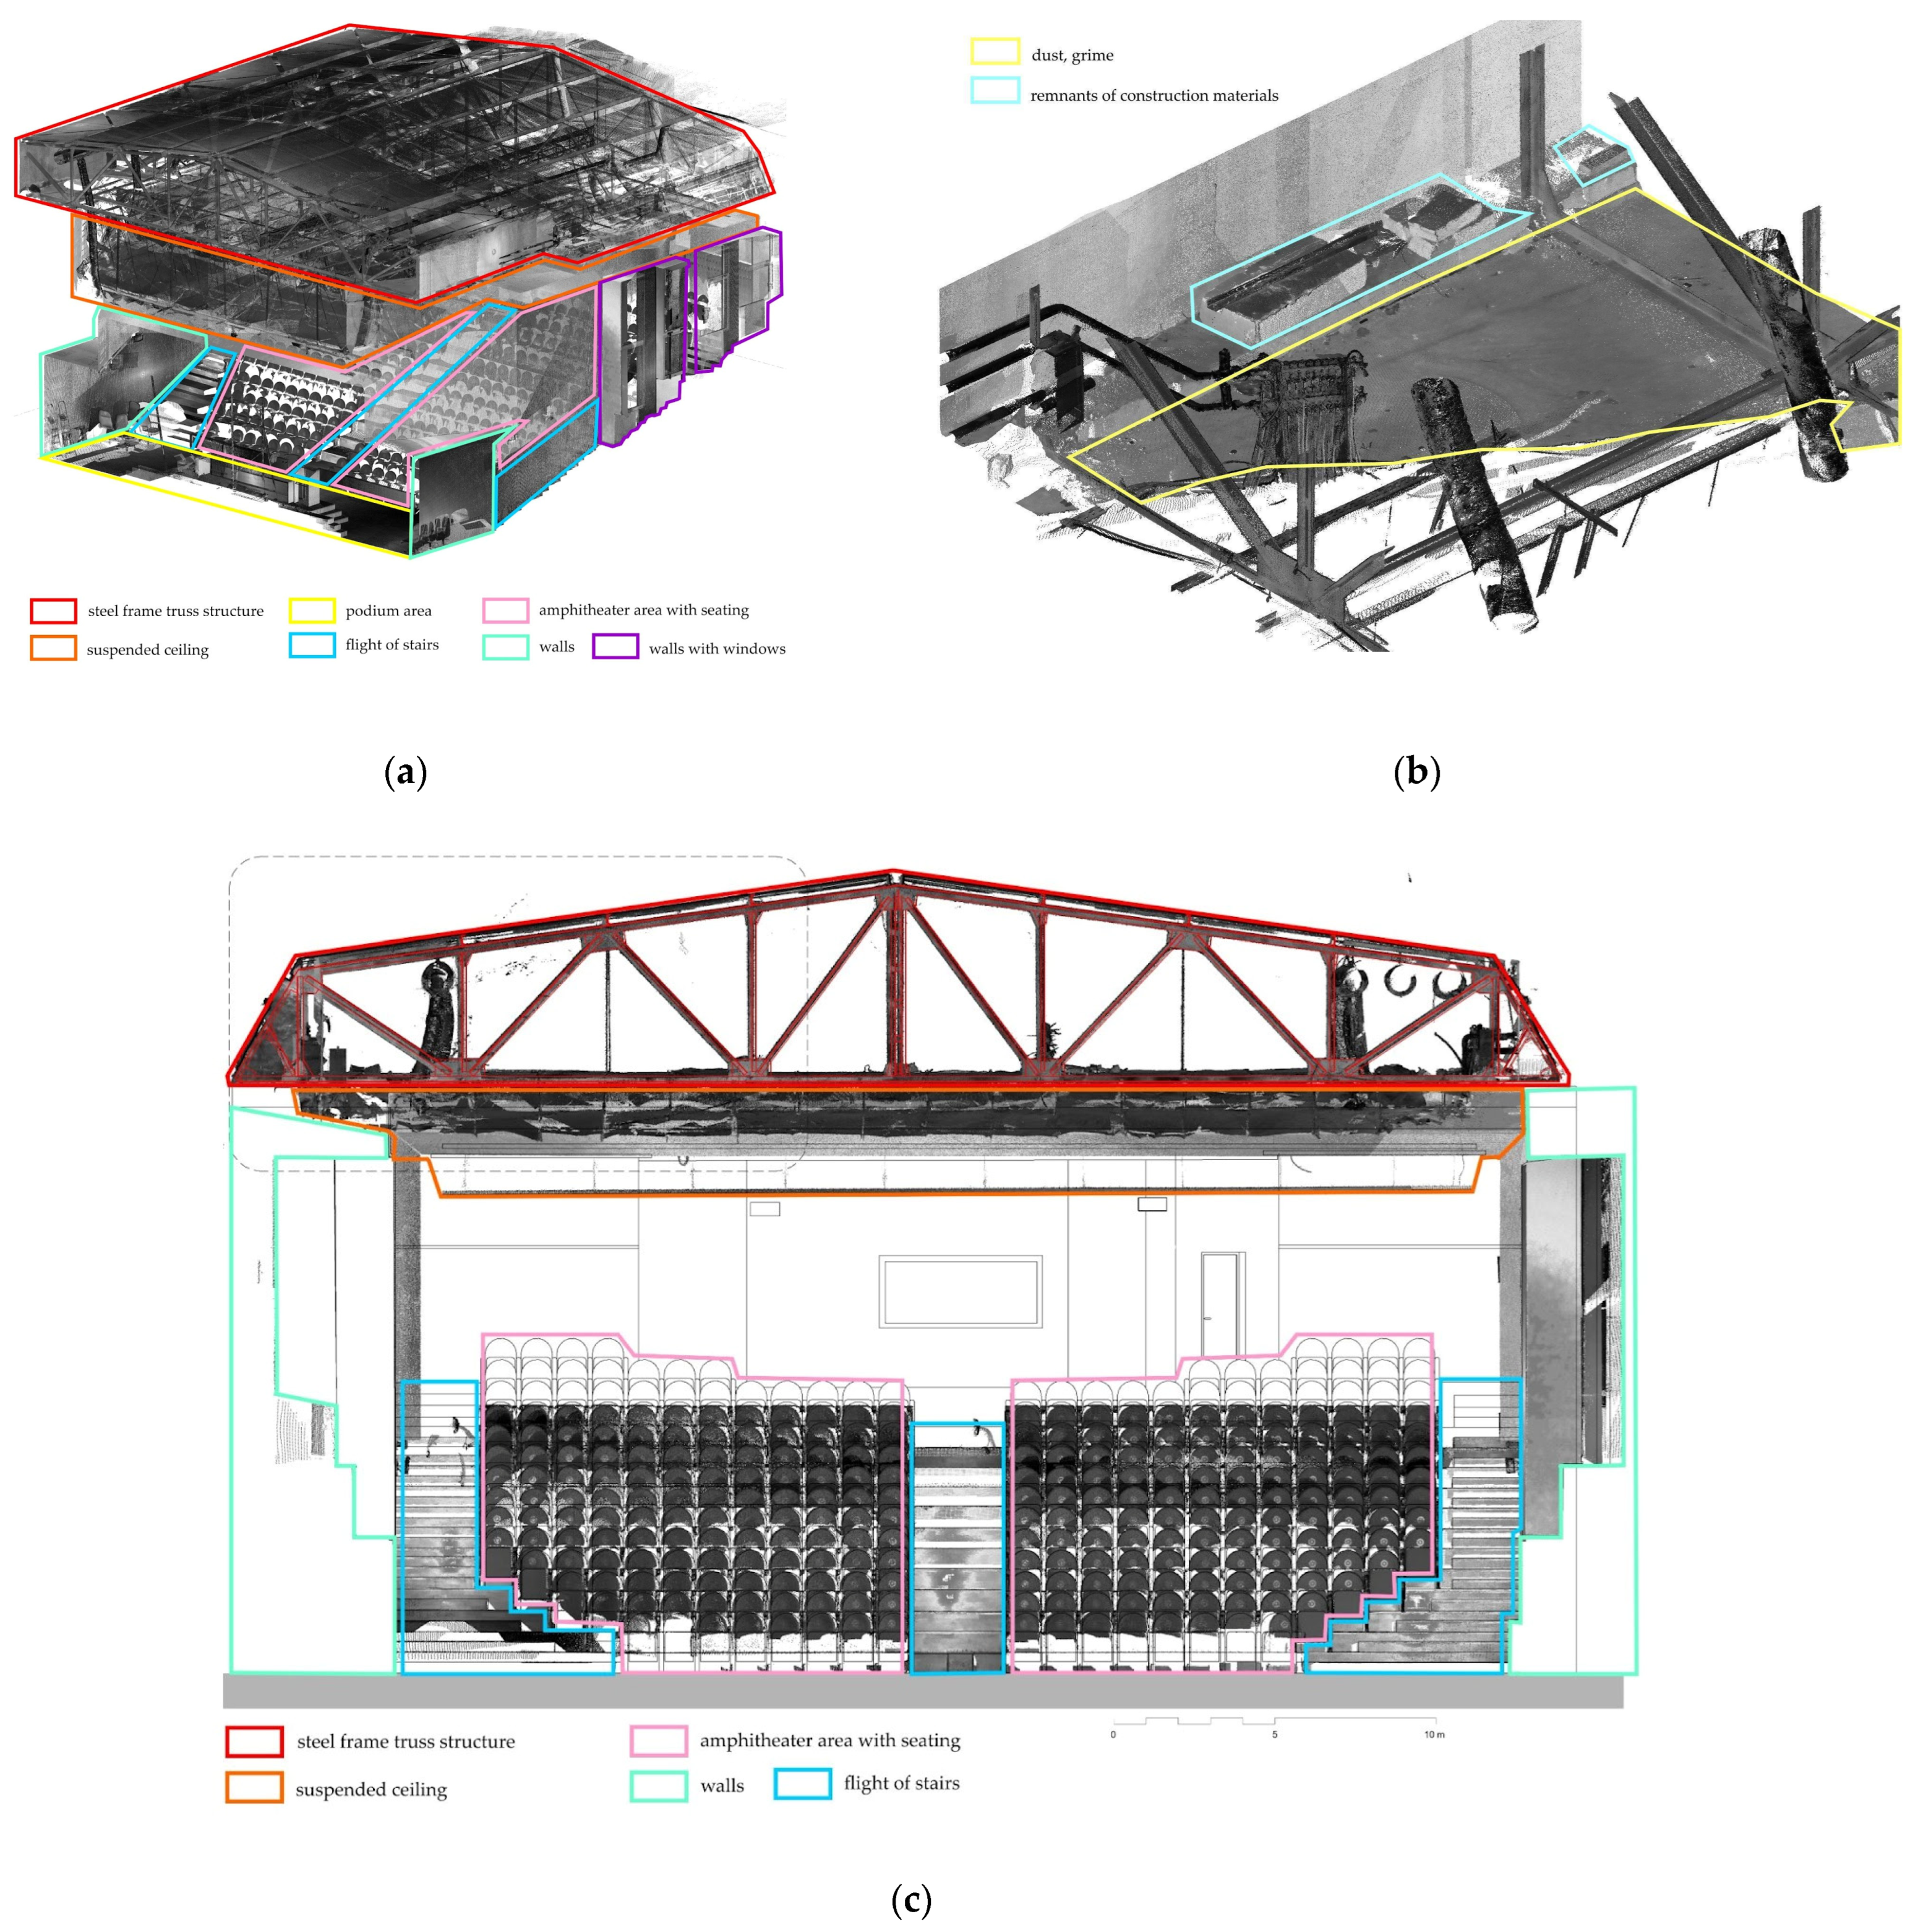
Data importation into Revit: After the processing of the raw data obtained from the scanning process, wherein errors and noise were eliminated, the 3D data were imported into Autodesk Revit. Revit is Building Information Modeling (BIM) software that is extensively used for the digital representation and management of building data. In Figure 2a, the 3D point cloud is shown as it appears after being imported into the program. This contains all the information about the building, such as the structural parts, partition walls, ventilation equipment, furniture, textile materials, and position of the windows. Additionally, the presence of undesirable substances, including dust, grime, and remnants of construction materials, was noted. In this specific case, as is observable in Figure 2b, these accumulations obstructed the precise identification of horizontal elements located directly on the floor.
Figure 2.
(a) 3D point cloud. (b) Identification of obstructed areas. (c) Section through the 3D scan depicts a two-dimensional representation of structural elements in red, and the representation of contextual elements (walls, windows, steps, and furniture) is made with black lines.Figure 2.
(a) 3D point cloud. (b) Identification of obstructed areas. (c) Section through the 3D scan depicts a two-dimensional representation of structural elements in red, and the representation of contextual elements (walls, windows, steps, and furniture) is made with black lines. -
Two- and three-dimensional modeling in Revit: The initial phase of modeling involved scrutinizing the scanned data to discern elements constituting the roof framing. Initial efforts included segmenting the scanned data to ascertain the profiles present within the framing structure. In Figure 2c, the identification of structural components is presented, followed by their representation in a two-dimensional format. The scan is shown in grayscale, with the red lines representing the identified contours of the structure. These profiles were initially drawn in a two-dimensional format, recognizing the existence of some unclear areas in the scan. Additionally, other blurred regions, as shown in Figure 3a,b, were later identified as ventilation ducts in the 3D modeling phase. In Figure 3c, the components constituting the truss beam are presented. These elements are as follows: bottom and top chord, webs, and gusset plates. Along with areas that could not be scanned, these are marked in red in Figure 4. The comprehensive 3D model was developed using the “Component/Model in-Place” tool in Revit, employing techniques such as Extrusion, Blend, and Sweep for this purpose [43].
Figure 3.
Detailed area: (a) representation in section—2D model. In this section the point cloud is colored green, yellow and purple, and the outline of the profiles is represented with red lines; (b) representation in axonometric view with 3D model; and (c) representation of a metallic profile in cross-section from a 3D point cloud.Figure 3.
Detailed area: (a) representation in section—2D model. In this section the point cloud is colored green, yellow and purple, and the outline of the profiles is represented with red lines; (b) representation in axonometric view with 3D model; and (c) representation of a metallic profile in cross-section from a 3D point cloud.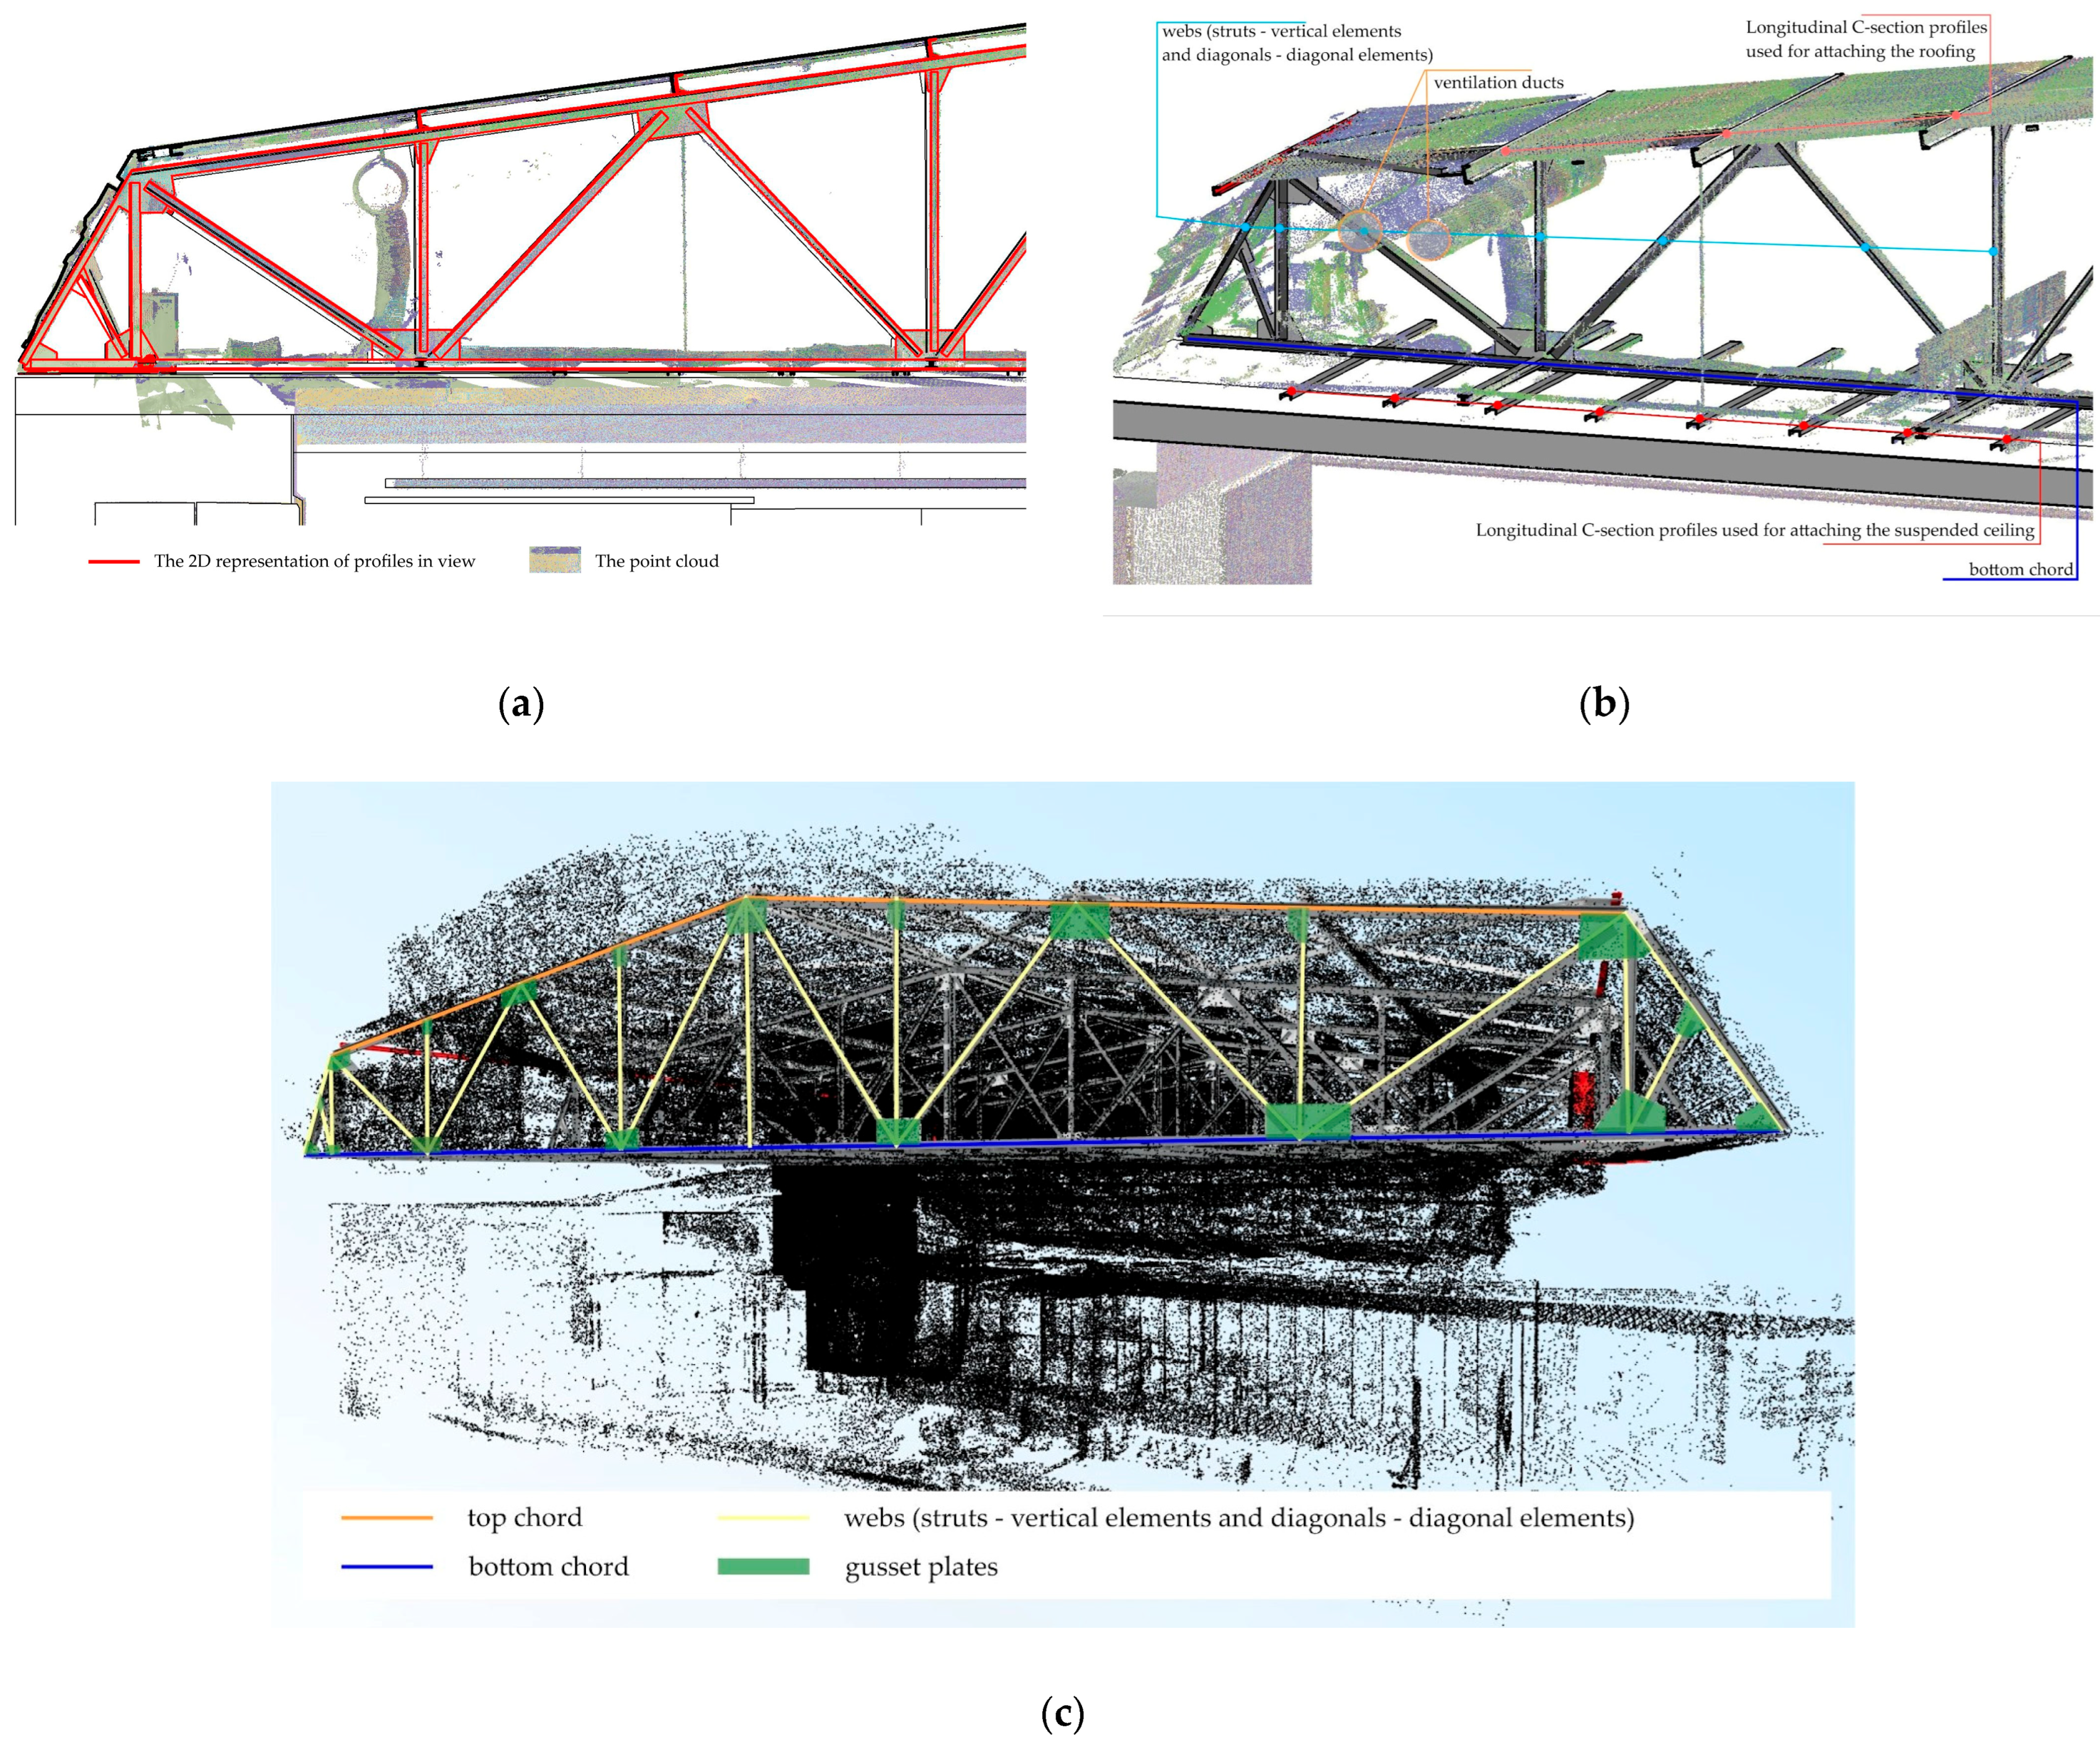
Figure 4.
(a) The 3D model created in Revit® and the marking of elements inferred from the repetitiveness of the structure. (b) Virtual reconstruction of unscanned elements (shown in red), based on existing geometry.Figure 4.
(a) The 3D model created in Revit® and the marking of elements inferred from the repetitiveness of the structure. (b) Virtual reconstruction of unscanned elements (shown in red), based on existing geometry.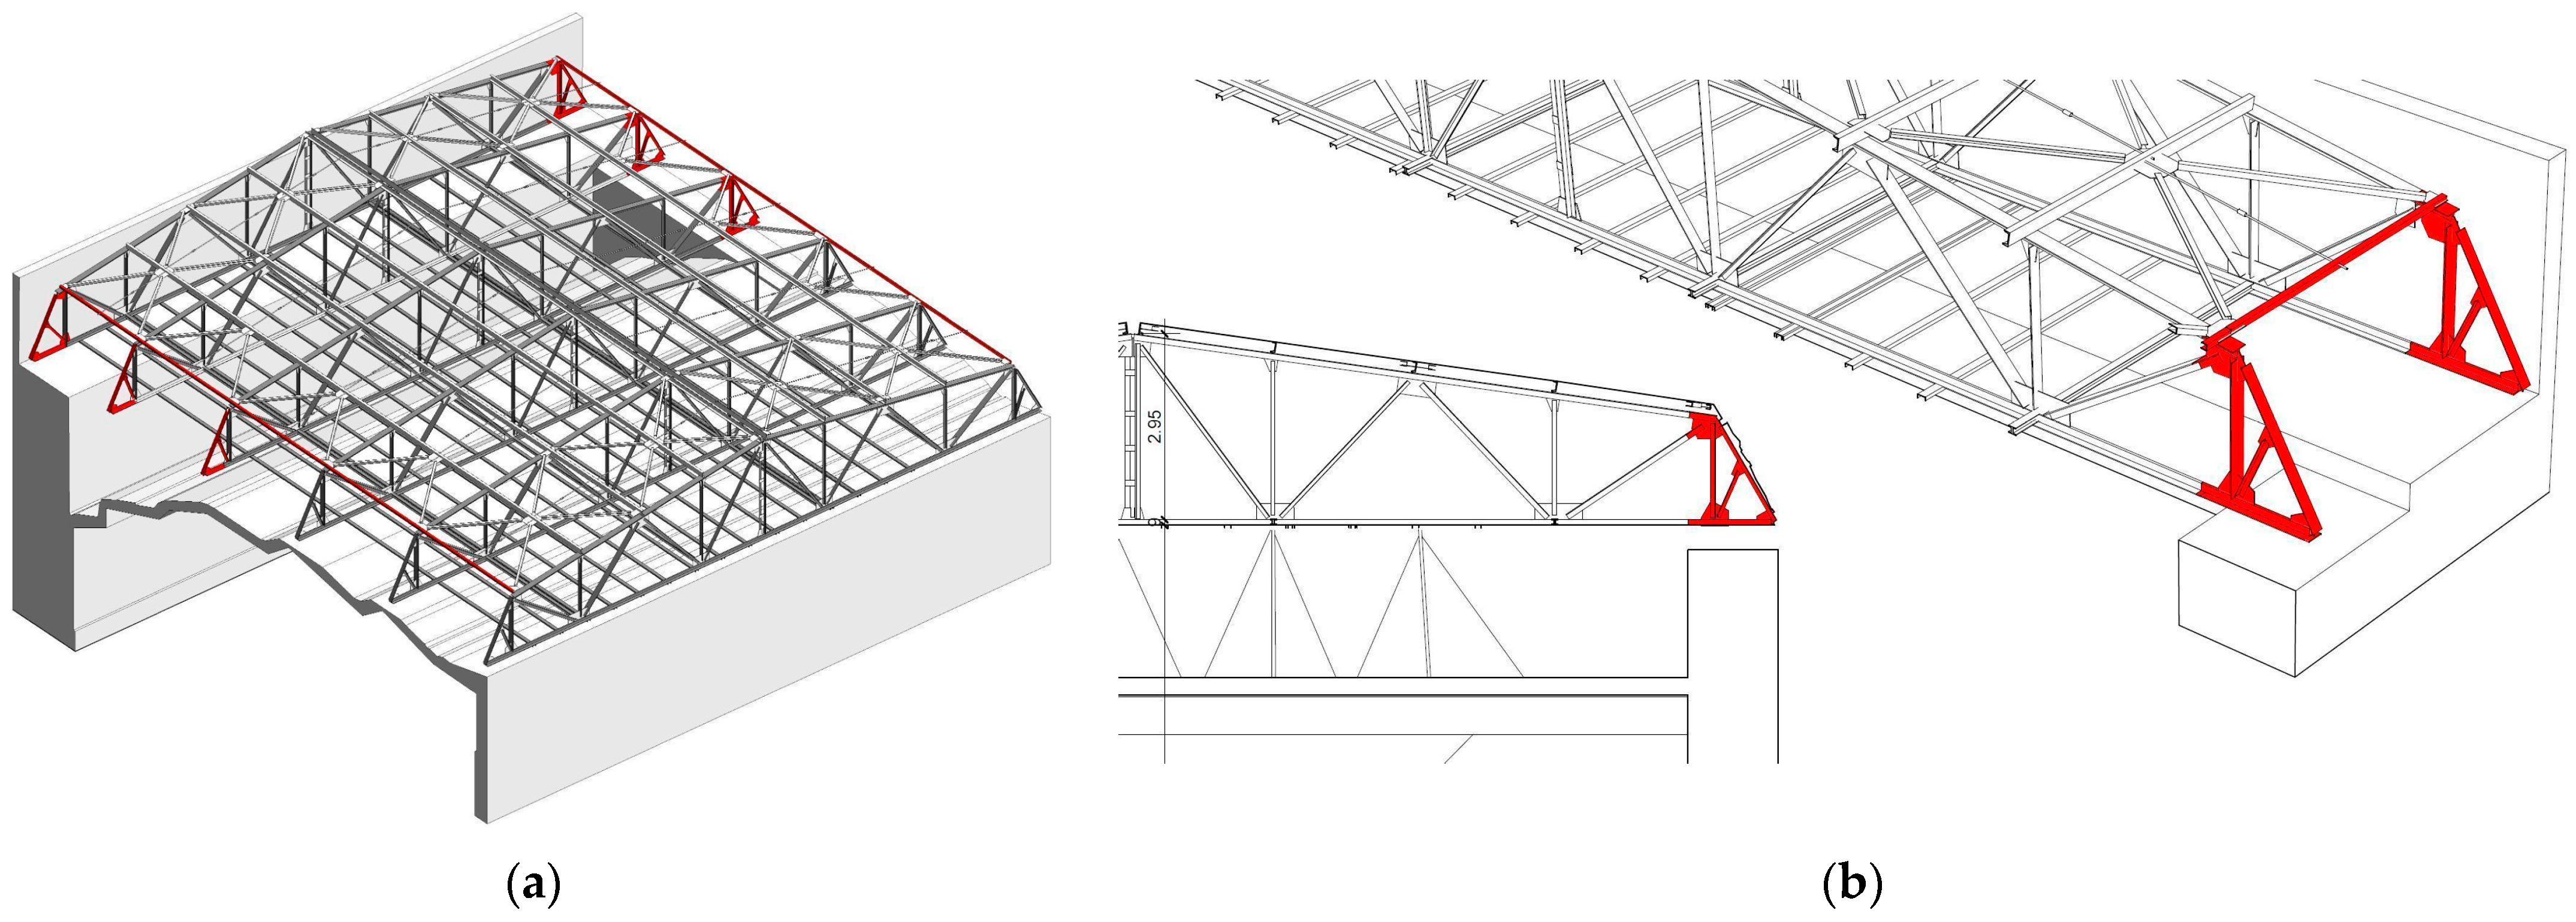
-
Analysis: All structural elements were created using the “Structural Framing” feature, and the connecting elements were created with components categorized as “Structural Connections”. Elements identified based on the point cloud were assigned a material designated as “cloud”, while those created outside the point cloud were labeled “red”. Using these settings enabled the execution of a differentiated area calculation, distinguishing between elements identified from the scan and those created to complete the structure.
-
Collaboration and sharing: In order to share the model with other colleagues, it was exported in the IFC (Industry Foundation Classes) and DWG (Drawing) formats. The 3D model created in Revit served as a basis for verifying the existing structure’s strength according to current standards. For this purpose, the openings and overall dimensions were required, rather than detailing all profiles. The detailing was to be added subsequently.
2.4. Methodology
The methodology used for this research is similar to that used in real practice. At the same time, a multidisciplinary team composed of surveyors, architects, and civil engineers contributed to this project, with each member of the team having a role and tasks adapted to his/her specialization.
Surveyors oversaw carrying out and processing the 3D scan for the architects. The architects were in charge of the 3D modeling, extracting the fireproof coated surface area from the BIM software and providing 2D drawings for the civil engineers. The civil engineers were in charge of the manual surveying of the roof structure, including the identification of steel profiles from standard profile catalogues and the manual calculation of the fireproof coated surface area, using the 2D drawings.
The whole process was divided into 3 main steps: surveying, modeling, and area calculation for quantity surveying. The entire process followed in this study and the data flow are illustrated graphically in Figure 5.
The first step consisted of surveying the existing steel truss structure of the roof, using traditional techniques and tools (measuring tape, caliper, paper, and pen), and also using 3D scanning technology. It was necessary to survey the structure partially manually, using traditional techniques, to complete the data collected by TLS because the configuration of the roof structure did not allow for the positioning of sufficient scanning stations to eliminate the shadowing effect, nor did it allow for the introduction of a UAV equipped with 3D scanning equipment. So, there is a risk that the data collected using only 3D scanning are insufficient to model the composite elements of steel trusses correctly. Thus, the traditionally collected data could also be used to check and correct the initial 3D model which was made exclusively from the point cloud generated by the 3D scan.
The second step consisted of the 3D modeling of the steel trusses, using exclusive data collected from the point cloud collected by TLS. This model was exported in .ifc format to be checked and later completed with data collected through a manual survey. After correcting the initial 3D model, the 2D drawings needed to manually calculate the coverage areas of the elements that required fireproofing were extracted and exported in .dwg format.
In the third step, the coverage areas of the profiles to be fireproofed were calculated. In order to check, analyze and evaluate how the structure survey technique and the area calculation technique influence the results, three areas were generated: one was automatically generated using the 3D model obtained with the help of 3D scanning, one was automatically generated from the 3D model obtained using manual surveying, and one was manually calculated using traditional quantity surveying techniques based on 2D drawings and standard profile catalogues.
The automatic generation of the areas was performed in ArchiCAD 26 by creating a custom Surface Schedule that was configured to automatically generate a list of coverage areas of the steel elements that had to be fireproofed. In this list, the elements were automatically grouped by element type, area subtotals were generated by element type to allow checking and identifying errors, and finally, the total fireproofing area was calculated.
The manual calculation consisted in the first phase of extracting from the 2D drawings the lengths of the elements that had to be fireproofed and calculating the total lengths for each element type. Subsequently, the coverage area (AL) of the profiles used in the project was extracted from the standard profile catalogues, and this area was multiplied by the previously calculated lengths. All of these calculations were performed in Google Sheets to be shared with all team members for verification and evaluation.
After the evaluation of these data, it becomes possible to identify the most efficient method of data acquisition, 3D modeling, and coverage area calculation of steel trusses, while ensuring construction waste reduction.
3. Results
The terrestrial laser scanning process consisted of mounting the Trimble X7 scanner in a total of 33 different scanning positions (stations), which covered the necessary data acquisition for both the roof section and the Aula Magna. Twelve of these stations were used to scan the roof area, yielding 340.341.222 points. The total scanning time from all 33 stations was just under an hour (58 min). This remarkable speed was achieved also due to the fact that this type of equipment does not need scanning targets (specific spherical or other types of targets) for the point cloud registration (assembling the whole 3D model resulting from different stations). The whole registration process is based on identifying common points in scans from different stations, with the maximum error for registration being 1.5 mm. Due to this, the uncertainty regarding the correct position of the scanned points is kept to a near minimum, with the reported average confidence level being around 97.6% and the rest being accounted as noise.
Following the modeling process, it can be observed in Figure 6 that 91.45% of the surface area of the structural framing was identifiable from the point cloud. The remaining 8.55% was deduced from the completely identified trusses.
The 3D model made in Revit was exported in *.ifc format and imported into ArchiCAD to be checked by the team members who carried out the survey using traditional techniques. This model was also used to automatically calculate the areas that needed to be fireproofed.
After checking the 3D model obtained using only the information gathered by the 3D scanner, it was easy to notice that most of the steel elements were identified and modeled incorrectly because they had different sizes and/or sections compared to the real ones. However, an automatic calculation of the covering areas of the entire structure was carried out using the functions of ArchiCAD because we wanted to analyze and compare these values with those obtained using other calculation methods to identify the most efficient method to obtain the correct results, reduce waste, and also perfect a way of integrating the 3D scanning techniques into the design process.
Based on the calculations automatically performed in ArchiCAD on the exported model from Revit, the resulting surface area was found to be identical to that in Revit. The determined surface area requiring intumescent paint coverage was 609.30 square meters in both programs.
The first difference we observed is that most of the elements that were composed of two elements were modeled as a single element. In reality, all the elements of the steel trusses have a cross-section composed of two L-type profiles with equal angles spaced apart. These elements were modeled as a T-section profile. For example, the bottom chords of the trusses are composed of two L-type profiles with equal angles that have a 90 × 90 × 10 mm section and are spaced apart by 12 mm (Figure 7a), but they were modeled as a T-section profile that has 194 × 93 mm (Figure 7c). The real cross-section has an AL coverage area of 0.702 sqm/m, while the 3D modeled cross-section has an AL coverage area of only 0.574 sqm/m. So, in this case, the coverage area of the real profile is 22.3% higher than the profile modeled using 3D scanning. This means that, for the fireproofing of the real profile, a 22.3% larger amount of paint is needed than the one resulting from the model made after 3D scanning data. At the same time, it was observed that there is a difference of 0.052 m2/m (9.49%) between the coverage area of two L-type profiles with equal sides of 90 mm (Figure 7b) and the coverage area of the profile modeled in the 3D scan (Figure 7c).
As for the top chord of the truss, it is composed of two L-type profiles with equal angles and a section of 100 × 100 × 12 mm that is spaced by 12 m (Figure 7d), but it was modeled as a T-type profile of 192 × 101 mm (Figure 7e). Between the two cross-sections, there is a difference in coverage area of 33.11%. The same situation was observed regarding the modeling of the webs (vertical and diagonal elements) of the trusses. These were modeled as a 124 × 59 mm T-type profile (Figure 7g), although, in reality, they are made from two L-type profiles with a 65 × 65 × 7 mm section that are spaced apart (Figure 7f). Between the two cross-sections, there is a difference in the covered area of 33.33%. The cross-sections of these profiles are illustrated in Figure 7, and the dimensions and coverage areas are centralized in Table 2.
After performing this analysis, the 3D model was corrected in ArchiCAD by replacing the profiles that were identified incorrectly using the point cloud with the real profiles identified in the standard steel profile catalogues, using data collected through the traditional survey.
This aspect is clearly visible in Figure 8b,c. Figure 8b illustrates a detail highlighting how the steel profiles were modeled in the first 3D model, which was made using only the information extracted from the 3D scanner data, and Figure 8c shows the same detail extracted from the second 3D model that was modeled using the traditional survey data. It can be seen that the elements composed of two metal profiles were modeled as a single profile.
During the creation of the 3D model, the steel profiles were organized on different layers because we wanted the automatically calculated areas to be detailed by profile type to be able to analyze the results from different points of view, and also to more easily identify possible errors.
Based on the calculations made automatically by the BIM software on this 3D model, the surface that had to be covered with intumescent paint resulted in being 667.02 sqm. The actual area is therefore 57.72 sqm (9.47%) larger than the area automatically calculated by the BIM software using the 3D model made after the 3D scan. To validate these results, manual calculations were carried out. From this 3D model, the 2D drawings were extracted and exported in .dwg format so that the civil engineers could manually extract the lengths and sections of the profiles and then search for their coverage areas in the steel profile catalogues.
Manual calculations were carried out in a few hours and determined that the area that had to be covered with intumescent paint was 669.65 sqm. This area is 60.35 sqm (9.90%) larger than the automatically calculated area using the 3D scan model but only 2.63 sqm (0.39%) larger than the automatically calculated area based on the corrected 3D model. The fact that there is an insignificant difference between the two areas calculated using the corrected 3D model validates the results obtained automatically from the BIM software. The difference between the manually and automatically calculated area occurred due to certain approximations that were made in the manual calculation regarding the length of certain elements that were not represented in true size in the 2D drawings. In order to facilitate the understanding of the results obtained, all data are centralized in Table 3.
After analyzing these results, it can be seen that, by combining the data acquired by TLS with the traditional acquired data, an accurate 3D model can be produced in the BIM software, which facilitated both the automatic generation of accurate coverage areas and the production of the 2D drawings necessary for the accurate manual calculation of the areas.
In this case, the correct area is larger than the area calculated initially, and this means that the budgeted fireproofing cost and fireproofing materials ordered for this process would have been insufficient. In these situations, no material waste is generated because there is no surplus material that turns into waste, but non-physical waste is generated because of cost and time overruns. Cost overruns mean that the actual cost of fireproofing is higher than the approved budget for this work, and that an additional budget needs to be approved to complete the work. Time overruns are caused by the fact that, for public investments, approvals for budget supplements involve a time-consuming bureaucratic process, and fireproofing works should have been stopped until the necessary budget was approved.
4. Discussion
Terrestrial laser scanning (TLS) offers several advantages over traditional surveying methods when it comes to working time. Here are some key points highlighting how TLS can be more time-efficient compared to certain conventional surveying techniques:
- ➢
-
Rapid data acquisition and reduced field time: TLS can quickly capture a large amount of data in a relatively short period. Traditional surveying methods, such as manual measurements or total station surveys, may take significantly longer to cover the same area. This efficiency is particularly advantageous for projects with tight schedules. As was mentioned before, the whole scanning process took place in about 58 min, with this interval permitting the scanning of both the roof section and the Aula Magna Hall, with the timespan being significantly lower than that needed for traditional measurement techniques.
- ➢
-
Simultaneous data capture: TLS can capture data from multiple angles simultaneously, enabling a comprehensive view of the surveyed area in a single scan. This is in contrast to traditional methods, where each point or feature might need to be measured individually, leading to a more time-consuming process. Moreover, the scanner can capture plain 3D point clouds (as seen in Figure 9) but also colored details of the real-world environment, resulting in photorealistic 3D models (as can be observed in Figure 10b).
- ➢
-
Versatility in environments: TLS is highly versatile and well-suited for various environments, including complex or challenging terrains. Traditional survey methods may encounter difficulties in accessing certain areas or require additional time and effort to overcome obstacles. As can be observed in Figure 10b, the narrow beams and the void underneath the measured area would have made for a lengthy and unsafe operation for data acquisition using traditional methods.
- ➢
-
Real-time visualization combined with faster processing of data: TLS systems often provide real-time visualization of the scanned data. Surveyors can immediately assess the quality and coverage of the data, allowing for on-the-fly adjustments and ensuring that critical areas are adequately captured, without the need for rework. While post-processing is required for TLS data, advancements in software and processing algorithms have significantly reduced the time needed to generate usable results. Traditional survey methods may involve longer data processing times, especially for large datasets. The technique used in this application allowed for a rapid assessment of registration precision on the field, eliminating the need to check the precision afterwards and, in case of mismatches, to redo the data acquisition process, thus further enhancing the time and cost efficiency.
Due to the position of the scanning stations, the large cross-section of the profiles, and the 12 mm distance between them, the laser beam could not reach the space between the profiles, and therefore the shadowing effect occurred (Figure 10a), which led to the incorrect identification of the profiles in the first phase. The shadowing effect could have been eliminated by using a much larger number of scanning stations and by positioning some stations in line with the profile gaps, but this was not possible due to the roof structure configuration. At the same time, this strategy would have led to an increase in scanning costs and time, as well as to a significant increase in the point cloud. This would have made the modeling process more difficult, as it would have required more computing resources. Since the roof trusses are identical and there was safe access to one of these trusses, it was observed that, by manual surveying, the profiles could be correctly identified and that, therefore, the negative effects produced by shadowing could be compensated more efficiently with less resource consumption.
As there is access to only one of the roof trusses, surveying the other elements could not have been performed safely, as there is an increased risk of falling from a great height through the suspended plasterboard ceiling of the auditorium. By using TLS, it was possible to measure inaccessible areas safely. On the other hand, a small part of the roof structure could not be scanned using TLS because it was partially masked on the sides by walls delimiting some spaces that were too small for us to use the 3D scanning equipment on. The elements that could not be 3D scanned are highlighted in red in Figure 9. Following measurements using traditional techniques, it was found that those elements had the same dimensions and configuration as the elements that were 3D scanned and therefore could be easily modeled in the BIM software.
The existence of a 3D scan in the process of 3D modeling, particularly when using Autodesk Revit, has a significant impact on various aspects of the project. Below are some key areas where the impact is most notable:
Enhanced accuracy and detail: The 3D scanning process captures detailed and accurate measurements of the physical space or structure. When these data are imported into Revit, they provide a precise foundation for the modeling process, reducing the likelihood of errors that might occur when measurements are taken manually or estimated.
Time efficiency: Using 3D scans as a starting point in Revit accelerates the modeling process. It eliminates the initial phase of creating the basic structure from scratch, allowing designers to focus on refining and adding details to the already established base model [44].
Identification of complex elements: The scanned data help in identifying complex structural elements, especially in intricate areas like roof framing. This level of detail aids in creating more accurate and functional 3D models, as seen with the identification and 2D rendering of specific profiles and the delineation of unclear areas.
Challenges in data interpretation: While 3D scans provide detailed information, interpreting these data accurately in Revit can be challenging. As noted, ambiguities in the scan, such as blurred regions, can lead to misinterpretations in the model, such as confusing ventilation ducts with other structural elements. In 3D modeling, a notable challenge encountered was the differentiation of the profiles; specifically, two L-shaped profiles next to each other looked like T-shaped ones in many portions of the scan for reasons that are easy to understand. In the sections created through the 3D cloud for profiles, they appeared as in the image from Figure 10a. This ambiguity in profile classification precluded the effective use of beam tools in the modeling process. This ambiguity led to errors regarding areas generated solely based on the 3D model derived from the scanning. During the modeling process, it was noted the existence of L-shaped profiles, which were modeled in a later phase, and areas were corrected.
Data limitations: In order to obtain optimal data, the profiles had to be measured and verified manually, in situ. Photographic information is very useful for identifying different materials, but it should also be focused on the details if physical presence in situ of the modeler is not possible. Figure 10b exemplifies photographic information from which no details of the structure can be extracted; thus, profiles generated from the 3D scan, as in Figure 10a, remain unresolved.
Collaboration enhancement: The ability to export the model in IFC and DWG formats from Revit enhances collaboration. These formats are widely accepted and enable different stakeholders, even those using different software, to access, review, and collaborate on the project. The original 3D model made in Revit could be imported into ArchiCAD, using the .ifc format, without any problems. Thus, the 3D model could be easily corrected in a few hours in another program, by another person, because a large part of the 3D model could be kept, and only the elements that were initially wrongly identified were replaced.
Quantitative analysis and reporting: The precision of 3D scans can streamline quantitative analyses, such as quantity takeoffs. However, ambiguities in the scan can lead to errors in these reports, emphasizing the need for careful review and interpretation of the scanned data.
Automatic, fast, and accurate area calculation: Because BIM software has certain functions that automatically calculate the areas of different elements, it helped us to obtain the total areas in a few minutes after the completion of the modeling process. This aspect demonstrates that the use of BIM contributes significantly to easing the process of obtaining steel truss cover areas, as well as to obtaining more accurate bills of quantities. The fact that there is an insignificant difference of only 2.63 sqm (0.39%) between the area calculated automatically in the BIM software (667.02 sqm) and the area calculated manually (669.65 sqm) demonstrates that, by using BIM software, it is possible to obtain very accurate truss coverage areas automatically.
Miscalculation of the coverage areas of steel fireproofing trusses can produce waste in the following ways:
- ➢
-
When the calculated coverage area is larger than the actual coverage area, physical waste will result because excess material will be ordered and finally disposed of in the landfill.
- ➢
-
When the calculated coverage area is less than the actual coverage area, as could have happened in the case of the study presented in this paper, non-physical waste will result because not enough material is ordered, and therefore the budget allocated for fireproofing would not be sufficient. For public investments, the approval of the additional budget needed to complete the fireproofing works would have taken a long time and would have led to delays in the fireproofing works and ultimately to cost and time overruns.
- ➢
-
The steel truss elements described in this paper require a single coat of intumescent paint because the maximum coating thickness is 0.47 mm. It should be mentioned that, under certain conditions, depending on the cross-section of the profiles, fire resistance, and design temperature, the coating thickness may exceed 6 mm, and this involves applying the coating in multiple layers. Thus, the multiplication of coating layers leads to a multiplication of the waste produced.
The initial 3D model made only after the 3D scan was incorrect mainly because the information extracted from the point cloud was not sufficient to understand the composite profile configuration of the steel trusses because of the shadowing effect. In order to eliminate the risk of major errors it is necessary that the surveying of trusses or other complex steel structures be carried out using multiple surveying techniques and that the modeling process be informed by additional data (hand sketches, photographs, and video). For this purpose, the survey, 3D modeling, and calculation of the cover areas of steel trusses or steel structures that are made of composite profiles should be carried out according to the methodology shown in Figure 11. This methodology involves all the data collected from the site, whether collected using 3D scanning or traditional techniques, in order to inform the process of producing a single 3D model.
5. Conclusions
The Aula Magna Hall at the University of Oradea, a key feature of the “SMART Campus—University of Oradea” project, showcases the university’s dedication to preserving heritage while embracing modernization and technological advancement.
The present project offers several pertinent conclusions and recommendations regarding the interpretation of point cloud scanning and its modeling using BIM software, such as Revit or ArchiCAD, in a harsh and highly complex environment. The main challenge that was identified for the automatic 3D modeling was the shadowing effect, which was caused by the fact that the laser wave cannot reach the narrow space between the profiles, and this can lead to the misinterpretation of the different sections of elements that have a cross-section composed of several profiles. The proposed solution recommends using multiple scanning stations and a combination of data acquisition methods, including traditional techniques and photography, overcoming the limitations of TLS scanning and generating precise and comprehensive 3D models for a better assessment of the construction site. Understanding the configuration of the steel truss is important, requiring site visits or visual materials for modelers in the absence of direct access. Calculation errors in composite trusses can lead to an underestimation of the materials needed for fireproofing, especially when multiple layers of intumescent paint are required. Thus, BIM programs become essential for efficient data collection and error prevention that could lead to waste.
While most of the research conducted with the aim of proving that the 3D scanning and BIM software’s have the ability to reduce the physical waste [45,46,47,48], the innovative point in this research unveiled that, by using a mixture of survey techniques, including traditional survey and 3D scanning systems, we are able to avoid a more undesirable type of waste—the non-physical waste, which will led to a time-consuming bureaucratic process to obtain the needed additional budget for the fireproofing process, generating cost and time overruns.
While other research studies are related to different types of trusses, such as wood [49], this research innovates the way that the 3D point cloud and 3D modeling of steel trusses should be forged in order to automatically generate accurate coverage areas and to reduce the influence of blunders with the purpose of avoiding physical and/or non-physical waste. Hence, this method represents a significant advancement in optimizing 3D modeling in the architecture, engineering, and construction (AEC) sector.
Even though the initial automated modeling was generated inaccurately, this model created the necessary premises for verification of complex structural elements to be correctly identified. Thus, it resulted in the development of an innovative and accurate methodology so that a multidisciplinary team composed of surveyors, architects, and civil engineers are able the enhance their collaboration to generate an accurate and sustainable 3D model that is usable for multiple and highly complex analyses.
The research in this paper demonstrates that the use of 3D scanning and BIM contributes significantly to the reduction of non-physical waste that can result in the fireproofing process of steel trusses and helps yield a more precise budget, while taking into account the necessary recommendations presented in the article.
Author Contributions
Conceptualization, C.S., A.-H.P., N.-S.S. and S.N.; methodology, C.S., A.-H.P., I.-G.Z., A.-M.D., N.-S.S. and S.N.; software, A.-H.P., I.-G.Z., A.-P.F., A.S.B. and S.N.; validation, C.S., A.-P.F. and A.S.B.; formal analysis, C.S., A.-H.P., I.-G.Z., A.-M.D. and S.N.; investigation, C.S., A.-H.P., I.-G.Z., A.-M.D., A.-P.F., N.-S.S., A.S.B. and S.N.; resources, A.S.B.; data curation, N.-S.S.; writing—original draft preparation, C.S., A.-H.P., I.-G.Z., A.-M.D., A.-P.F., N.-S.S., A.S.B. and S.N.; writing—review and editing, C.S., N.-S.S., I.-G.Z. and S.N.; visualization, A.-P.F.; supervision, C.S., A.-H.P. and N.-S.S.; project administration, A.-H.P., I.-G.Z., A.-M.D. and A.-P.F.; funding acquisition, A.S.B. and S.N. All authors have read and agreed to the published version of the manuscript.
Funding
This research was funded by the University of Oradea.
Institutional Review Board Statement
Not applicable.
Informed Consent Statement
Not applicable.
Data Availability Statement
The data presented in this study are available on request from the corresponding author. The data are not publicly available due to privacy restriction.
Acknowledgments
We gratefully acknowledge the anonymous reviewers and the editor for their thoughtful comments and suggestions, which contributed significantly to improving the quality of the manuscript. Also, we want to thank the local Trimble distributor, Liviu Gherman, and Sergiu Ceausu for all their support.
Conflicts of Interest
The authors declare no conflict of interest.
References
- McKinsey Company. The Construction Productivity Imperative. Available online: https://www.mckinsey.com/capabilities/operations/our-insights/the-construction-productivity-imperative (accessed on 11 January 2024).
- Coates, S. BIM Implementation Strategy Framework for Small Architectural Practices. 2020. Available online: https://salford-repository.worktribe.com/output/1429393 (accessed on 11 January 2024).
- Aziz, R.F.; Hafez, S.M. Applying lean thinking in construction and performance improvement. Alex. Eng. J. 2013, 52, 679–695. [Google Scholar] [CrossRef]
- Nagapan, S.; Rahman, I.A.; Asmi, A. Factors contributing to physical and non-physical waste generation in construction industry. Int. J. Adv. Appl. Sci. 2012, 1, 1–10. [Google Scholar] [CrossRef]
- Nguyen, T.A.; Nguyen, P.T.; Do, S.T. Application of BIM and 3D Laser Scanning for Quantity Management in Construction Projects. Adv. Civ. Eng. 2020, 2020, 8839923. [Google Scholar] [CrossRef]
- Lucherini, A.; Maluk, C. Intumescent coatings used for the fire-safe design of steel structures: A review. J. Constr. Steel Res. 2019, 162, 105712. [Google Scholar] [CrossRef]
- Wang, K.; Le, H. The Development of Cement-Based, Intumescent and Geopolymer Fire-Retardation Coatings for Metal Structures: A Review. Coatings 2023, 13, 495. [Google Scholar] [CrossRef]
- Inerhunwa, I.; Wang, Y.C.; Su, M. Reliability analysis of intumescent coating protected steel members under the standard fire condition. Fire Saf. J. 2019, 104, 43–56. [Google Scholar] [CrossRef]
- Waste Statistics. Available online: https://ec.europa.eu/eurostat/statistics-explained/index.php?title=Waste_statistics#Total_waste_generation (accessed on 11 July 2023).
- SmartWaste. Available online: https://www.bresmartsite.com/sustainable-construction-methods-2/ (accessed on 14 July 2023).
- Plebankiewicz, E.; Wieczorek, D. Prediction of Cost Overrun Risk in Construction Projects. Sustainability 2020, 12, 9341. [Google Scholar] [CrossRef]
- Keung, C.C.; Yiu, T.W.; Feng, Z. Building Information Modelling in quantity surveying practices: Current state and future challenges in Hong Kong. J. Inf. Technol. Constr. 2022, 27, 1060–1074. [Google Scholar] [CrossRef]
- Harmening, C.; Neuner, H. A spatio-temporal deformation model for laser scanning point clouds. J. Geod. 2020, 94, 26. [Google Scholar] [CrossRef]
- Skrzypczak, I.; Oleniacz, G.; Leśniak, A.; Zima, K.; Mrówczyńska, M.; Kazak, J.K. Scan-to-BIM method in construction: Assessment of the 3D buildings model accuracy in terms inventory measurements. Build. Res. Inf. 2022, 50, 859–880. [Google Scholar] [CrossRef]
- Trembecka, A.; Droj, G.; Kwartnik-Pruc, A. Management of Municipal Housing Resources By Local Authorities in the Municipalities of Krakow (Poland) and Oradea (Romania)—A Comparative Study. Real Estate Manag. Valuat. 2023, 31, 23–35. [Google Scholar] [CrossRef]
- Droj, G.; Droj, L.; Badea, A.-C.; Dragomir, P.I. GIS-Based Urban Traffic Assessment in a Historical European City under the Influence of Infrastructure Works and COVID-19. Appl. Sci. 2023, 13, 1355. [Google Scholar] [CrossRef]
- Kalyan, T.S.; Zadeh, P.A.; Staub-French, S.; Froese, T.M. Construction Quality Assessment Using 3D as-built Models Generated with Project Tango. Procedia Eng. 2016, 145, 1416–1423. [Google Scholar] [CrossRef]
- Apollo, M.; Jakubiak, M.; Nistor, S.; Lewińska, P.; Krawczyk, A.; Borowski, L.; Specht, M.; Krzykowska-Piotrowska, K.; Marchel, Ł.; Pęska-Siwik, A.; et al. Geodata in science—A review of selected scientific fields. Acta Sci. Polonorum. Form. Circumiectus 2023, 22, 17–40. [Google Scholar] [CrossRef]
- Lin, Y.-C.; Chen, Y.-P.; Huang, W.-T.; Hong, C.-C. Development of BIM Execution Plan for BIM Model Management during the Pre-Operation Phase: A Case Study. Buildings 2016, 6, 8. [Google Scholar] [CrossRef]
- Billi, D.; Croce, V.; Bevilacqua, M.G.; Caroti, G.; Pasqualetti, A.; Piemonte, A.; Russo, M. Machine Learning and Deep Learning for the Built Heritage Analysis: Laser Scanning and UAV-Based Surveying Applications on a Complex Spatial Grid Structure. Remote Sens. 2023, 15, 1961. [Google Scholar] [CrossRef]
- Russo, M.; Russo, V. Geometric analysis of a space grid structure by an integrated 3D survey approach. Int. Arch. Photogramm. Remote Sens. Spat. Inf. Sci. 2022, 46, 465–472. [Google Scholar] [CrossRef]
- Almukhtar, A.; Saeed, Z.O.; Abanda, H.; Tah, J.H.M. Reality Capture of Buildings Using 3D Laser Scanners. CivilEng 2021, 2, 214–235. [Google Scholar] [CrossRef]
- Ham, Y.; Golparvar-Fard, M. Mapping actual thermal properties to building elements in gbXML-based BIM for reliable building energy performance modeling. Autom. Constr. 2015, 49, 214–224. [Google Scholar] [CrossRef]
- Sanhudo, L.; Ramos, N.M.M.; Martins, J.P.; Almeida, R.M.S.F.; Barreira, E.; Simões, M.L.; Cardoso, V. A framework for in-situ geometric data acquisition using laser scanning for BIM modelling. J. Build. Eng. 2020, 28, 101073. [Google Scholar] [CrossRef]
- Bieda, A.; Balawejder, M.; Warchoł, A.; Bydłosz, J.; Kolodiy, P.; Pukanska, K. Use of 3D technology in underground tourism: Example of Rzeszow (Poland) and Lviv (Ukraine). Acta Montan. Slovaca 2021, 26, 205–221. [Google Scholar]
- Sacks, R.; Eastman, C.; Lee, G.; Teicholz, P.; BIM Handbook. A Guide to Building Information Modeling for Owners, Designers, Engineers, Contractors, and Facility Managers, 3rd ed.; John Wiley & Sons, Inc.: Hoboken, NJ, USA, 2018; p. 688. [Google Scholar]
- Bieda, A.; Bydłosz, J.; Parzych, P.; Pukanská, K.; Wójciak, E. 3D technologies as the future of spatial planning: The example of Krakow. Geomat. Environ. Eng. 2020, 14, 15–33. [Google Scholar] [CrossRef]
- Hamma-adama, M.; Kouider, T. Comparative Analysis of BIM Adoption Efforts by Developed Countries as Precedent for New Adopter Countries. Curr. J. Appl. Sci. Technol. 2019, 36, 1–15. [Google Scholar] [CrossRef]
- Zhan, Z.; Tang, Y.; Wang, C.; Yap, J.B.H.; Lim, Y.S. System Dynamics Outlook on BIM and LEAN Interaction in Construction Quantity Surveying. Iran. J. Sci. Technol. Trans. Civ. Eng. 2022, 46, 3947–3962. [Google Scholar] [CrossRef]
- Olsen, D.; Taylor, J.M. Quantity Take-Off Using Building Information Modeling (BIM), and Its Limiting Factors. Procedia Eng. 2017, 196, 1098–1105. [Google Scholar] [CrossRef]
- Uusitalo, P.; Seppänen, O.; Lappalainen, E.; Peltokorpi, A.; Olivieri, H. Applying Level of Detail in a BIM-Based Project: An Overall Process for Lean Design Management. Buildings 2019, 9, 109. [Google Scholar] [CrossRef]
- Marzouk, M.; Thabet, R. A BIM-Based Tool for Assessing Sustainability in Buildings Using the Green Pyramid Rating System. Buildings 2023, 13, 1274. [Google Scholar] [CrossRef]
- Franco, J.; Mahdi, F.; Abaza, H. Using building information modeling (BIM) for estimating and scheduling, adoption barriers. Univers. J. Manag. 2015, 3, 376–384. [Google Scholar] [CrossRef]
- Doumbouya, L.; Gao, G.; Guan, C. Adoption of the Building Information Modeling (BIM) for construction project effectiveness: The review of BIM benefits. Am. J. Civ. Eng. Archit. 2016, 4, 74–79. [Google Scholar]
- Khosakitchalert, C.; Yabuki, N.; Fukuda, T. Improving the accuracy of BIM-based quantity takeoff for compound elements. Autom. Constr. 2019, 106, 102891. [Google Scholar] [CrossRef]
- Paşca, M. Oradea 1900: Un Ghid de Arhitectură; Argonaut: Cluj-Napoca, Romania, 2019. [Google Scholar]
- Buda, A.S.; Frenț, A.-P.; Nistor, S.; Suba, N.-S. Possibilities of Registering Natural Underground Cavities into the National Integrated Information System of Cadastre and Land Registry. J. Appl. Eng. Sci. 2023, 13, 53–56. [Google Scholar] [CrossRef]
- Herman, G.V.; Caciora, T.; Ilies, D.C.; Ilies, A.; Deac, A.; Sturza, A.; Sonko, S.M.; Suba, N.S.; Nistor, S. 3D Modeling of the Cultural Heritage: Between Opportunity and Necessity. J. Appl. Eng. Sci. 2020, 10, 27–30. [Google Scholar] [CrossRef]
- Mukupa, W.; Roberts, G.W.; Hancock, C.M.; Al-Manasir, K. A review of the use of terrestrial laser scanning application for change detection and deformation monitoring of structures. Surv. Rev. 2017, 49, 99–116. [Google Scholar] [CrossRef]
- Gordon, S.J.; Lichti, D.D. Modeling Terrestrial Laser Scanner Data for Precise Structural Deformation Measurement. J. Surv. Eng. 2007, 133, 72–80. [Google Scholar] [CrossRef]
- Trimble X7. Available online: https://geospatial.trimble.com/en/products/hardware/trimble-x7 (accessed on 4 September 2023).
- IEC 60825-1:2014; Safety of Laser Products—Part 1: Equipment Classification and Requirements. International Electrotechnical Commission: Geneva, Switzerland, 2014.
- Danial, C.E.; Mahmoud, A.H.A.; Tawfik, M.Y. Methodology for retrofitting energy in existing office buildings using building information modelling programs. Ain Shams Eng. J. 2023, 14, 102175. [Google Scholar] [CrossRef]
- Syed, E.U.; Manzoor, K.M. Analysis and design of buildings using Revit and ETABS software. Mater. Today Proc. 2022, 65, 1478–1485. [Google Scholar] [CrossRef]
- Guerra, B.C.; Leite, F.; Faust, K.M. 4D-BIM to enhance construction waste reuse and recycle planning: Case studies on concrete and drywall waste streams. Waste Manag. 2020, 116, 79–90. [Google Scholar] [CrossRef]
- Won, J.; Cheng, J.C.P. Identifying potential opportunities of building information modeling for construction and demolition waste management and minimization. Autom. Constr. 2017, 79, 3–18. [Google Scholar] [CrossRef]
- Hu, X.; Zhou, Y.; Vanhullebusch, S.; Mestdagh, R.; Cui, Z.; Li, J. Smart building demolition and waste management frame with image-to-BIM. J. Build. Eng. 2022, 49, 104058. [Google Scholar] [CrossRef]
- Han, D.; Kalantari, M.; Rajabifard, A. Building Information Modeling (BIM) for Construction and Demolition Waste Management in Australia: A Research Agenda. Sustainability 2021, 13, 12983. [Google Scholar] [CrossRef]
- Massafra, A.; Prati, D.; Predari, G.; Gulli, R. Wooden Truss Analysis, Preservation Strategies, and Digital Documentation through Parametric 3D Modeling and HBIM Workflow. Sustainability 2020, 12, 4975. [Google Scholar] [CrossRef]
Figure 1.
(a) Building F—inner courtyard façade. (b) Building F—University Street façade.
Figure 1.
(a) Building F—inner courtyard façade. (b) Building F—University Street façade.
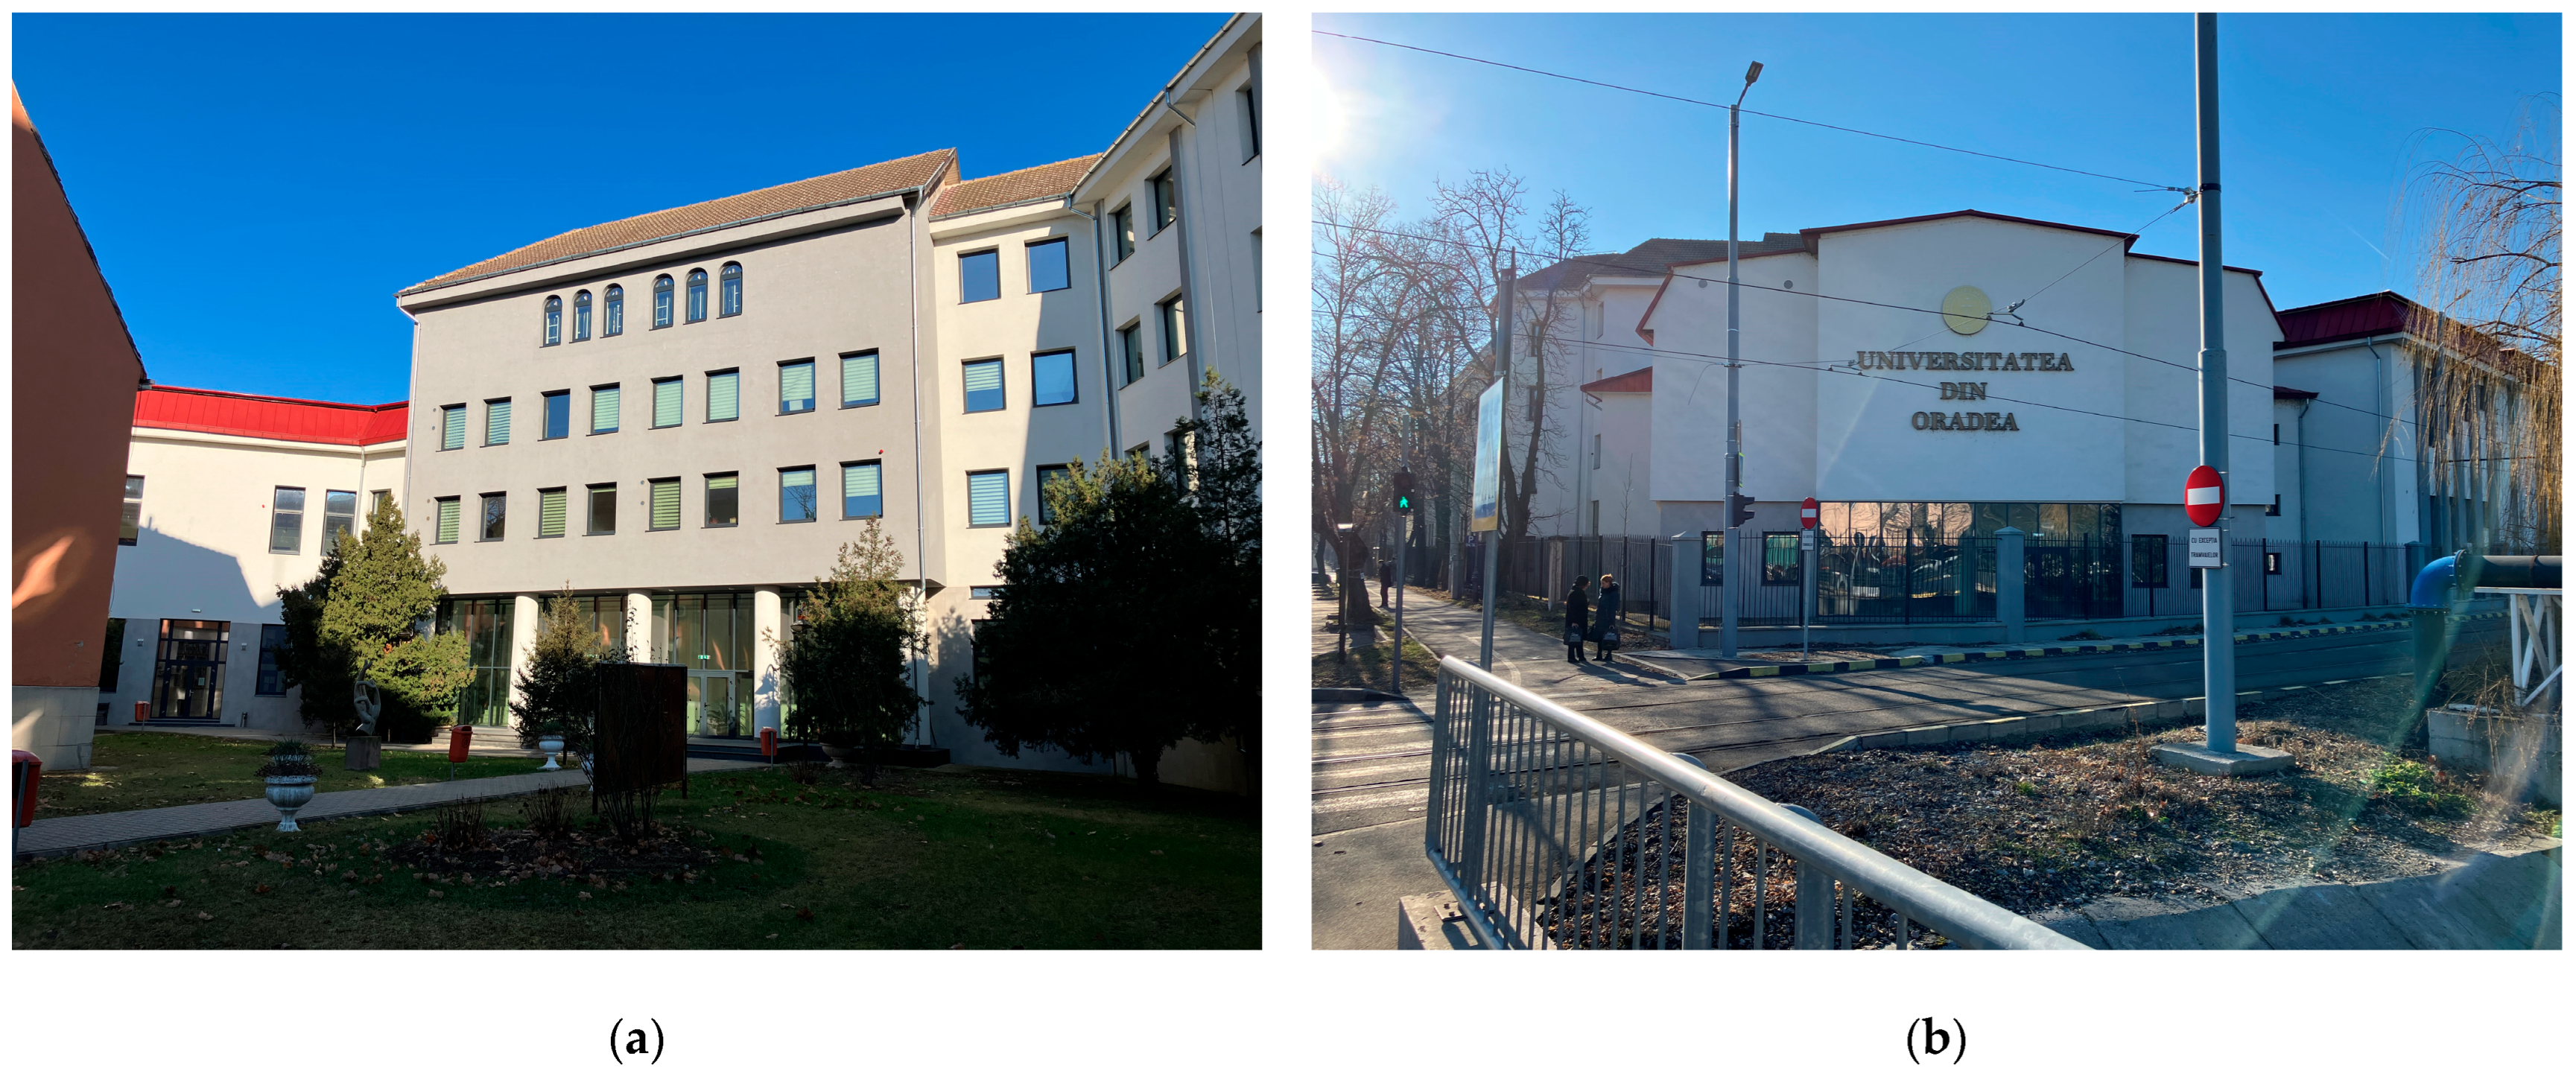
Figure 5.
Graphic illustration of the process followed to determine the areas needed to calculate the lists of quantities.
Figure 5.
Graphic illustration of the process followed to determine the areas needed to calculate the lists of quantities.
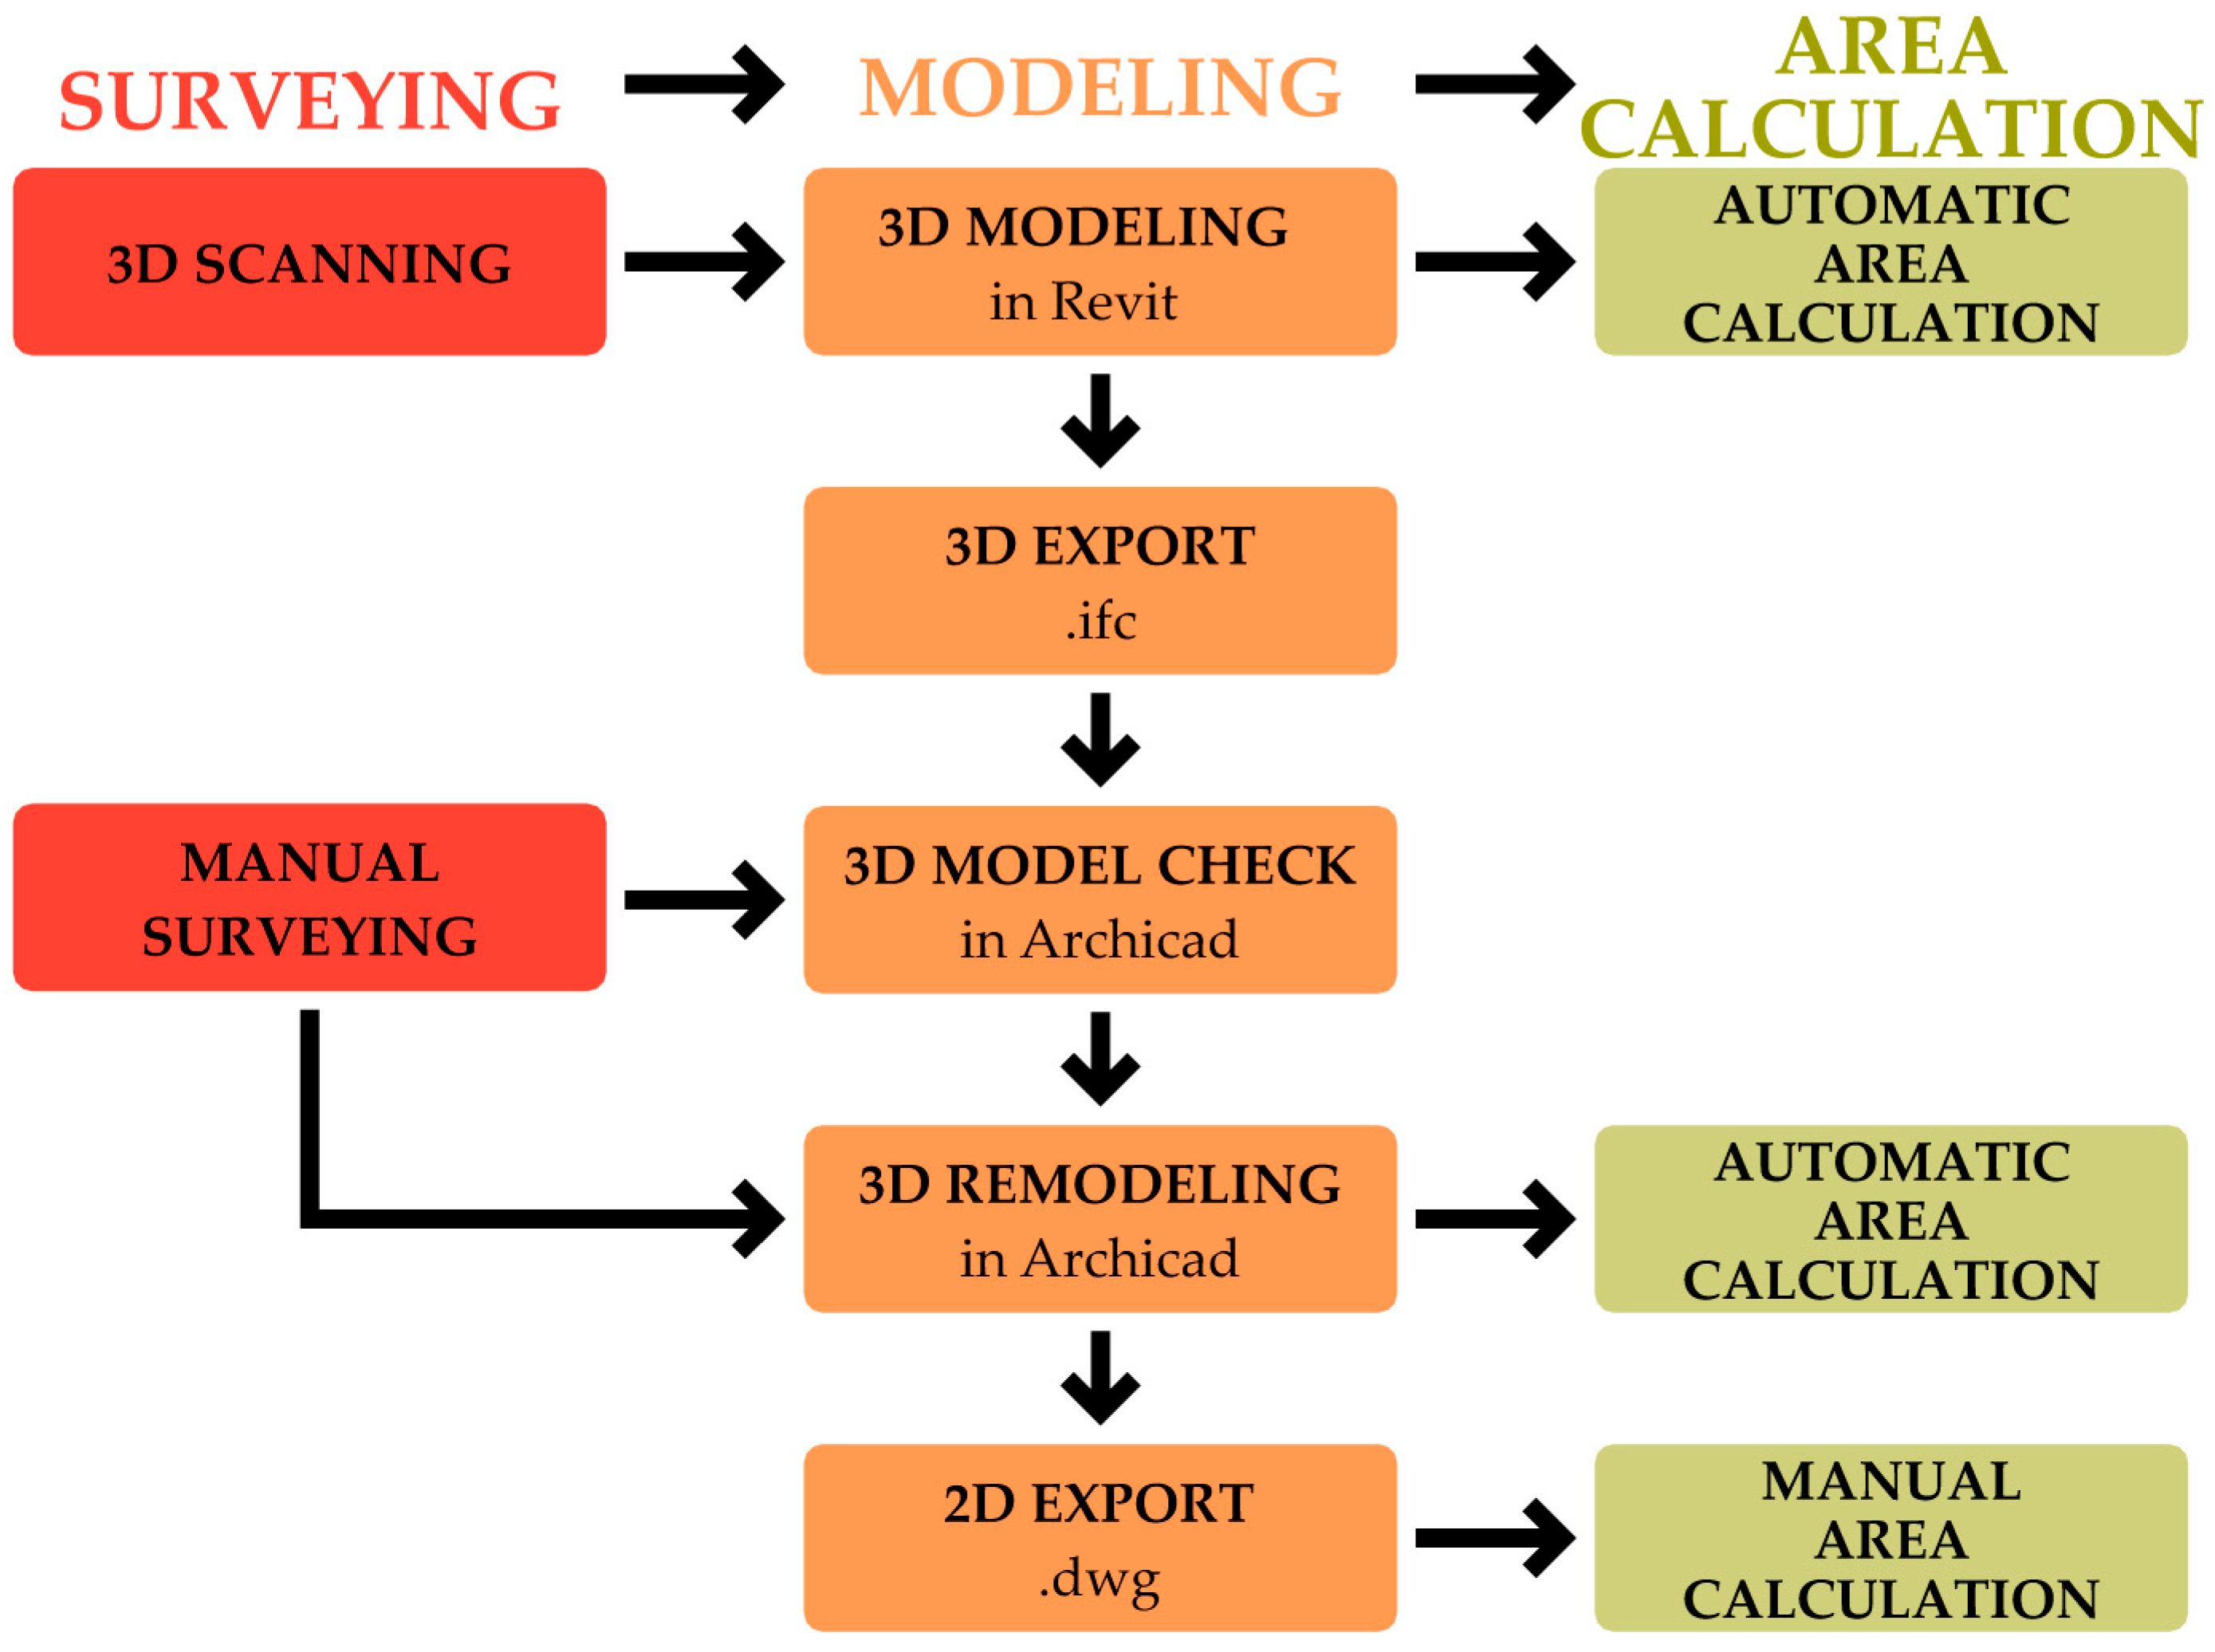
Figure 6.
Chart illustrating the modeled surfaces based on the point cloud (blue) and those completed for areas missing from the 3D scan (red).
Figure 6.
Chart illustrating the modeled surfaces based on the point cloud (blue) and those completed for areas missing from the 3D scan (red).
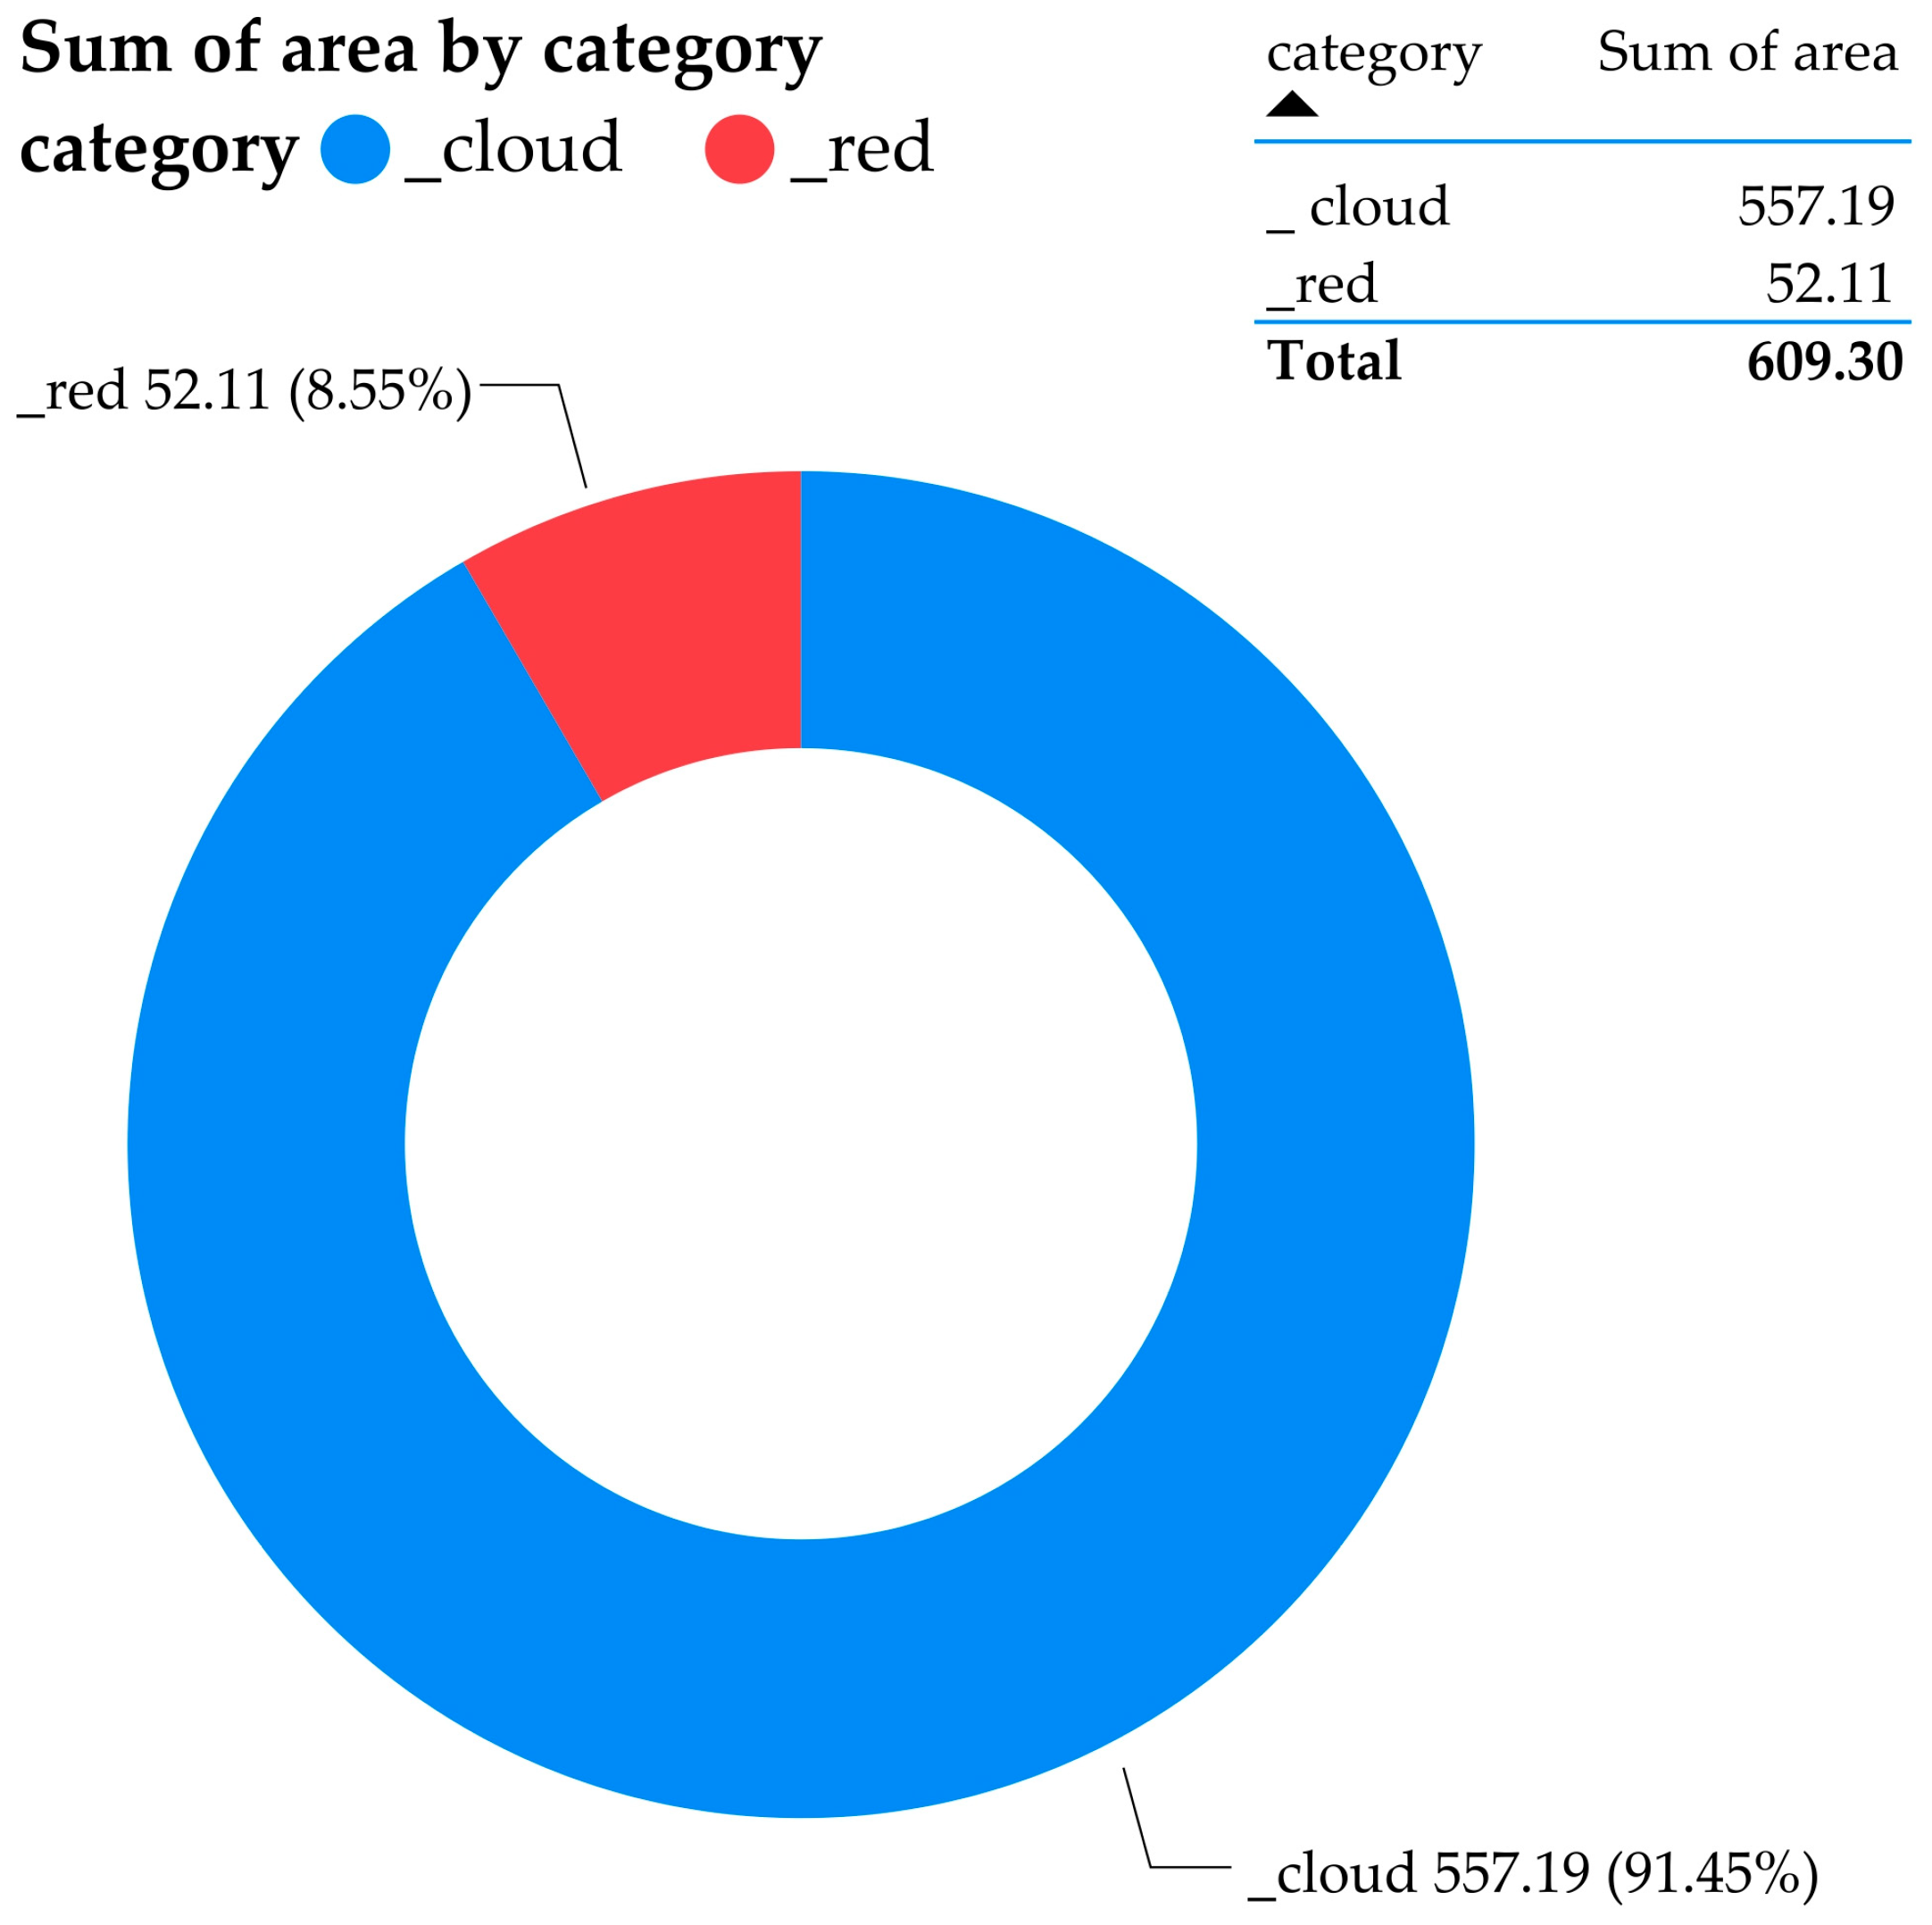
Figure 7.
In reality, all the profiles are spaced apart (a,d,f), but in the 3D model built after the 3D scan, the profiles were connected (c,e,g). (a) The actual section of the bottom chord of the truss composed of two spaced L-type profiles with equal angles (L90 × 90 × 10). The actual section has a coverage area of 0.702 m2/m. (b) Two connected L-type profiles. (c) The section of the bottom chord modeled after the 3D scan. (d) The actual section of the top chord (L100 × 100 × 12). (e) The section of the top chord modeled after the 3D scan. (f) The actual section of the webs (L65 × 65 × 7). (g) The section of the webs modeled after the 3D scan.
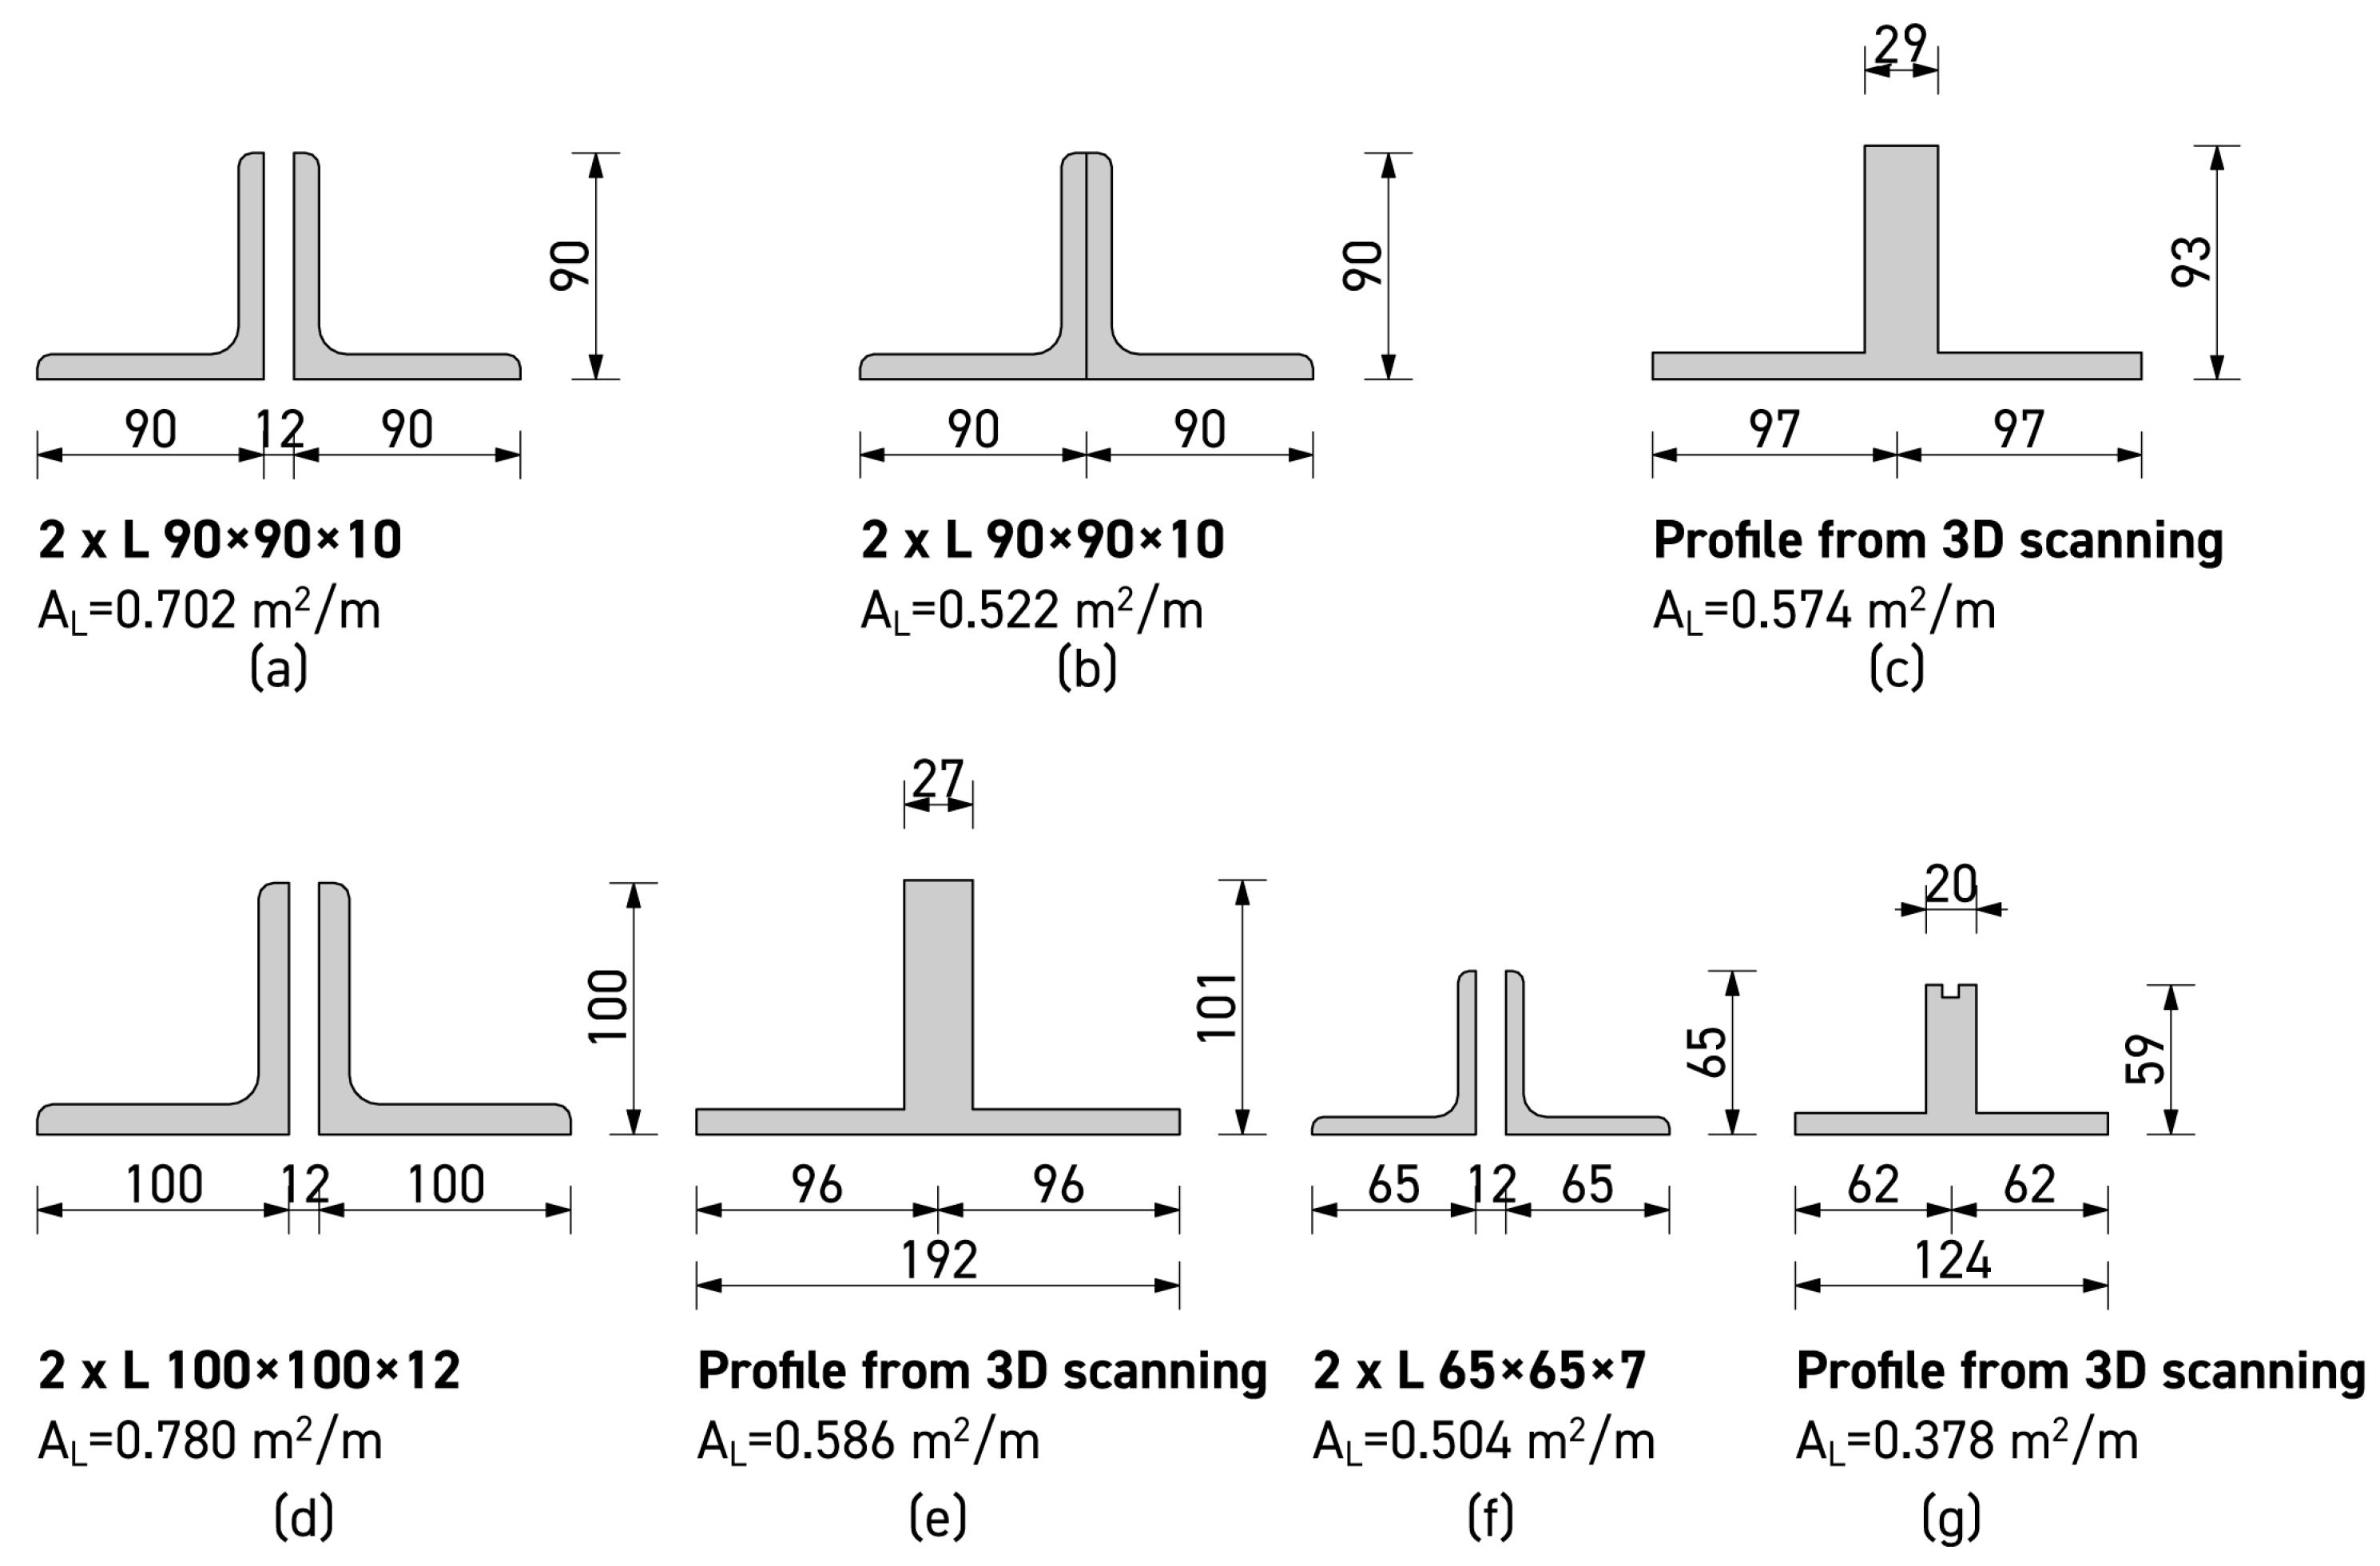
Figure 8.
(a) Axonometric drawing of the second 3D model made in ArchiCAD 26 software. (b) Axonometric drawing with a detail of the metal profile joints extracted from the 3D model made using only 3D scan data. (c) Axonometric drawing with a detail of the metal profile joints extracted from the 3D model made using 3D scan and traditional survey data. It can be seen that the elements composed of two metal profiles were modeled as a single profile.
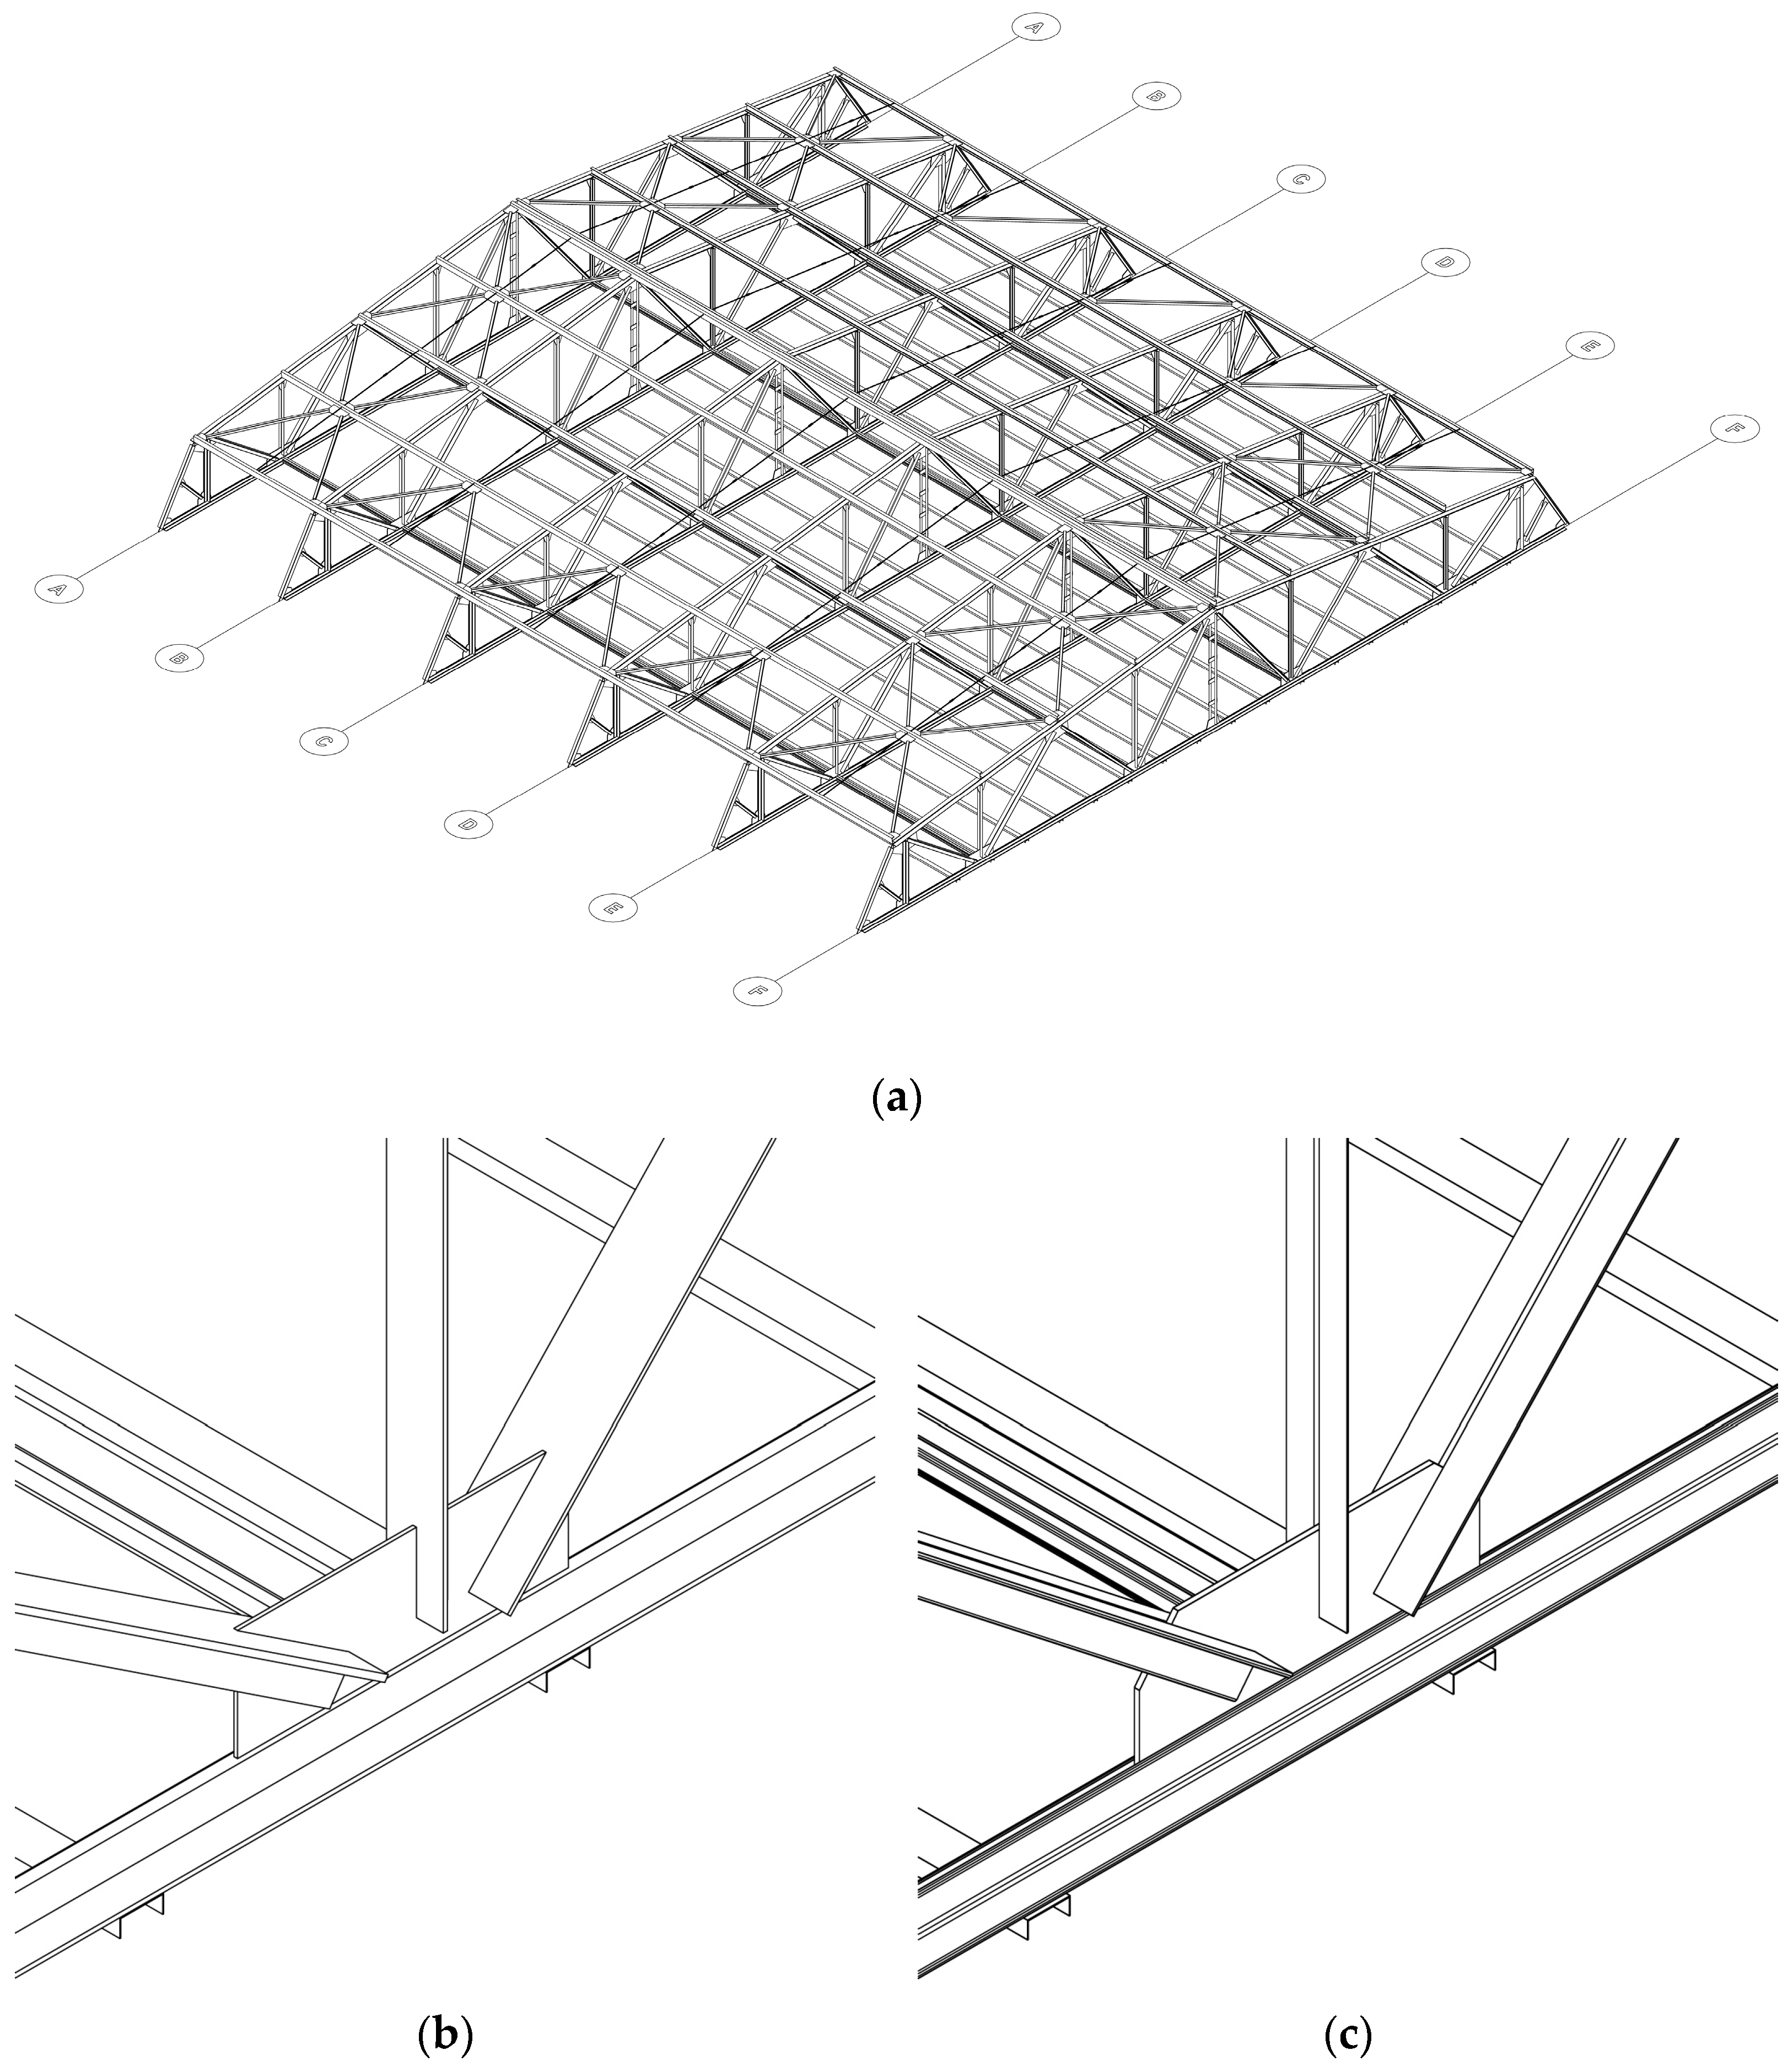
Figure 9.
The black points represent the point cloud from the 3D scan. With blue are represented the steel truss elements that could be modeled from the point cloud, while with red are highlighted the elements that were modelled by deduction.
Figure 9.
The black points represent the point cloud from the 3D scan. With blue are represented the steel truss elements that could be modeled from the point cloud, while with red are highlighted the elements that were modelled by deduction.
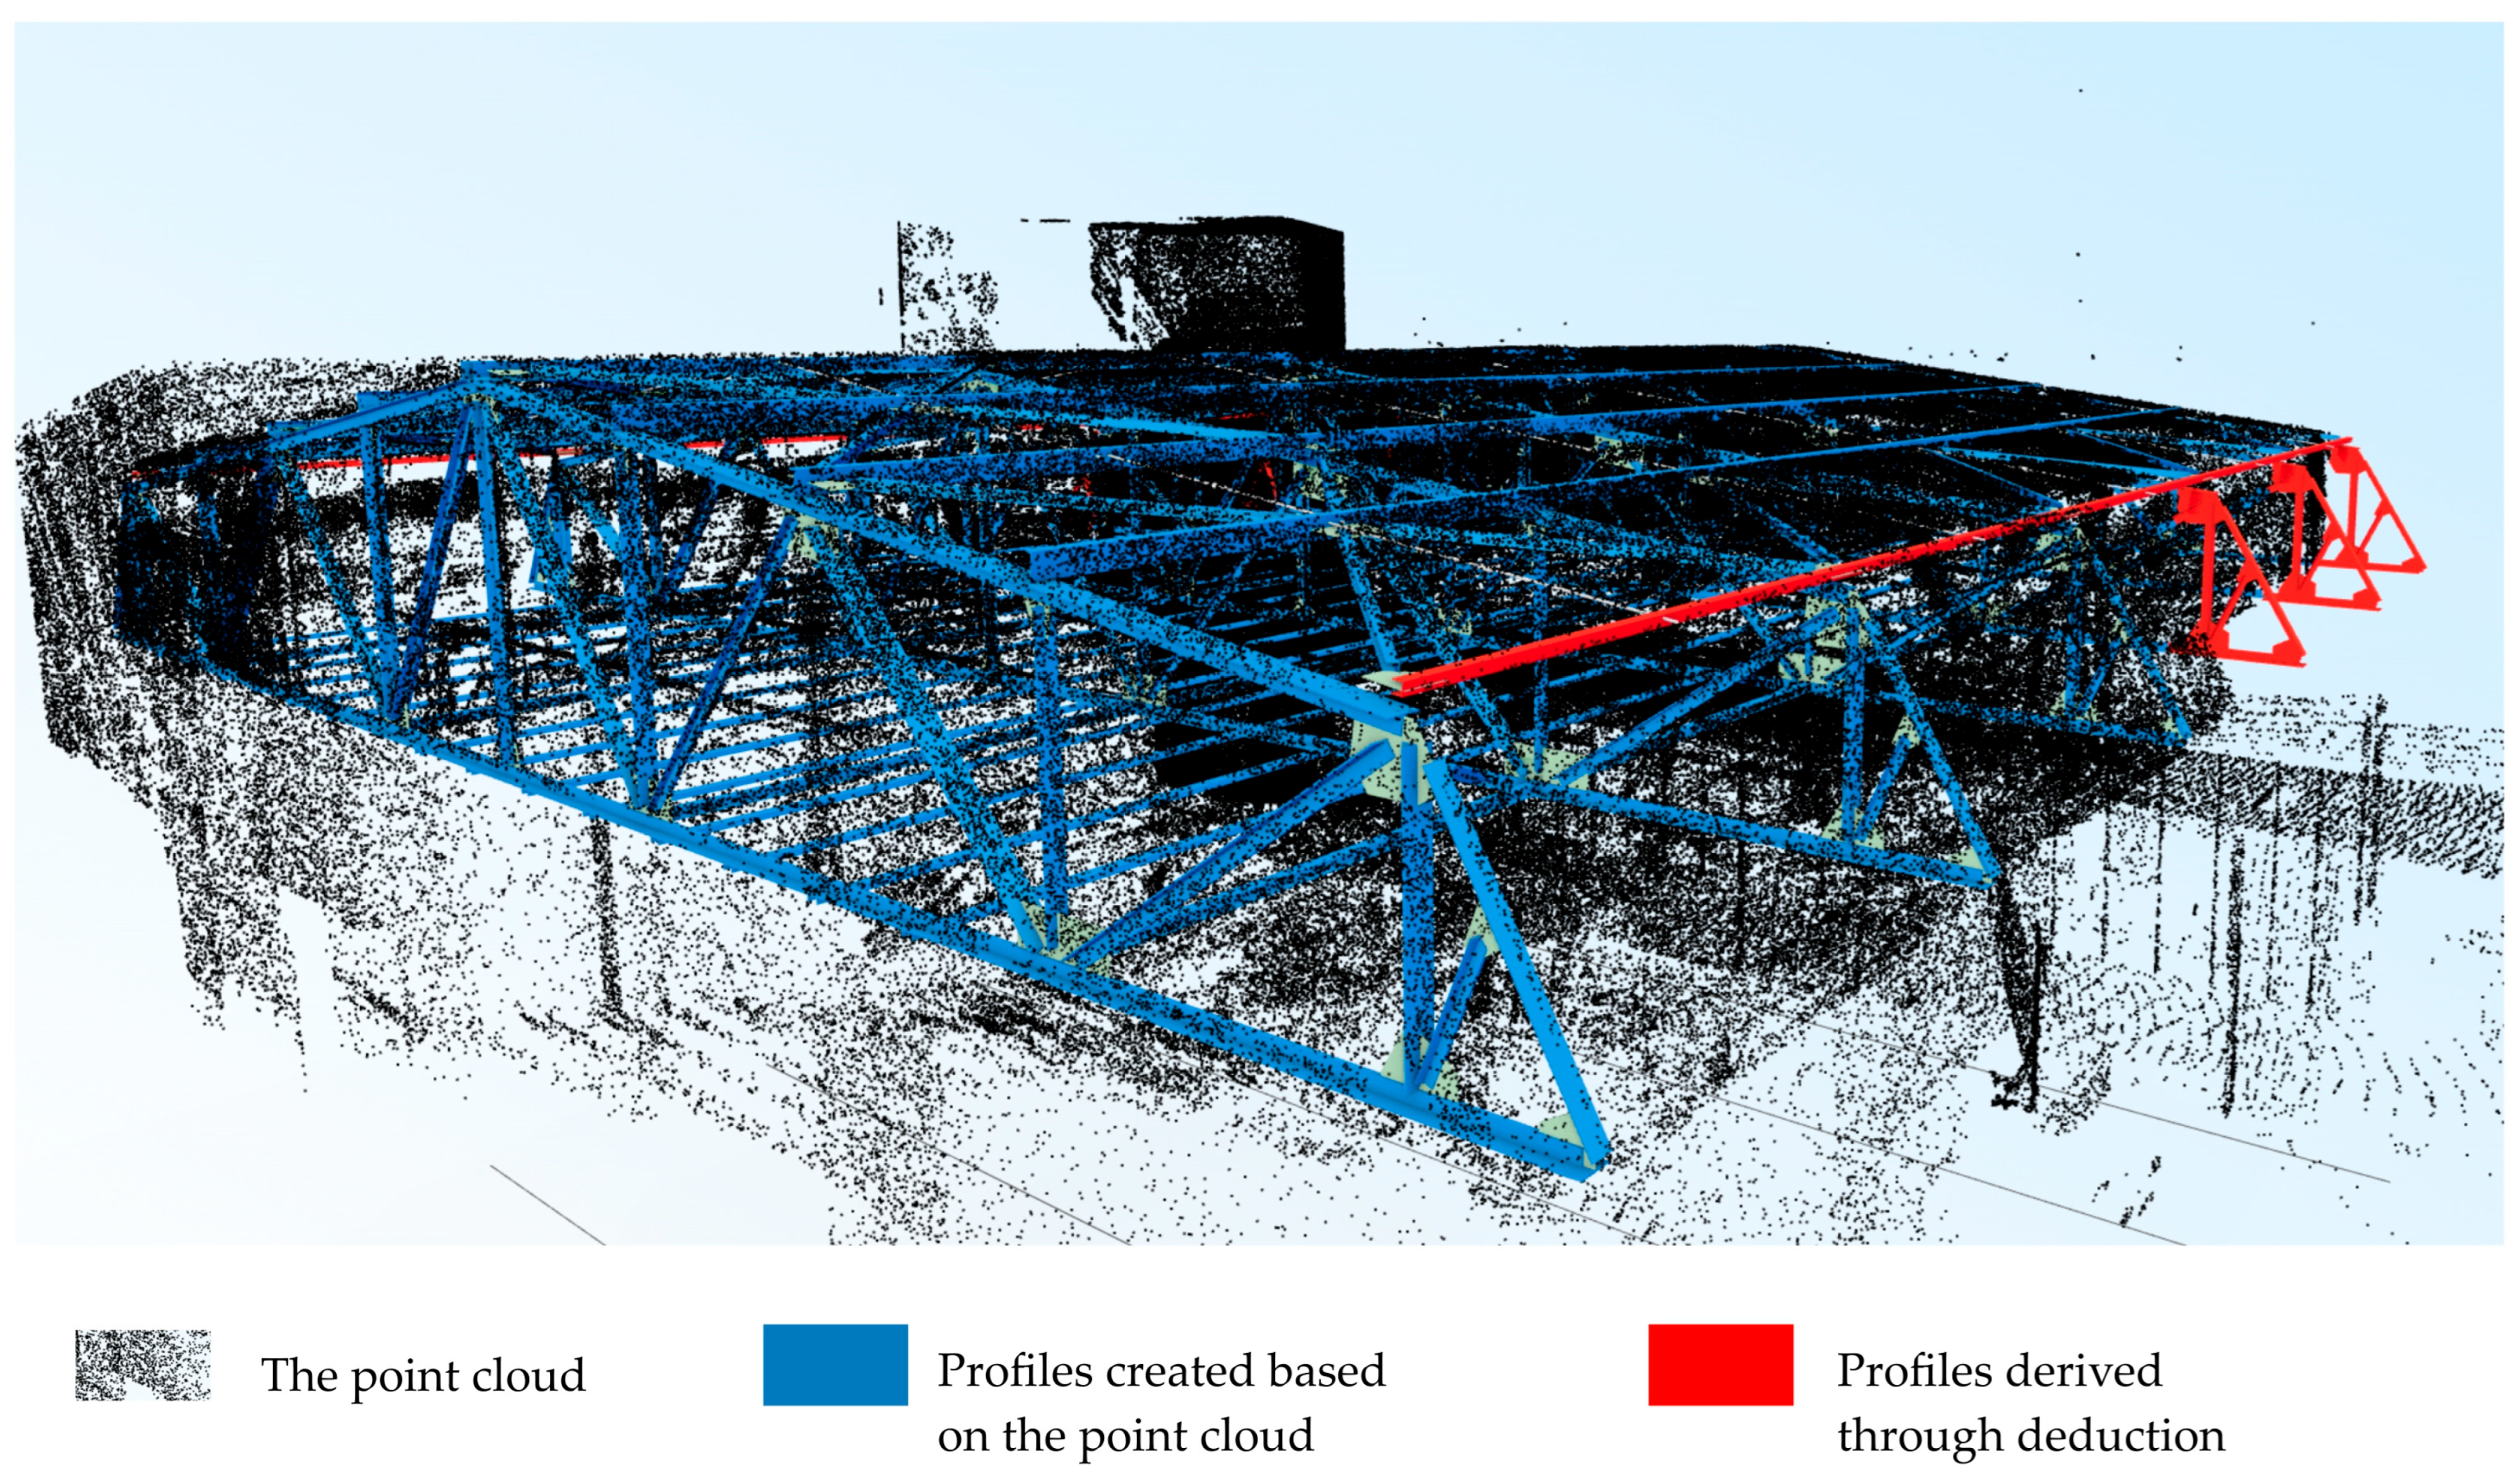
Figure 10.
Detailed area. (a) Representation of a metallic profile in cross-section from a 3D point cloud. (b) Overview photo of the spatial structure.
Figure 10.
Detailed area. (a) Representation of a metallic profile in cross-section from a 3D point cloud. (b) Overview photo of the spatial structure.
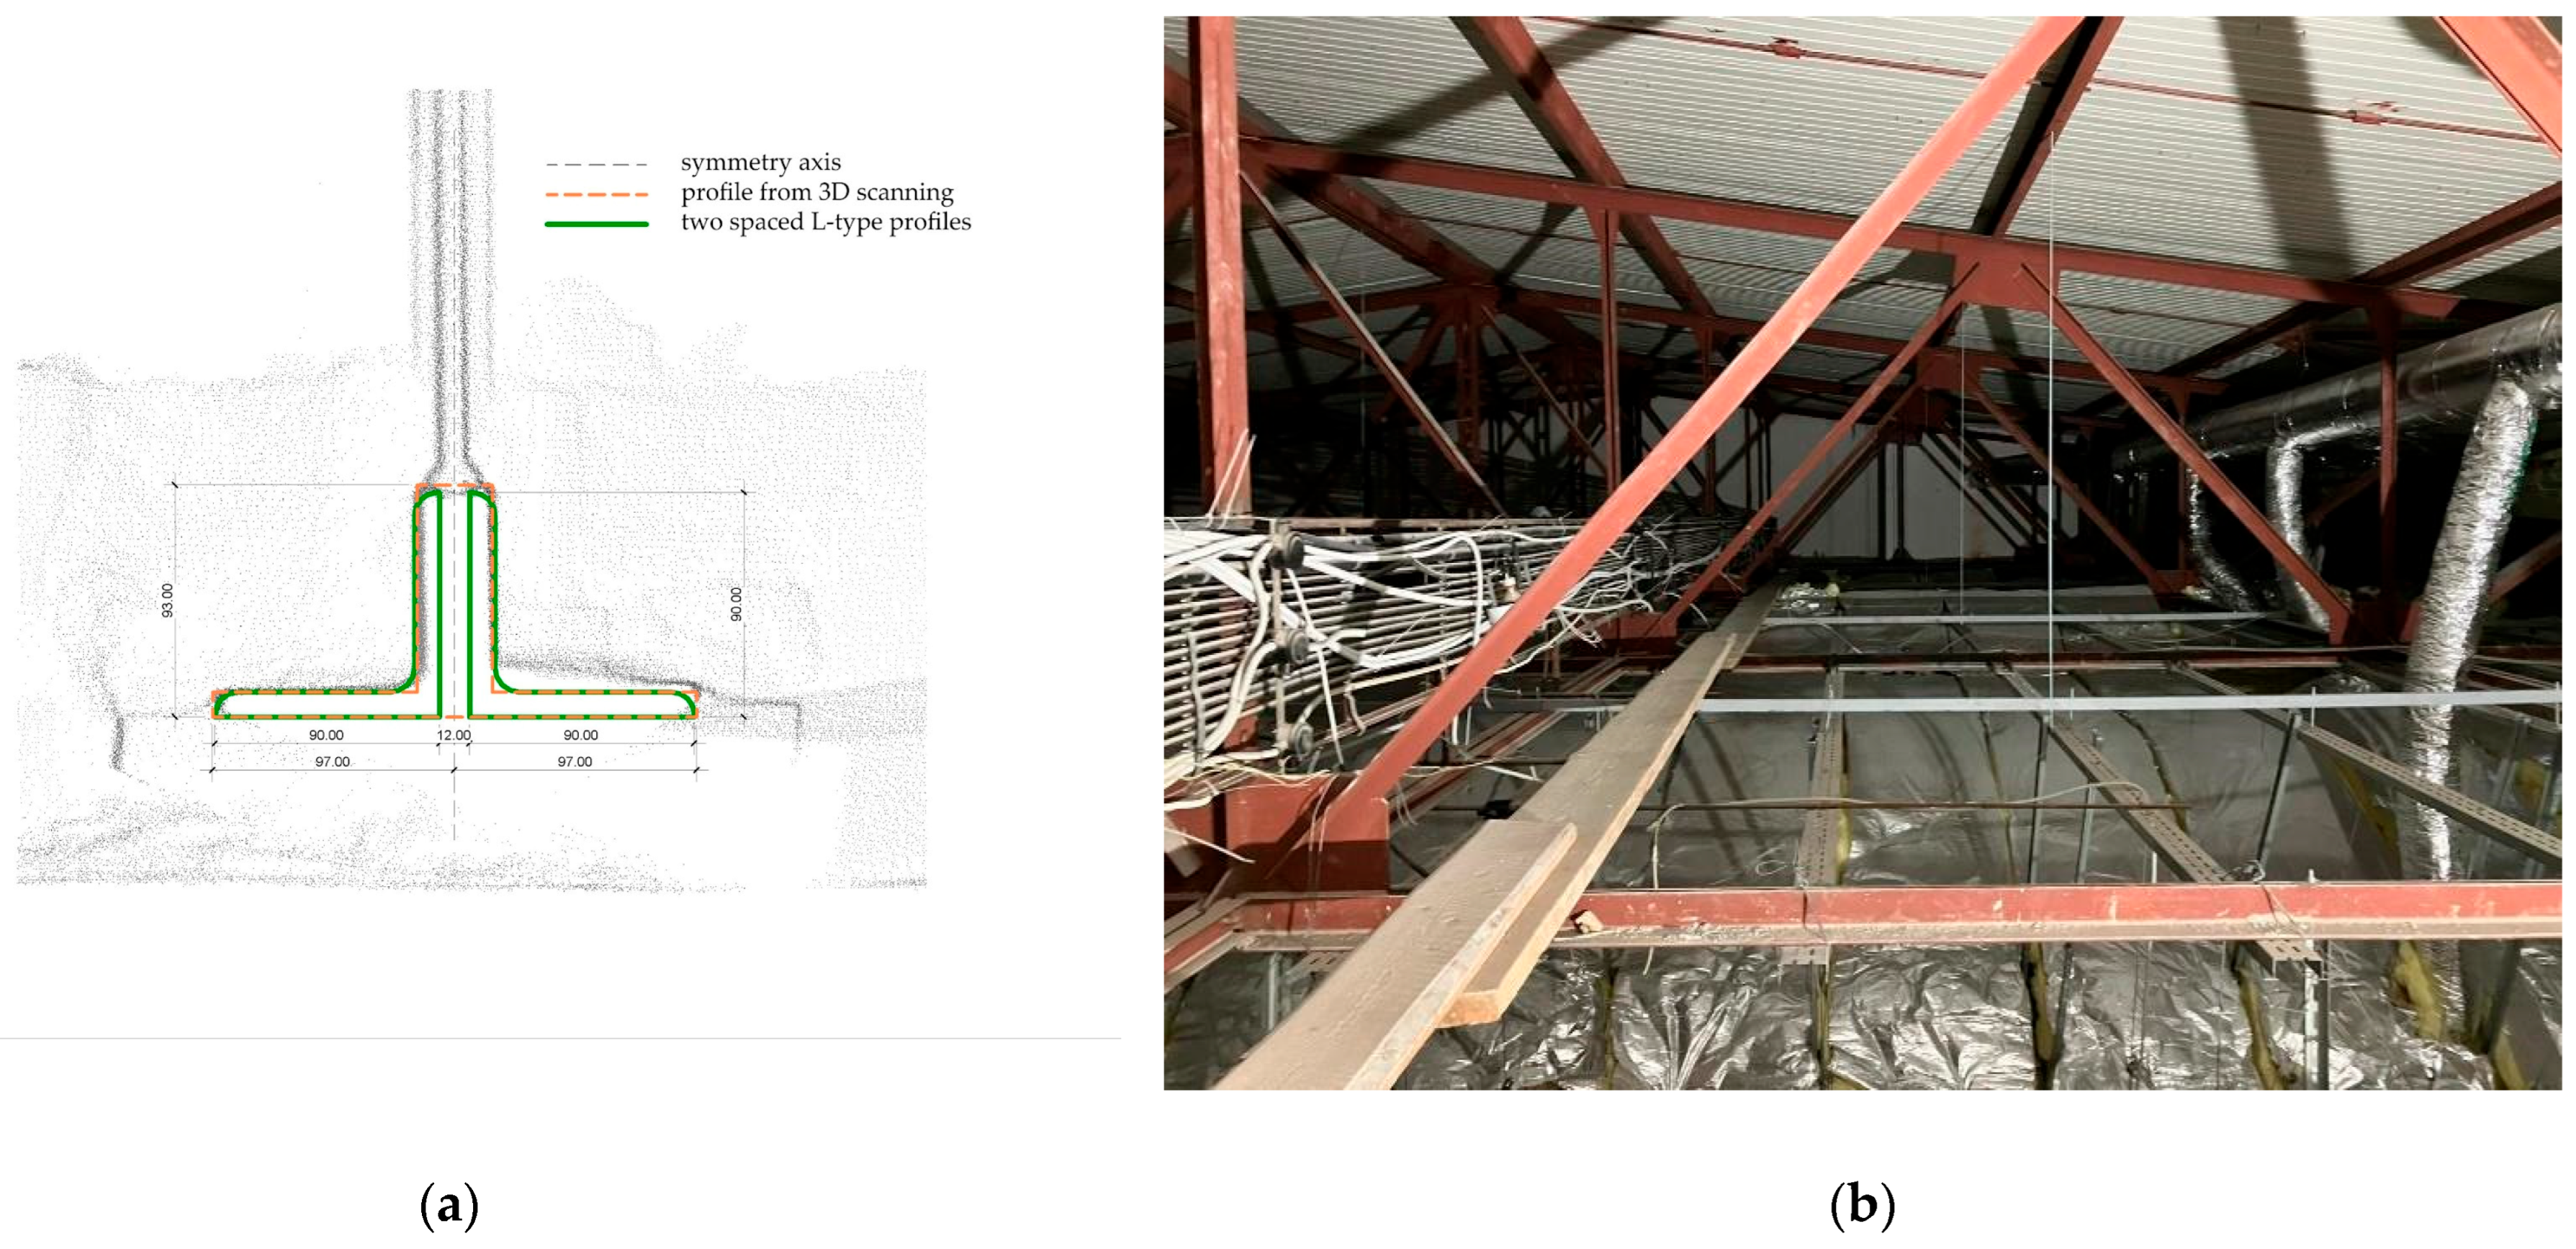
Figure 11.
Graphic illustration of the proposed methodology for quantity surveying using 3D scanning, traditional surveying techniques, and additional data (hand sketches, photos, and videos).
Figure 11.
Graphic illustration of the proposed methodology for quantity surveying using 3D scanning, traditional surveying techniques, and additional data (hand sketches, photos, and videos).
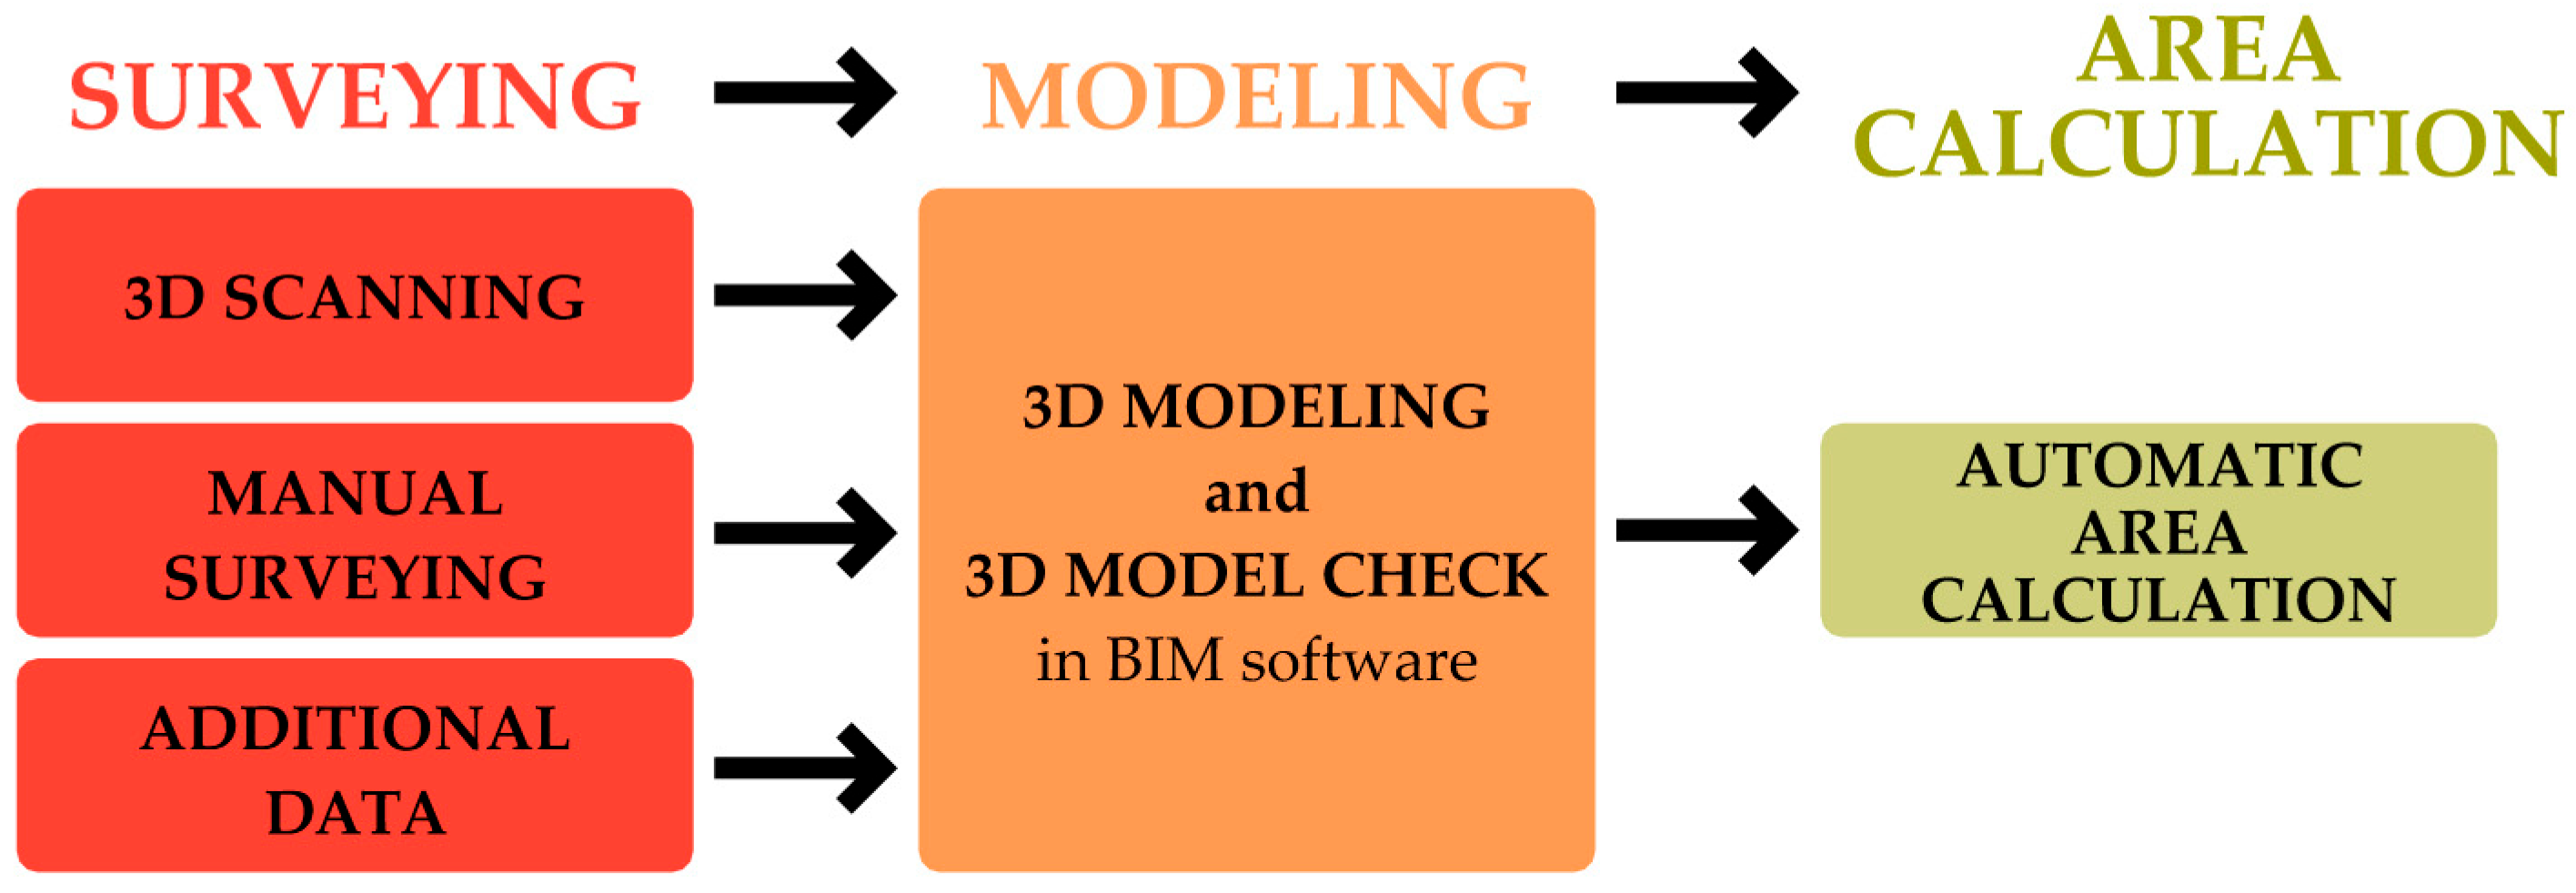
Table 2.
Cross-section and coverage areas of real profiles and 3D Scan Model profiles.
Table 2.
Cross-section and coverage areas of real profiles and 3D Scan Model profiles.
| Truss Element | Actual Section | 3D Model Section | Actual Coverage Area AL (m2/m) |
3D Model Coverage Area AL (m2/m) |
Difference |
|---|---|---|---|---|---|
| Bottom chord | 2 × 90 × 90 × 10 | 194 × 93 × 29 | 0.702 | 0.574 | +22.3% |
| Top chord | 2 × 100 × 100 × 12 | 192 × 101 × 27 | 0.780 | 0.586 | +33.11% |
| Webs | 2 × 65 × 65 × 7 | 124 × 59 × 20 | 0.504 | 0.378 | +33.33% |
Table 3.
Table centralizing the results obtained. The last two columns show the differences between the area calculated using the initial 3D model that was made using the 3D scanning survey and the area calculated using the second 3D model that was made via the manual survey.
Table 3.
Table centralizing the results obtained. The last two columns show the differences between the area calculated using the initial 3D model that was made using the 3D scanning survey and the area calculated using the second 3D model that was made via the manual survey.
| 3D Model Used for Calculation | Area Calculation Method | Calculated Area | Difference (sqm) | Difference (%) |
|---|---|---|---|---|
| 3D scanning survey 3D model |
Automatically calculated area | 609.30 sqm | – | – |
| 3D scanning + manual survey 3D model |
Automatically calculated Area | 667.02 sqm | 57.72 sqm | +9.47% |
| Manually calculated area | 669.65 sqm | 60.35 sqm | +9.90% |
|
Disclaimer/Publisher’s Note: The statements, opinions and data contained in all publications are solely those of the individual author(s) and contributor(s) and not of MDPI and/or the editor(s). MDPI and/or the editor(s) disclaim responsibility for any injury to people or property resulting from any ideas, methods, instructions or products referred to in the content. |
[ad_2]