COVID | Free Full-Text | Peritraumatic Distress among Chinese Canadians during the Early Lockdown Stage of the COVID-19 Pandemic: Sociodemographic and Pandemic-Related Predictors
[ad_1]
1. Introduction
Following its initial outbreak in Wuhan, China, the Coronavirus Disease 2019 (COVID-19) virus rapidly swept over the world [1]. To restrict the virus’s spread, strict public health measures (e.g., lockdowns, hygiene practices such as handwashing and wearing a face mask, enforcing social distancing) were implemented across the globe [2]. In addition to the physiological risk posed by the virus, the global pandemic and its related health measures had significant consequences for the mental health of general populations across the world, including reports of psychological distress [3,4,5]. Furthermore, research suggests that visible minority groups may have been disproportionately impacted by the pandemic psychologically, particularly Chinese living overseas given heightened reports of racial discrimination [3,6,7,8,9,10]. This present study seeks to better understand the psychological experiences of this population by identifying sociodemographic and COVID-related predictors of distress during the initial lockdown phase of the pandemic (i.e., from April 2020 to June 2020).
1.1. The Psychological Impact of the Pandemic
Studies around the world have revealed the psychological impact (e.g., a high level of psychological distress, a rise in post-traumatic stress symptoms, and a higher prevalence of depression, anxiety, fear, insomnia, and alcohol abuse disorders) of the COVID-19 in general populations [3,4,11,12,13,14,15]. One global study found that during the first half of 2020, more than 50% of its sample reported symptoms of anxiety, stress, and depression ranging from mild to severe [5]. This same study found Canadians reporting the highest levels of depression and stress relative to other populations. A systematic review revealed a general deterioration of mental health during the first wave of the COVID-19 pandemic, as indexed by “psychological COVID-19 syndromes” such as higher anxiety, depression, and stress, as well as poorer well-being [16].
1.2. Chinese Canadian Population
Chinese Canadians, and especially Chinese immigrants, may be at a higher risk of experiencing distress during the COVID-19 pandemic. Prior to the pandemic, Chinese immigrants were found to experience psychological distress for a variety of factors, such as racial discrimination, cultural or language barriers, and stigma surrounding accessing mental health services [17,18]. During the pandemic, there was a growing concern among Chinese populations of experiencing prejudice and racial discrimination during the pandemic [6,8]. Consistently, Statistics Canada found that reports of racially based attacks and forms of harassment against Chinese Canadians increased by 30% from the onset of the pandemic to May 2020 [19,20]. Our past work also identified discrimination (perceived or experienced) as a robust and strong risk factor for COVID-19-related risk perceptions [21] as well as mental health outcomes among Chinese Canadians during the pandemic [10,22,23,24]. Increased incidences of racial discrimination, reports of higher anxiety symptoms among immigrant populations, and the cultural barriers/stigma around accessing mental health support make it essential to understand the risk factors for this population [10].
1.3. Sociodemographic Variables
To capture the risk factors for psychological distress during the pandemic, earlier studies have identified sociodemographic variables associated with psychological impact [2,3,8,12,13,14,25]. Overall, the female gender, a younger age, and lower education levels were identified as significant risk factors for psychological distress [3,5].
Women have consistently been found to be at a higher risk of experiencing distress relative to men, and several explanations have been proposed for this gender effect [3,8,13,14]. One account suggests that women are more likely than men to develop post-traumatic-stress and/or other anxiety disorders, which may heighten the risk of experiencing distress for women in the context of a global pandemic [26,27]. Alternatively, lockdown policies may have a differentially stronger indirect impact on the psychological well-being of women. For example, increased childcare/parental responsibilities following school closures have been found to disproportionately impact women more than men [20,28]. Similarly, the higher incidences of domestic/gender-based violence reported during the pandemic [3] might have had a differentially higher impact on women than on men.
A younger age has been found to be associated with experiencing higher psychological distress during the pandemic [2,3,8,13,14,29]. This younger age effect may be due to a higher level of social media and internet use relative to older adults, which was found to be associated with higher levels of anxiety during the pandemic [8,14,30]. However, some studies also found a higher impact on older adults aged 60 years or over, suggesting a possible U-shape effect, with younger and older age groups being at an increased risk relative to middle-aged adults [31,32]. On the other hand, survey studies on Chinese residents in Canada found mixed results with regard to the age differences observed for the psychological impacts of the pandemic. Some of these revealed lower non-pathological distress in young age groups relative to other ones [23], whereas others found lower distress in older age groups relative to other ones [10] or higher distress in middle-age relative to other age groups [24]. While many studies found that a younger age was associated with a higher psychological impact, this result might be driven by the limited participation of older adults or of immigrants in online studies.
A lower educational level (e.g., fewer years in formal education) has also been found to be associated with higher psychological distress [3,8,31]. It has been suggested that those with higher levels of education may be less likely to experience distress as they are better able to identify evidence-based news amidst COVID-19-related misconceptions [10,14]. Alternatively, differences in socioeconomic status may explain the effect of this education using a concurrent stressor model as remote work options may not be accessible to certain occupations that are typically associated with lower levels of education [33]. As such, these individuals may be at a higher risk of virus transmission, as they are unable to effectively engage social distancing and/or may likely experience higher financial instability than those with higher levels of education [34]. For this reason, income level may also serve as a predictor of increased psychological distress [35]. In a systematic review, healthcare workers, postpartum young women, and those with a lower income and education were identified as being the least resilient during the pandemic [16].
1.4. Pandemic-Related Variables
COVID-19 research has evaluated the experiences, beliefs, and behaviours that may increase a person’s risk of psychological distress, though the findings are inconsistent [8,13,14]. For example, while some studies have found that engagement in specific safety behaviours (e.g., frequent hand washing, avoiding crowded places, etc.) may be protective against psychological distress [8], others have found the opposite to be true [13,14,36].
Identifying individual perceptions and beliefs may help us to understand engagement with these behaviours and their associated risk. For instance, exposure to misinformation about the pandemic on social media has been found to be a risk factor for experiencing distress and may in turn affect the level of engagement with the safety behaviours that may be protective against experiencing distress (e.g., avoiding crowded places) [30]. Additionally, engagement with COVID-19-related information on social media may vary depending on individual beliefs about the purpose of these platforms. For instance, a study among older adults in Canada examined how the effects of social media on anxiety varied according to their perceived purpose of online social engagement (i.e., to bond with family/friends or to bridge and to broaden casual social networks and share information). Bonding social engagement had a protective effect and bridging social engagement had a detrimental effect on anxiety levels [37]. As such, understanding COVID-19-related perceptions may provide a more reliable model to identify and understand those at risk.
To further support this, several studies have examined whether believing the response to the COVID-19 was disproportionate to the threat that the virus posed (i.e., the “too much worry” belief) could predict distress levels. Surprisingly, this “too much worry” perception was associated with higher levels of psychological distress in multiple populations, which may be counterintuitive to the expressed belief at its face value [8,14]. Overall, these findings demonstrate how perceptual models may be a necessary approach for evaluating and identifying predictors of the pandemic’s psychological impact. Among Chinese residents in Canada, COVID-19-related perceptions such as a self-contraction worry have been associated with higher distress and loneliness during the pandemic [22].
In addition to behaviours and perceptions, COVID-19-related experiences may also predict the level of distress experienced, but research on this is scarce. Wang et al. [8] found that COVID-19 symptoms were related to higher levels of reports of trauma, depression, anxiety, and stress symptoms, and this finding was consistent after a 4-week delay. More research is needed to identify whether certain experiences related to the pandemic (e.g., becoming infected with COVID-19, knowing someone who has been infected, etc.) may be risk factors for higher psychological distress.
Research has also examined the impact of racial discrimination, especially on those nationalities and groups who have been highly impacted by the virus [3,6,7,8]. Prior to the pandemic, research suggested that the negative media portrayal of racial/ethnic groups following a global event was associated with a higher level of discrimination against those portrayed groups [38]. Presently, an increase in negative media exposure of Chinese groups was found to partially account for the rise in perceived anti-Asian discrimination [6,9]. More than 1150 attacks, both verbal and physical, against Chinese Canadians were reported to anti-discriminatory websites and helplines between March 2020 and February 2021 [39]. Survey data showed that perceived and experienced discrimination showed a strong prediction for the mental health condition of Chinese migrants in Canada [10]. Thus, COVID-induced perceived racial discrimination was included in this study as a potential pandemic-related predictor of psychological distress levels.
1.5. Coping and Life Satisfaction
Coping behaviours, which are broadly defined as behavioural and cognitive activities that buffer the negative impact of stress [40], have been shown to attenuate the level of psychological distress experienced during the COVID-19 pandemic. For example, coping behaviours that are more action-oriented such as seeking out social support were found to decrease the level of stress and burnout experienced by healthcare workers [41,42,43]. A wide range of behaviours may facilitate coping, where engagement in activities such as exercising, exploring online activities, and talking to friends and family are found to reduce depressive and anxiety symptom endorsement in the context of the pandemic [37,44]. Similarly, life satisfaction may also play a buffering role in COVID-19-related psychological distress. Early research has demonstrated that individuals with high life satisfaction are more resilient to psychological stress [45]. More recently, in a survey of 907 Polish participants, life satisfaction was negatively correlated with health-related worries about COVID-19 [46]. Some studies have shown that life satisfaction may have a mediating/moderating role in the relationship between depressive symptomatology and psychosocial well-being in the context of the pandemic [47,48]. Altogether, engaging in coping behaviours and higher life satisfaction appear to reduce or buffer against psychological distress, but there is a paucity in the literature regarding the role of these variables as moderators between sociodemographic/COVID-related variables and distress, particularly as far as they relate to Chinese Canadians. This present study hopes to address this gap in the literature.
1.6. Present Study
The present study seeks to identify the predictors of psychological distress among Chinese residents in Canada during the early stage of the COVID-19 pandemic. A significant body of research has been dedicated to understanding the psychological impact of the pandemic given the sustained financial, social, and physical risks posed by COVID-19 [49]. By examining the predictors in the early stage of the lockdown, we attempt to better capture those intersecting risk factors and thus provide guidance for effective distress prevention in a public health crisis. Using an online survey, this explorative study aims to carry out the following: (1) identify the sociodemographic predictors of psychological distress and (2) determine the pandemic-related predictors (e.g., COVID-19-related experiences, perceptions, and safety behaviours) of psychological distress among Chinese residents in Canada. Additionally, considering how individual differences in coping and life satisfaction might impact the distress level, we included coping and life satisfaction as moderators in our models.
2. Materials and Methods
2.1. Participants
Participants were openly and widely recruited using a post with an online survey link and/or an associated QR code through a local community email list, social media posts (e.g., WeChat), project or lab websites, and the internet. WeChat is one of the most widely used social media platforms among Chinese residents in China and in Canada [50]. A total of 1078 participants attempted to complete the survey. Among them, 656 responses passed the screening questions based on the following inclusion criteria: (1) being at least 18 years old; (2) being Chinese migrants in Canada, including Canadian citizens and permanent residents of Chinese descent as well as Chinese international students or those with valid work/visit permits; (3) having lived or planning to live in Canada for more than four weeks; and (4) being able to read and write Chinese. Participants should also have had access to a device with internet access to enable online survey completion. Those who failed to respond to the age question and at least half of the items (i.e., 12) in the CPDI (n = 199) were further excluded from the final analysis, resulting in a final sample of 457 participants. Figure 1 illustrates the sampling and selection procedure. Considering that the sociodemographic questions were given at the end of the survey, the excluded participants due to missing data (n = 199) also barely completed any sociodemographic questions, so it is impossible to assess the attrition effects based on sociodemographic variables. The study received ethics approval from the Toronto Metropolitan University (REB 2020-132) and Memorial University of Newfoundland (20201772-ME).
2.2. Materials
The survey was built in QualtricsTM and delivered online (Qualtrics, Provo, UT, USA) as well as in Mandarin during the first COVID-19 lockdown period in Canada (i.e., between 25th April and 8th June 2020). The survey includes three sections as follows: (1) COVID-related experiences (perception, experience, and behaviour), (2) mental health and subjective well-being; and (3) sociodemographic and coping behaviour endorsement. The current report specifically focused on psychological well-being as the outcome variable as assessed using the COVID-19 Peritraumatic Distress Index (CPDI). It aims to identify the associated sociodemographic and COVID-related predictors as controlled for coping behaviour endorsement and subjective life satisfaction. The questions on sociodemographic and COVID-related experiences are modelled on similar surveys in previous studies [31,51].
2.2.1. The COVID-19 Peritraumatic Distress Index (CPDI)
The COVID-19 Peritraumatic Distress Index (CPDI) is a validated self-report questionnaire on peritraumatic stress symptoms related to the COVID-19 outbreak [31,52]. It has 24 items that assess the frequency of symptoms related to anxiety, depression, phobias, cognitive changes, and compulsive behaviour, as well as declines in physical and social functioning within the past week [31]. The CPDI has been used among Chinese, Italian, and Canadian populations to assess COVID-19-related distress levels [2,12,31] and was chosen for this study to measure psychological distress related to the COVID-19 pandemic.
In the CPDI, participants were asked to rate to which degree a statement applied to them over the past week (e.g., “I am so scared that I avoid attending to the COVID-19 news”) using a 5-point Likert scale ranging from 0 (never) to 4 (very often). Scores are summed from 0 to 96, with a higher score indicating a higher level of distress. A score of 28–51 has been validated for mild to moderate distress and a score of ≥ 52 for severe distress [31]. As per convention, missing values were replaced by the average for each participant.
2.2.2. Sociodemographic Variables
Sociodemographic information was collected, including age, gender, education level, marital status, employment status, citizenship status, place of birth, how long they have been in Canada, the number of people living in the same residence (i.e., housing size), income level (scaled from 1 to 5), and self-rated physical, mental, and sleep health.
2.2.3. Pandemic-related Variables (Experiences, Cognitions, and Behaviours)
The survey also includes questions on COVID-19-related experiences, cognition, and behaviours. For COVID-19 experiences, the four items assessing diagnosis/exposure status of the self and others who are close (e.g., “have you been diagnosed with the COVID-19?” for self diagnosis status and “are there any confirmed or suspected COVID-19 cases among your friends, family, or colleagues?” for other diagnosis statuses) were merged into one index for the infection/exposure status (“Yes” or “No/missing”). Another COVID-19 experience item assessed the action experiences related to COVID-19 (“did you have any of the following experiences during the pandemic”, with options such as self-isolation, fundraising, volunteering, donations, etc.).
COVID-19 cognitions were assessed with 10 items as follows: (1) infection likeliness (“how likely you will be infected with COVID?”); (2) self/family contraction worry (e.g., “are you afraid that yourself/family contracting the virus?”); (3) COVID-19 information authenticity (e.g., “are you bothered by the authenticity of the information received on COVID pandemic”); (4) Canada measure attitude (“your attitudes towards Canada’s measure?”); (5) threat perception (e.g., “do you believe the COVID-19 pandemic is a real threat?)”; (6) discrimination perception (e.g., “do you think that the COVID-19 breakout will result in prejudice and discrimination against Chinese in Canada?”); (7) 4 items on future infection predictions (e.g., “estimate the percentage of the population in your community/Ontario /Canada/World that will be infected by the COVID-19.”); (8) 6 items on personal measure effectiveness perception (e.g., “how effective do you think the following measures in restricting the spread of the virus”); and (9) 5 items on the level of public measure support (e.g., “to which degree do you support the following COVID-restriction public measures?”). Nearly all these items employed a 5-point Likert scale ranging from 1 (“strongly agree”) to 5 (“strongly disagree”), except for the outbreak threat perception items that used a text-entry format. All these variables were thus analyzed as continuous variables.
COVID-19 behaviours were assessed in a dichotomized format (i.e., “Yes” or “No/missing”) for the engagement of nine different behavioural preventative measures in the past week (e.g., “avoided crowded places?”, “cleaning/disinfecting rooms”, or “stocking food and good?”).
2.2.4. Moderator Variables
At the end of the survey, coping behaviour endorsement was further addressed through two multiple-choice questions. The first question (“Which of the following methods do you usually use to reduce stress/anxiety?”) identifies commonly used stress coping behaviours by responding (“Yes” or “No”) to a list of potential behaviours (i.e., exercise, listening to music, reading, drinking tea, and/or chatting with friends/family). The second question (“What kind of music can effectively help you relieve your emotions?”) identifies (“Yes” or “No”) the genre of music (i.e., classical, nature sound, pop, religious, love) that was perceived as being effective in mood regulation. Each of these options were coded as a dichotomous variable (“Yes” or “No”).
The Satisfaction with Life Scale (SWLS; Pavot and Diener, 1993) assesses the global perception of life satisfaction with 5 items based on a 7-point Likert scale from 1 (strongly disagree) to 7 (strongly agree). The sum score (ranged 5–35) was used to index life satisfaction, with a higher score meaning higher satisfaction. The SWLS has a strong internal reliability (as = 0.79–0.89) and moderate temporal stability (rs = 0.50–0.84 over 2 weeks to 4 years) (Pavot and Diener, 1993). The current sample in this study also showed a strong internal reliability (a = 0.94).
2.3. Statistical Analysis Approach
Data were analyzed in IBM SPSS Statistics for Windows, Version 23 (IBM Corp., Armonk, NY, USA). Given the high number of independent variables, in order to ensure statistical power, we separately analyzed sociodemographic variables and COVID-19-related variables (i.e., behaviours, cognitions, and experiences) as predictors in two regression models for the outcome variable (i.e., the CPDI score). To best capture the variance in the CPDI and for clarity consideration, some predictive variables were simplified by being recoded into binary or either 3-level or 4-level categorical variables based on the preliminary frequency analysis on the CPDI score distribution across the options of each predictive variable. For example, age was coded into three levels (i.e., 18 to 34, 35 to 64, and 65 or older) and gender was coded into female and male. Based on a principal component factor analysis of the three 5-point items for health status (mental health, physical health, and sleep quality), a single-factor (λ = 2.18) was extracted (λ = 2.23, loading = 0.82–0.90), which was indexed by a composite score for general health status. Multiple factor analyses were conducted for the COVID-19 experience, cognition, and behaviour items. One factor was extracted from the four future infection prediction items (λ = 3.36, loading = 0.86–0.96). Two factors were extracted from the six items on personal measure perception as follows: behavioural measures (4 items on hand-washing, mask-wearing, disinfection, and reducing going out, respectively; λ = 3.21, loading = 0.76–0.84) and health hygiene (2 items on salt water gargling and taking vitamin C or other health products, respectively; λ = 1.17, loading = 0.91–0.93). One factor was extracted from the five items on public measure support (λ = 2.71, loading = 0.30–0.86). Finally, two factors were extracted from the nine behavioural preventative measure engagement items as follows: avoidance behaviours (e.g., “avoid eating out”, “avoid public transportation”, “avoid crowding public places”, “avoiding visiting relatives and friends”, and “cancelling travel plans”; λ = 2.78, loading = 0.58–0.74) and endorsement behaviours (e.g., “stocking food and grocery items”, “cleaning/disinfecting rooms”, “maintaining indoor air circulation”, and “personal hygiene practices such as hand-washing and mask-wearing”; λ = 1.43, loading = 0.45–0.78).
In the final data analysis, potential categorical sociodemographic and COVID-related predictors were identified through univariate analysis of variance models (ANOVAs) on group differences in the CPDI score stratified by categorical sociodemographic (Table 1) and pandemic-related variables (Table 2). As per convention [53], categorical variables with a p ≤ 0.20 in ANOVAs were included as potential covariate predictors in the corresponding multi-level linear regression models see Table 2 and Table 3). Furthermore, potential continuous predictors were identified through Pearson correlations, with those showing a significant correlation with the CPDI score (e.g., income level, health status, COVID-19 contraction worry, COVID-19 threat perception; ps
3. Results
3.1. Sample Characteristics
The final sample included 457 participants. The sample characteristics were displayed in Table 1. A majority of the final sample was female (72.21%), married/partnered (82.71%), highly educated (76.15% had completed university or higher education), and living in Ontario (81.62%). Based on their CPDI score categories, 58.21% scored in the normal range (i.e., 0–27), 32.76% scored in the mild to moderate range (i.e., 28–51), and 5.03% scored in the severe range (i.e., 52 to higher).
3.2. Sociodemographic Predictors for the CPDI
Group differences stratified by sociodemographic categorical variables in the CPDI were analyzed with an overarching univariate ANOVA (Table 1). The results showed that the CPDI varied by age, employment status, housing size, and the region of residence (ps ≤ 0.036), with the highest score observed for the middle-aged group, the employed group (with the lowest score being observed for the retired/student group), and the middle-size housing group (i.e., 3–4 people), as well as those living in Ontario (higher than elsewhere). We also further analyzed the group difference in the CPDI as stratified by coping behaviour endorsement and music coping appraisal and identified that those who engaged in reading scored lower in the CPDI relative to those who did not (p = 0.035). Pearson correlation analysis was conducted to identify the relationship between continuous sociodemographic variables and the CPDI (Table 4). Both family income level and health status were found to be negatively correlated with the CPDI (ps ≤ 0.027). The SWLS also showed a negative correlation with the CPDI (p
A 2-step hierarchical linear regression model was run to identify the sociodemographic predictors of the CPDI (as the outcome variable). The results were displayed in Table 2. In Step 1 (Model 1), the SWLS and coping behaviour endorsement variables potentially predicting the CPDI as identified in the ANOVA (i.e., exercise, reading, pop music, and love song; ps ≤ 0.20 in Table 1) were entered as moderators. All the potential sociodemographic predictors identified in the ANOVA (i.e., age group, education, employment status, housing size, region of residence, religion; ps ≤ 0.20 in Table 1) and correlation analysis (i.e., family income, health status; p Table 4) were added in Step 2 (Model 2). Both Model 1 (R2 = 0.28, F = 33.89, p R2 = 0.45, F = 18.58, p β = −1.21 to −0.49, ps ps
3.3. Pandemic-Related Predictors of the CPDI
Group differences stratified by COVID-related categorical variables in the CPDI were analyzed with an overarching univariate ANOVA (Table 4). No statistically significant group differences were found (ps ≥ 0.061). Pearson correlation analysis was conducted to identify the relationship between COVID-related continuous variables (i.e., all COVID-19 cognition variables) and the CPDI (Table 3). All COVID-19 cognition variables were found to be significantly correlated with the CPDI (ps ≤ 0.004) except for those of “personal behavioural measure perception” and “public measure support” (ps ≥ 0.195).
A 2-step hierarchical linear regression model was run to identify COVID-related predictors of the CPDI (as the outcome variable). The results were displayed in Table 5. In Step 1 (Model 1), the SWLS and coping behaviour endorsement variables potentially predicting the CPDI as identified in the ANOVA (ps ≤ 0.20 in Table 1) were entered as moderators. All the potential COVID-related predictors identified in the ANOVA (ps ≤ 0.20 in Table 1) and correlation analysis (p Table 4) were added in Step 2 (Model 2). Both Model 1 (R2 = 0.27, F = 27.44, p 2 = 0.43, F = 17.52, p ps ps
Table 5.
Linear regression of the Pandemic-related predictors of the CPDI (N = 378).
Table 5.
Linear regression of the Pandemic-related predictors of the CPDI (N = 378).
| Step | Predictors | CPDI | ||||
|---|---|---|---|---|---|---|
| β | 95% CI | R2 | F | |||
| 1 | SWLS | −1.20 *** | −1.40, −0.99 | 0.29 | 27.44 *** | |
| Coping: Exercise | Yes (reference) No/missing |
1.00 | −1.53, 3.53 | |||
| Coping: Reading | Yes (reference) No/missing |
0.32 | −2.12, 2.77 | |||
| Coping: Pop music | Yes (reference) No/missing |
2.18 | −0.34, 4.70 | |||
| Coping: Love song | Yes (reference) No/missing |
1.13 | −1.78, 4.04 | |||
| 2 | SWLS | −1.02 *** | −1.21, −0.82 | 0.43 | 17.52 *** | |
| Coping: Exercise | Yes (reference) No/missing |
0.18 | −2.08, 2.45 | |||
| Coping: Reading | Yes (reference) No/missing |
0.49 | −1.69, 2.66 | |||
| Coping: Pop music | Yes (reference) No/missing |
2.23 | −0.01, 4.48 | |||
| Coping: Love song | Yes (reference) No/missing |
0.48 | −2.12, 3.07 | |||
| COVID-19 experience: Infection/exposure |
Yes (reference) | |||||
| No/missing | 0.64 | −2.96, 4.25 | ||||
| Action | Yes (reference) | |||||
| No/missing | 2.32 | −0.74, 5.38 | ||||
| COVID-19 behaviour: Avoidance |
Yes (reference) | |||||
| No/missing | 4.33 | −7.80, 16.46 | ||||
| COVID-19 cognition: Infection likeliness |
1 = lowest, 5 = highest | −0.76 | −2.12, 0.61 | |||
| Self-contraction worry | 1 = lowest, 5 = highest | 3.38 *** | 1.73, 5.04 | |||
| Family-contraction worry | 1 = lowest, 5 = highest | 0.33 | −1.28, 1.93 | |||
| Information authenticity concern | 1 = lowest, 5 = highest | 2.16 *** | 0.99, 3.34 | |||
| Canada measure attitude | 1 = very positive, 5 = very negative |
−0.60 | −1.56, 0.36 | |||
| Threat perception | 1 = lowest, 5 = highest | 1.07 | −0.40, 2.55 | |||
| Discrimination perception | 1 = lowest, 5 = highest | 0.92 | −0.28, 2.11 | |||
| Future infection prediction | 0–100% | 0.10 ** | 0.04, 0.17 | |||
| Personal health hygiene | 1 = completely ineffective, 5 = completely effective |
1.61 ** | 0.46, 2.76 | |||
4. Discussion
The purpose of this study was to identify sociodemographic and pandemic-related variables (i.e., experiences, perceptions, and/or behaviours) that may be predictors of psychological distress among Chinese residents living in Canada during the first lockdown period of the pandemic (April–May, 2020). Overall, this study identified several sociodemographic risk factors including being in the middle-aged group (aged 35–64) relative to young adults, living in Ontario (relative to elsewhere), and a poor health status, as well as a few COVID-19-related cognition risk factors (i.e., self-contraction worry, COVID-19 information authenticity concern, future infection rate prediction, and personal health hygiene effectiveness rating). Additionally, certain variables were found to buffer distress in this population, including being retired or a student (relative to being employed) and/or higher life satisfaction.
4.1. Sociodemographic Predictors
A few key sociodemographic predictors of psychological distress were identified, including age group, residence in Ontario, and health status. The results found a higher risk among middle-aged individuals of psychological distress than among young adults. This finding is consistent with the highest stress level reported by middle-aged group among Chinese migrants in Canada based on the same sample [24]. The disadvantages of the middle-aged group are in line with the emerging literature that recognizes the increased likelihood of middle-aged adults bearing primary family responsibilities including caregiving and financial security, particularly within certain sociocultural contexts such as within the Chinese community [23]. In contrast, the current sample of young adults, which is predominantly composed of international students, reported reduced levels of psychological distress, which are likely to be attributable to continued access to familial support for financial or emotional concerns and having fewer caregiver burdens on average relative to middle-aged adults. The relatively lower levels of psychological distress reported in this sample may further drive this age discrepancy in psychological well-being. Additionally, previous studies that identified a younger age as a risk factor [32] might stem from exclusively comparing younger with older adults (i.e., without a middle-aged group).
The current study reported the highest distress for residents in Ontario. This result supports previous studies that identified geographic variations in risk perception [8]. This Ontario-specific vulnerability is likely to be multifactorial in nature, with variables such as epidemiological factors (e.g., higher population densities, differential infection rates) and the stringency of the lockdown measures (with social isolation being associated with poorer emotional well-being; [54]). Those with a poor health status were more likely to experience COVID-19-related distress, which is likely due to a combination of higher physical vulnerability and the health threat of contracting COVID-19, with these factors being compounded by the limited access to healthcare experienced by Chinese individuals in Ontario [23,55].
Interestingly, the present study uncovered potential protective factors that mitigate psychological distress among the Chinese migrants in Canada. In line with our hypotheses, life satisfaction was found to buffer the effects of psychological distress. This finding is consistent with a high body of evidence demonstrating the role of life satisfaction in attenuating poor psychosocial well-being during the pandemic [41,42,47]. Individuals who were retired or students, in contrast with those who were employed, also demonstrated a buffering effect against distress. While other studies have consistently found that employment status is a protective factor against depression symptomatology [56], our results diverge, thereby suggesting that employment is a potential risk of psychological distress. This shift aligns with findings in other populations during COVID-19 [29], indicating a contextual transformation of employment status from being a protective factor to a risk factor. In the context of a global pandemic, individuals with in-person jobs face a higher risk of contraction. In contrast, the students or retirees in our sample who tended to be more isolated due to quarantine measures at the onset of the pandemic exhibited a comparatively lower risk of distress. However, it is essential to compare the relative risk posed by employment status among individuals within the same age cohort given that the observed impact of retirement may be susceptible to confounding with age-related factors, especially considering that older adults are not only more likely to be retired but also exhibited lower distress levels in comparison with middle-aged counterparts.
Certain variables such as gender (specifically women), lower education, and income levels were not predictive of psychological distress. This finding is inconsistent with previous research examining the sociodemographic predictors of emotional distress during the COVID-19 pandemic, which found that women, those with a lower income level, and those with lower education had higher psychological distress [8,16,34,57]. This may reflect that stressors related to COVID-19 were universally experienced across our population during the initial phase of the pandemic, thereby obscuring the discernible effects associated with these sociodemographic conditions. Moreover, within our sampling frame (from April to June 2020), it is conceivable that variables such as age group and health status might have accounted for a more substantial portion of the variance within our regression model.
4.2. Pandemic-Related Predictors
The examination of COVID-19 cognitions, including self-contraction worry, COVID-19 information authenticity concern, and future infection rate prediction, revealed significant associations with psychological distress. In line with the literature, COVID-related cognitions (i.e., self-contraction worry) and the predictive risk of infection were also found to be significant predictors of psychological distress in 2021 [22]. These fearful cognitions of contracting the COVID-19 likely contributed to higher engagement in safety behaviours, thereby replicating findings during the SARS pandemic where participants exhibiting elevated anxiety levels were also more inclined to engage in heightened safety measures [36]. With regard to information authenticity, these findings replicate studies that have identified access to precise health information, including details on virus transmission, treatment approaches, and high-risk areas for contraction, was linked to reduced levels of psychological distress [8].
While it is less clear why hygiene effectiveness predicted higher psychological distress in our current data, we speculate that it may be explained by diverse and potentially interrelated factors such as perfectionism or obsessive traits [58], a fear of contamination [59], perceived threat and hyperawareness [60], and potential social comparison pressures [61]. The overall pattern suggests that cognitive, emotional, and behavioural responses to the pandemic are associated with psychological distress. Specifically, those with higher psychological distress are more likely to be those individuals who engage in preventative safety behaviours and show higher levels of concerns about the pandemic and contraction.
4.3. Perceived Racial Discrimination
Surprisingly, self-reported perceived discrimination is not associated with COVID-19-related psychological distress. While the sample expressed moderate to high levels of discrimination (M = 3.54 out of 5), which are themselves noteworthy, it is likely that the reported discrimination may not be specific to the context of the COVID-19. For example, Yu and colleagues [24] reported an increase in perceived discrimination that was associated with reduced broad psychological functioning (i.e., higher depression, anxiety, and stress levels). Other reports based on a survey conducted in 2021 showed a robust relationship between COVID-19 anti-Chinese discrimination and CDPI scores [10,22]. Potentially, these findings suggest that the effects of discrimination are more selective to psychological well-being at the earlier stages of the pandemic and have developed in pervasiveness over the course of the COVID-19 pandemic to encapsulate pandemic-related cognitions. It is also speculated that health-related worries regarding the pandemic may been primed by the specific wording of scale questions, potentially overshadowing the more subtle presentations of COVID-19-related perceived or experienced discrimination. Nevertheless, the present study results provide a baseline estimate in the Wave 1 data for discrimination experience in Canada.
5. Limitations
In the context of the elevated proportion of highly educated, middle-aged (aged 35 to 64 years), employed, and female respondents, convenience sampling may have restricted the generalizability of the findings as certain social groups (e.g., unemployed, low education) were underrepresented in the sample. Furthermore, the coping behaviour endorsement variables were all responded to through a dichotomous Yes/No, which may have restricted the variance of these variables and thus masked their prediction of psychological distress. However, it should be noted that the low frequencies of these behaviours likely match natural variation in the population given the stringent COVID-19 precautions during this period. Given the known relationship between acculturation and psychological well-being, the influence of acculturation over COVID-19-related psychological distress was not assessed, thus representing a potential future avenue of research.
6. Conclusions and Implications
In conclusion, the present research identifies life satisfaction as a consistent buffering predictor of distress experienced at the early stage of the pandemic. Additionally, by controlling for life satisfaction, the results identified a number of sociodemographic risk factors for experiencing psychological distress, including being middle-aged, employed (relative to retired people/students), living in Ontario (rather than elsewhere), and a poor health status. Additionally, this study identified a number of pandemic-related risk factors for distress, including a higher self-contraction worry, more of a COVID-19 information authenticity concern, a higher future infection rate prediction, and a higher personal health hygiene appraisal.
These findings add to the existing literature by identifying relevant COVID-19-related predictors and specifically focusing on Chinese immigrant populations. Moreover, the study contributes meaningful cognitive and behavioural data at the earliest onset of a pandemic. As such, these findings offer significant insights that can inform more focused strategies for prevention and intervention practices, with the intention of alleviating stress and mental health repercussions in a minoritized population and better preparing them for future possible public health crises like a pandemic. For examples, in light of the findings from the current study, future practice and policies related to post-pandemic mental health prevention/intervention among minoritized population should target those in the middle-age (35–64 year old), employed (relative to retired people/students), or in poor health condition sub-groups because they are particularly vulnerable to COVID-related distress. Additionally, resources and practices should be directed to reduce the self-contraction worry, enhance information authenticity, mitigate risk prediction (e.g., infection rate), and increase awareness/knowledge of personal health hygiene because these factors are likely related to general psychological distress during the pandemic.
Author Contributions
Conceptualization, L.Y.; methodology, L.Y., K.K. and A.K.; validation, K.K.; formal analysis, K.K., A.K. and L.Y.; resources, A.K., K.K. and L.Y.; data curation, L.Y.; writing—original draft, A.K. and K.K; writing—review and editing, A.K., K.K. and L.Y.; visualization, K.K., A.K. and L.Y.; supervision, K.K. and L.Y.; project administration, L.Y.; funding acquisition, L.Y. All authors have read and agreed to the published version of the manuscript.
Funding
This work was funded by the New Frontiers Research Fund through the Canadian Institute of Health Research (CIHR) [NFRF-2019-00012] awarded to Lixia Yang (with Dr. Peizhong Wang).
Institutional Review Board Statement
The study was conducted according to the guidelines of the Declaration of Helsinki and approved by the Ryerson University [REB 2020-132] and Memorial University of Newfoundland [20201772-ME].
Informed Consent Statement
Informed consent was obtained from all subjects involved in the study.
Data Availability Statement
Acknowledgments
We would like to thank Helen Cao for their diligent support in participant recruitment and data collection. We also thank Peizhong Wang, Weiguo Zhang, and Xiaolin Wei for their contribution to their guidance during the survey building at the early stage of this project.
Conflicts of Interest
The authors declare no conflicts of interest.
References
- World Health Organization. 10 Global Health Issues to Track in 2021; World Health Organization: Geneva, Switzerland, 2020; Available online: https://www.who.int/news-room/spotlight/10-global-health-issues-to-track-in-2021 (accessed on 30 April 2021).
- Nwachukwu, I.; Nkire, N.; Shalaby, R.; Hrabok, M.; Vuong, W.; Gusnowski, A.; Surood, S.; Urichuk, L.; Greenshaw, A.J.; Agyapong, V.I. COVID-19 Pandemic: Age-related differences in measures of stress, anxiety and depression in Canada. Int. J. Environ. Res. Public Health 2020, 17, 6366. [Google Scholar] [CrossRef]
- Kowal, M.; Coll-Martín, T.; Ikizer, G.; Rasmussen, J.; Eichel, K.; Studzińska, A.; Koszałkowska, K.; Karwowski, M.; Najmussaqib, A.; Pankowski, D.; et al. Who is the Most Stressed During the COVID-19 Pandemic? Data From 26 Countries and Areas. Appl. Psychol. Health Wellbeing 2020, 12, 946–966. [Google Scholar] [CrossRef]
- Banerjee, D.; Vaishnav, M.; Rao, T.S.; Raju, V.K.; Dalal, P.; Javed, A.; Saha, G.; Mishra, K.K.; Kumar, V.; Jagiwala, M.P. Impact of the COVID-19 pandemic on psychosocial health and well-being in South-Asian (World Psychiatric Association zone 16) countries: A systematic and advocacy review from the Indian Psychiatric Society. Indian J. Psychiatry 2020, 62, 343. [Google Scholar] [CrossRef] [PubMed]
- Shah, S.M.A.; Mohammad, D.; Qureshi, M.F.H.; Abbas, M.Z.; Aleem, S. Prevalence, Psychological Responses and Associated Correlates of Depression, Anxiety and Stress in a Global Population, during the Coronavirus Disease (COVID-19) Pandemic. Community Ment. Health J. 2021, 57, 101–110. [Google Scholar] [CrossRef] [PubMed]
- Haft, S.L.; Zhou, Q. An Outbreak of Xenophobia: Perceived discrimination and anxiety in Chinese American college students before and during the COVID-19 pandemic. Int. J. Psychol. 2021, 56, 522–531. [Google Scholar] [CrossRef]
- Sorokowski, P.; Groyecka, A.; Kowal, M.; Sorokowska, A.; Białek, M.; Lebuda, I.; Dobrowolska, M.; Zdybek, P.; Karwowski, M. Can Information about Pandemics Increase Negative Attitudes Toward Foreign Groups?: A case of COVID-19 outbreak. Sustainability 2020, 12, 4912. [Google Scholar] [CrossRef]
- Wang, Y.; Kala, M.P.; Jafar, T.H. Factors associated with psychological distress during the coronavirus disease 2019 (COVID-19) pandemic on the predominantly general population: A systematic review and meta-analysis. PLoS ONE 2020, 15, e0244630. [Google Scholar] [CrossRef]
- Watson, M.F.; Bacigalupe, G.; Daneshpour, M.; Han, W.; Parra-Cardona, R. COVID-19 Interconnectedness: Health inequity, the climate crisis, and collective trauma. Fam. Process. 2020, 59, 832–846. [Google Scholar] [CrossRef]
- Yang, L.; Kandasamy, K.; Na, L.; Zhang, W.; Wang, P.P. Perceived and experienced anti-Chinese discrimination and its associated psychological impacts among Chinese Canadians during the Wave 2 of the COVID-19 pandemic. Psychol. Health Med. 2022, 29, 108–125. [Google Scholar] [CrossRef]
- Fawaz, M.; Samaha, A. COVID-19 Quarantine: Post-traumatic stress symptomatology among Lebanese citizens. Int. J. Soc. Psychiatry 2020, 66, 666–674. [Google Scholar] [CrossRef]
- Landi, G.; Pakenham, K.I.; Boccolini, G.; Grandi, S.; Tossani, E. Health Anxiety and Mental Health Outcome during COVID-19 Lockdown in Italy: The mediating and moderating roles of psychological flexibility. Front. Psychol. 2020, 11, 2195. [Google Scholar] [CrossRef]
- Ramírez, L.P.; Arriaga, R.J.; Hernández-Gonzalez, M.; Roca-Chiapas, J.M. Psychological Distress and Signs of Post-Traumatic Stress in Response to the COVID-19 Health Emergency in a Mexican Sample. Psychol. Res. Behav. Manag. 2020, 13, 589–597. [Google Scholar] [CrossRef]
- Traunmüller, C.; Stefitz, R.; Gaisbachgrabner, K.; Schwerdtfeger, A. Psychological Correlates of COVID-19 Pandemic in the Austrian Population. BMC Public Health 2020, 20, 1395. [Google Scholar] [CrossRef]
- Wang, C.; Pan, R.; Wan, X.; Tan, Y.; Xu, L.; McIntyre, R.S.; Choo, F.N.; Tran, B.; Ho, R.; Sharma, V.K.; et al. A Longitudinal Study on the Mental Health of General Population during the COVID-19 Epidemic in China. Brain Behav. Immun. 2020, 87, 40–48. [Google Scholar] [CrossRef]
- Filindassi, V.; Pedrini, C.; Sabadini, C.; Duradoni, M.; Guazzini, A. Impact of COVID-19 First Wave on Psychological and Psychosocial Dimensions: A Systematic Review. COVID 2022, 2, 273–340. [Google Scholar] [CrossRef]
- Thomson, M.S.; Chaze, F.; George, U.; Gurgue, S. Improving Immigrant Populations’ Access to Mental Health Services in Canada: A Review of Barriers and Recommendations. J. Immigr. Minor. Health 2015, 17, 1895–1905. [Google Scholar] [CrossRef] [PubMed]
- Yu, S.; Kowitt, S.D.; Fisher, E.B.; Li, G. Mental Health in China: Stigma, family obligations, and the potential of peer support. Community Ment. Health J. 2017, 54, 757–764. [Google Scholar] [CrossRef]
- Heidinger, L.; Cotter, A. Perceptions of Personal Safety Among Population Groups Designated as Visible Minorities in Canada during the COVID-19 Pandemic. 2020. Available online: https://www150.statcan.gc.ca/n1/pub/45-28-0001/2020001/article/00046-eng.htm (accessed on 30 April 2021).
- The Social and Economic Impacts of COVID-19: A Six-Month Update—ARCHIVED. (n.d.). Available online: https://www150.statcan.gc.ca/n1/pub/11-631-x/11-631-x2020004-eng.pdf (accessed on 22 February 2021).
- Lecompte, M.; Counsell, A.; Yang, L. Demographic and COVID experience predictors of COVID-19 risk perception among Chinese residents in Canada. Int. J. Environ. Res. Public Health 2022, 19, 14448. [Google Scholar] [CrossRef] [PubMed]
- Lee, A.D.Y.; Wang, P.P.; Zhang, W.; Yang, L. COVID-19 Peritraumatic Distress and Loneliness in Chinese Residents in North America: The Role of Contraction Worry. Int. J. Environ. Res. Public Health 2022, 19, 7639. [Google Scholar] [CrossRef] [PubMed]
- Yang, L.; Yu, L.; Kandasamy, K.; Wang, Y.; Shi, F.; Zhang, W.; Wang, P.P. Non-pathological psychological distress among Mainland Chinese in Canada and its sociodemographic risk factors amidst the pandemic. HealthCare 2022, 10, 2326. [Google Scholar] [CrossRef] [PubMed]
- Yu, L.; Lecompte, M.; Zhang, W.; Wang, P.; Yang, L. Sociodemographic and COVID-Related Predictors for Mental Health Condition of Mainland Chinese in Canada Amidst the Pandemic. Int. J. Environ. Res. Public Health 2022, 19, 171. [Google Scholar] [CrossRef]
- Forte, G.; Favieri, F.; Tambelli, R.; Casagrande, M. COVID-19 Pandemic in the Italian Population: Validation of a post-traumatic stress disorder questionnaire and prevalence of PTSD symptomatology. Int. J. Environ. Res. Public Health 2020, 17, 4151. [Google Scholar] [CrossRef]
- Carpenter, T.; Grecian, S.M.; Reynolds, R.M. Sex differences in early-life programming of the hypothalamic–pituitary–adrenal axis in humans suggest increased vulnerability in females: A systematic review. J. Dev. Orig. Health Dis. 2017, 8, 244–255. [Google Scholar] [CrossRef] [PubMed]
- Catuzzi, J.E.; Kevin, D.B. Anxiety Vulnerability in Women: A two-hit hypothesis. Exp. Neurol. 2014, 259, 75–80. [Google Scholar] [CrossRef] [PubMed]
- Kim, H.-K. Analyzing the Gender Division of Labor: The Cases of the United States and South Korea. Asian Perspect. 2009, 33, 181–229. [Google Scholar] [CrossRef]
- Na, L.; Yang, L.; Mezo, P.G.; Liu, R. Age disparities in mental health during the COVID19 pandemic: The roles of resilience and coping. Soc. Sci. Med. 2022, 305, 115031. [Google Scholar] [CrossRef] [PubMed]
- Gao, J.; Zheng, P.; Jia, Y.; Chen, H.; Mao, Y.; Chen, S.; Wang, Y.; Fu, H.; Dai, J. Mental health problems and social media exposure during COVID-19 outbreak. PLoS ONE 2020, 15, e0231924. [Google Scholar]
- Qiu, J.; Shen, B.; Zhao, M.; Wang, Z.; Xie, B.; Xu, Y. A Nationwide Survey of Psychological Distress Among Chinese People in the COVID-19 Epidemic: Implications and policy recommendations. Gen. Psychiatry 2020, 33, e100213. [Google Scholar] [CrossRef] [PubMed]
- Limcaco, R.S.G.; Mateos, M.E.; Fernandez, M.J.; Roncero, C. Anxiety, Worry, and Perceived Stress in the World Due to the COVID-19 Pandemic. medRxiv 2020. [Google Scholar] [CrossRef]
- Farquharson, W.H.; Thornton, C.J. Debate: Exposing the most serious infirmity–Racism’s impact on health in the era of COVID-19. Child. Adolesc. Ment. Health 2020, 25, 182–183. [Google Scholar] [CrossRef]
- Rudenstine, S.; McNeal, K.; Schulder, T.; Ettman, C.K.; Hernandez, M.; Gvozdieva, K.; Galea, S. Depression and Anxiety during the COVID-19 Pandemicc in an Urba, Low-Income Public University Sample. J. Trauma. Stress 2021, 34, 12–22. [Google Scholar] [CrossRef] [PubMed]
- Daly, Z.; Slemon, A.; Richardson, C.G.; Salway, T.; McAuliffe, C.; Gadermann, A.M.; Thomson, K.C.; Hirani, S.; Jenkins, E.K. Associations between periods of COVID-19 quarantine and mental health in Canada. Psychiatry Res. 2021, 295, 113631. [Google Scholar] [CrossRef] [PubMed]
- Leung, G.M.; Lam, T.H.; Ho, L.M.; Ho, S.Y.; Chan, B.H.; Wong, I.O.; Hedley, A.J. The Impact of Community Psychological Responses on Outbreak Control for Severe Acute Respiratory Syndrome in Hong Kong. J. Epidemiol. Community Health 2003, 57, 857–863. [Google Scholar] [CrossRef]
- Dong, L.; Katsiris, A.; Lecompte, M.; Skrotzki, C.; Yang, L. A Qualitative Analysis of Older Adults’ Cognitive Appraisal in Coping during the COVID-19 Pandemic: The Role of Social Capital. COVID 2023, 3, 1622–1638. [Google Scholar] [CrossRef]
- Eichelberger, L. SARS and New York’s Chinatown: The politics of risk and blame during an epidemic of fear. Soc. Sci. Med. 2007, 65, 1284–1295. [Google Scholar] [CrossRef]
- Kong, J.; Ip, J.; Huang, C.; Lin, K.; Lin, F.; Yuen, C. A Year of Racist Attacks: Anti-Asian Racism across Canada One Year into the COVID-19 Pandemic. 2020. Available online: https://immigrantcovid.umn.edu/anti-asian-xenophobia (accessed on 30 April 2021).
- Carver, C.S. You want to measure coping but your protocol’s too long: Consider the brief COPE. Int. J. Behav. Med. 1997, 4, 92–100. [Google Scholar] [CrossRef]
- Vagni, M.; Maiorano, T.; Giostra, V.; Pajardi, D. Coping With COVID-19: Emergency Stress, Secondary Trauma and Self-Efficacy in Healthcare and Emergency Workers in Italy. Front. Psychol. 2020, 11, 566912. [Google Scholar] [CrossRef] [PubMed]
- Vagni, M.; Maiorano, T.; Giostra, V.; Pajardi, D.; Bartone, P. Emergency Stress, Hardiness, Coping Strategies and Burnout in Health Care and Emergency Response Workers during the COVID-19 Pandemic. Front. Psychol. 2022, 13, 918788. [Google Scholar] [CrossRef]
- Xiao, H.; Zhang, Y.; Kong, D.; Li, S.; Yang, N. The Effects of Social Support on Sleep Quality of Medical Staff Treating Patients with Coronavirus Disease 2019 (COVID-19) in January and February 2020 in China. Med. Sci. Monit. Int. Med. J. Exp. Clin. Res. 2020, 26, e923549. [Google Scholar] [CrossRef]
- Badon, S.E.; Croen, L.A.; Ferrara, A.; Ames, J.L.; Hedderson, M.M.; Young-Wolff, K.C.; Zhu, Y.; Avalos, L.A. Coping strategies for COVID-19 pandemic-related stress and mental health during pregnancy. J. Affect. Disord. 2022, 309, 309–313. [Google Scholar] [CrossRef]
- Diener, E.; Emmons, R.A.; Larsen, R.J.; Griffin, S. The satisfaction with life scale. J. Personal. Assess. 1985, 49, 71–75. [Google Scholar] [CrossRef]
- Dymecka, J.; Gerymski, R.; Machnik-Czerwik, A.; Derbis, R.; Bidzan, M. Fear of COVID-19 and Life Satisfaction: The Role of the Health-Related Hardiness and Sense of Coherence. Front. Psychiatry 2021, 12, 712103. [Google Scholar] [CrossRef]
- Martins, V.; Serrão, C.; Teixeira, A.; Castro, L.; Duarte, I. The mediating role of life satisfaction in the relationship between depression, anxiety, stress and burnout among Portuguese nurses during COVID-19 pandemic. BMC Nurs. 2022, 21, 188. [Google Scholar] [CrossRef] [PubMed]
- Padmanabhanunni, A.; Pretorius, T.B.; Isaacs, S.A. Satisfied with Life? The Protective Function of Life Satisfaction in the Relationship between Perceived Stress and Negative Mental Health Outcomes. Int. J. Environ. Res. Public Health 2023, 20, 6777. [Google Scholar] [CrossRef] [PubMed]
- Breslau, J.; Finucane, M.L.; Locker, A.R.; Baird, M.D.; Roth, E.A.; Collins, R.L. A longitudinal study of psychological distress in the United States before and during the COVID-19 pandemic. Prev. Med. 2021, 143, 106362. [Google Scholar] [CrossRef] [PubMed]
- Thomala, L.L. China: Most Popular Social Media Platforms 2019. 2020. Available online: https://www.statista.com/statistics/250546/leading-social-network-sites-in-china/ (accessed on 13 December 2020).
- Qian, M.; Wu, Q.; Wu, P.; Hou, Z.; Liang, Y.; Cowling, B.J.; Yu, H. Psychological responses, behavioral changes and public perceptions during the early phase of the COVID-190 outbreak in China: A population based cross-sectional survey. medRxiv 2020. [Google Scholar] [CrossRef]
- Chandu, V.C.; Marella, Y.; Panga, G.S.; Pachava, S.; Vadapalli, V. Measuring the Impact of COVID-19 on Mental Health: A scoping review of the existing scales. Indian J. Psychol. Med. 2020, 42, 421–427. [Google Scholar] [CrossRef]
- Steyerberg, E.W. Clinical Prediction Models A Practical Approach to Development, Validation, and Updating; Springer International Publishing: Cham, Switzerland, 2019; ISBN 3-030-16399-7. [Google Scholar]
- Einav, M.; Margalit, M. Loneliness before and after COVID-19: Sense of Coherence and Hope as Coping Mechanisms. Int. J. Environ. Res. Public Health 2023, 20, 5840. [Google Scholar] [CrossRef]
- Vlake, J.H.; Wesselius, S.; van Genderen, M.E.; van Bommel, J.; Boxma-de Klerk, B.; Wils, E.J. Psychological distress and health-related quality of life in patients after hospitalization during the COVID-19 pandemic: A single-center, observational study. PLoS ONE 2021, 16, e0255774. [Google Scholar] [CrossRef]
- Lewis, B.A.; Billing, L.; Schuver, K.; Gjerdingen, D.; Avery, M.; Marcus, B.H. The relationship between employment status and depression symptomatology among women at risk for postpartum depression. Women’s Health 2017, 13, 3–9. [Google Scholar] [CrossRef]
- Breslau, J.; Roth, E.A.; Baird, M.D.; Carman, K.G.; Collins, R.L. A longitudinal study of predictors of serious psychological distress during COVID-19 pandemic. Psychol. Med. 2023, 53, 2418–2426. [Google Scholar] [CrossRef] [PubMed]
- Zaccari, V.; D’Arienzo, M.C.; Caiazzo, T.; Magno, A.; Amico, G.; Mancini, F. Narrative review of COVID-19 impact on obsessive-compulsive disorder in child, adolescent and adult clinical populations. Front. Psychiatry 2021, 12, 673161. [Google Scholar] [CrossRef] [PubMed]
- Audet, J.S.; Jacmin-Park, S.; Kheloui, S.; Gravel, C.; Juster, R.P.; Aardema, F. COVID-19 related stress and fears of contamination: The impact of feared self-perceptions. Curr. Psychol. 2023; advance online publication. [Google Scholar] [CrossRef] [PubMed]
- Paredes, M.R.; Apaolaza, V.; Fernandez-Robin, C.; Hartmann, P.; Yañez-Martinez, D. The impact of the COVID-19 pandemic on subjective mental well-being: The interplay of perceived threat, future anxiety and resilience. Personal. Individ. Differ. 2021, 170, 110455. [Google Scholar] [CrossRef]
- Yue, Z.; Zhang, R.; Xiao, J. Passive social media use and psychological well-being during the COVID-19 pandemic: The role of social comparison and emotion regulation. Comput. Hum. Behav. 2022, 127, 107050. [Google Scholar] [CrossRef]
Figure 1.
Sample selection procedure (n = 457).
Figure 1.
Sample selection procedure (n = 457).
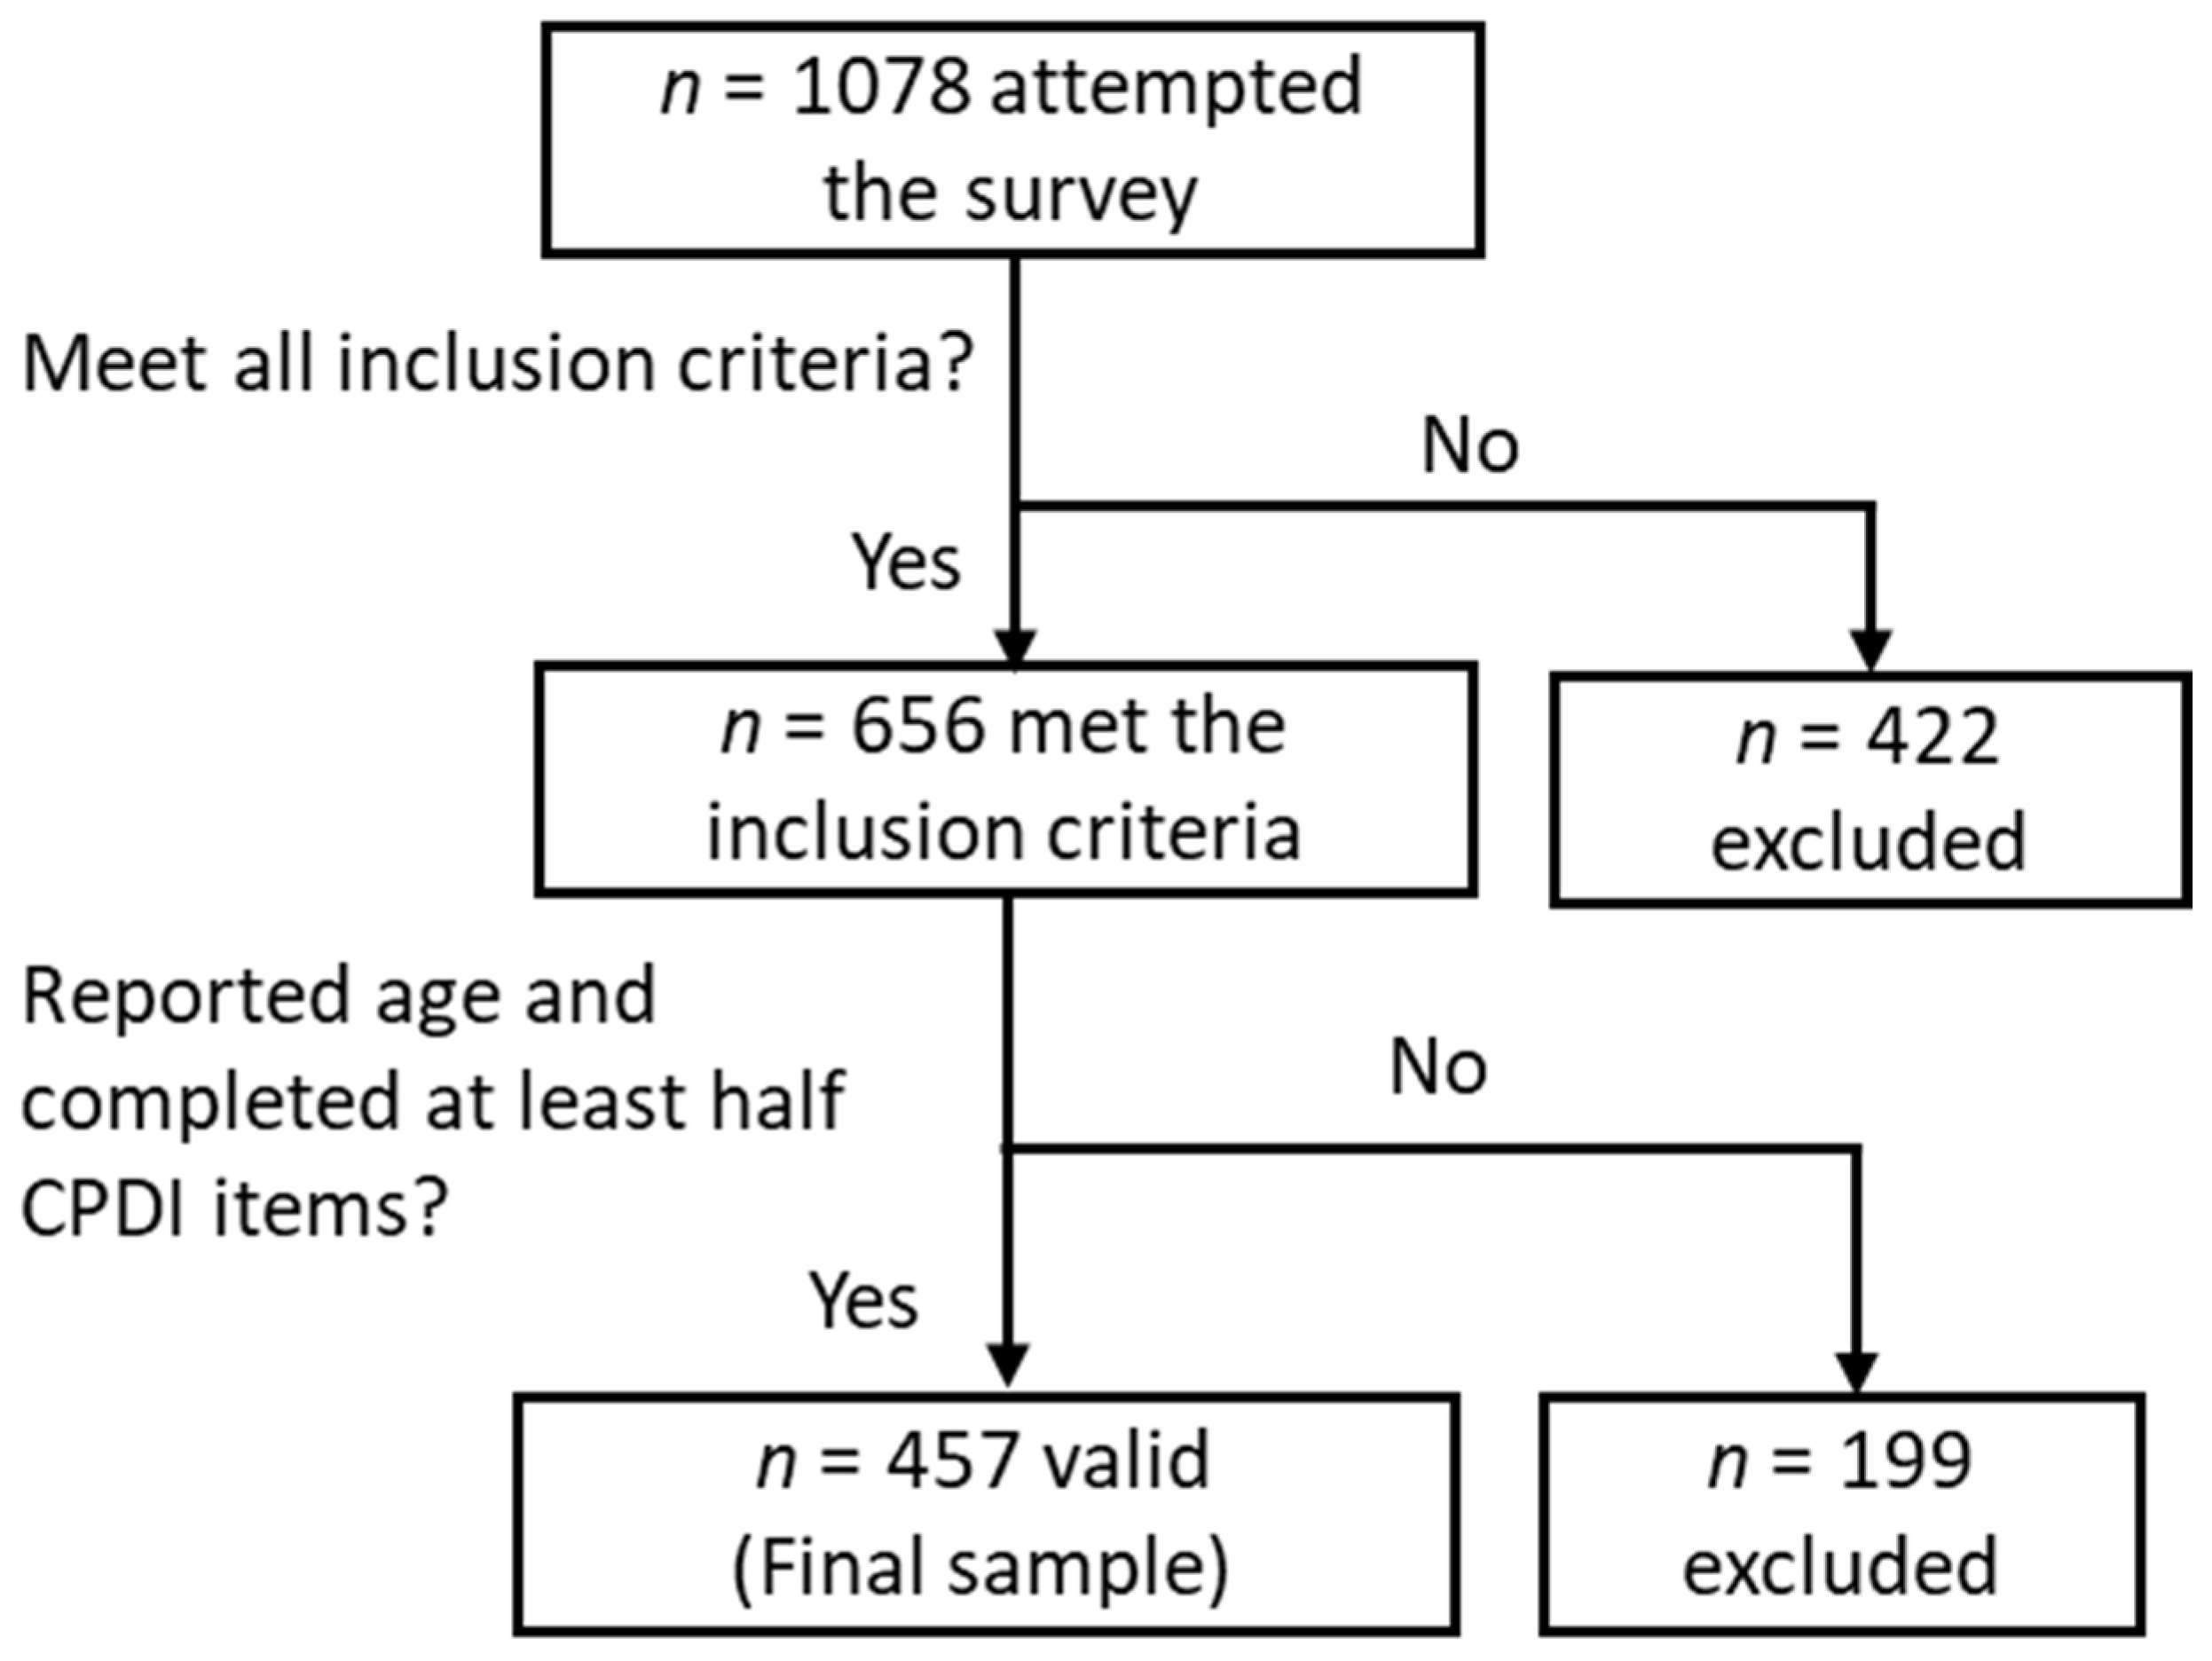
Table 1.
Sample characteristics and their group differences in CPDI (n = 457).
Table 1.
Sample characteristics and their group differences in CPDI (n = 457).
| Variables | n (%) | CPDI | |||
|---|---|---|---|---|---|
| M (SD) | F | p | |||
| Age group | <35 | 43 (9.41) | 21.53 (11.29) | 3.46 | 0.032 |
| 35–64 | 361 (78.99) | 26.80 (14.33) | |||
| ≥65 | 53 (11.60) | 20.83 (11.51) | |||
| Sex | Female | 330 (72.21) | 26.50 (14.09) | 1.00 | 0.319 |
| Male | 123 (26.91) | 23.40 (13.43) | |||
| Years in Canada | 0–5 years | 70 (15.32) | 23.80 (13.22) | 1.00 | 0.368 |
| 6–15 years | 159 (34.79) | 27.21 (14.96) | |||
| >15 years | 225 (49.23) | 25.19 (13.37) | |||
| Marital status | Married/Partnered | 378 (82.71) | 25.63 (13.71) | 0.06 | 0.803 |
| Other | 79 (17.29) | 25.52 (15.08) | |||
| Education | College and under | 108 (23.63) | 28.26 (15.06) | 3.62 | 0.058 |
| University and above | 348 (76.15) | 24.85 (13.47) | |||
| Employment status | Employed | 209 (45.73) | 26.51 (14.18) | 2.87 | 0.036 |
| Self-employed | 90 (19.69) | 24.79 (12.29) | |||
| Retired/Student | 92 (20.13) | 21.64 (12.58) | |||
| Unemployed/Other | 66 (14.44) | 29.42 (15.87) | |||
| Housing type | Owed | 361 (78.99) | 25.73 (14.10) | 1.70 | 0.193 |
| Other | 96 (21.01) | 25.17 (13.39) | |||
| Housing size | 1–2 people | 119 (26.04) | 25.35 (14.98) | 3.05 | 0.048 |
| 3–4 people | 248 (54.27) | 26.80 (13.50) | |||
| 5 or more people | 83 (18.16) | 22.68 (13.64) | |||
| Region | Ontario | 373 (81.62) | 26.35 (13.98) | 8.28 | 0.004 |
| Other provinces | 84 (18.38) | 22.33 (13.39) | |||
| Religion | No | 246 (53.83) | 26.14 (14.48) | 2.47 | 0.086 |
| Christianity/Catholicism | 131 (28.67) | 24.24 (11.75) | |||
| Other | 80 (17.51) | 26.20 (15.52) | |||
| Coping behaviour endorsement | Exercise (Yes/No) | 300 (65.65)/157 (34.35) | 24.31 (12.87)/28.09 (15.54) | 2.65 | 0.104 |
| Reading (Yes/No) | 243 (53.17)/214 (46.83) | 24.20 (12.92)/27.21 (14.89) | 4.49 | 0.035 | |
| Lis. music (Yes/No) | 230 (50.33)/227 (49.67) | 24.56 (13.98)/26.67 (13.86) | 0.01 | 0.931 | |
| Drinking tea (Yes/No) | 119 (26.04)/338 (73.96) | 25.22 (13.47)/25.75 (14.12) | 0.42 | 0.519 | |
| Chatting (Yes/No) | 249 (54.49)/208 (45.51) | 24.67 (13.04)/26.73 (14.91) | 0.29 | 0.593 | |
| Music Coping | Class. music (Yes/No) | 196 (42.89)/261 (57.11) | 24.87 (13.36)/26.17 (14.37) | 0.39 | 0.532 |
| Nature music (Yes/No) | 238 (52.08)/219 (47.92) | 25.90 (13.62)/25.29 (14.32) | 0.16 | 0.691 | |
| Pop music (Yes/No) | 158 (34.57)/299 (65.43) | 23.87 (13.32)/26.53 (14.20) | 2.06 | 0.152 | |
| Relig. music (Yes/No) | 100 (21.88)/357 (78.12) | 25.07 (14.32)/23.68 (13.62) | 0.07 | 0.792 | |
| Love song (Yes/No) | 96 (21.01)/361 (78.99) | 23.68 (13.63)/26.12 (14.00) | 1.98 | 0.160 | |
Table 2.
Linear regression of the sociodemographic predictors of the CPDI (n = 448).
Table 2.
Linear regression of the sociodemographic predictors of the CPDI (n = 448).
| Step | Predictors | CPDI | ||||
|---|---|---|---|---|---|---|
| β | 95% CI | R2 | F | |||
| 1 | SWLS | −1.21 *** | −1.40, −1.02 | 0.28 | 33.89 *** | |
| Coping: Exercise | Yes (reference) No/missing |
1.27 | −1.13, 3.66 | |||
| Coping: Reading | Yes (reference) No/missing |
1.05 | −1.21, 3.32 | |||
| Coping: Pop music | Yes (reference) No/missing |
2.24 | −0.12, 4.60 | |||
| Coping: Love song | Yes (reference) No/missing |
0.76 | −1.98, 3.51 | |||
| 2 | SWLS | −0.49 *** | −0.71, −0.27 | 0.45 | 18.58 *** | |
| Coping: Exercise | Yes (reference) No/missing |
0.30 | −1.88, 2.47 | |||
| Coping: Reading | Yes (reference) No/missing |
1.24 | −0.83, 3.30 | |||
| Coping: Pop music | Yes (reference) No/missing |
0.76 | −1.39, 2.91 | |||
| Coping: Love song | Yes (reference) No/missing |
−0.06 | −2.53, 2.42 | |||
| Age group | <35 (reference) | |||||
| 35–64 | 4.19 * | 0.40, 7.98 | ||||
| ≥65 | 2.20 | −2.96, 7.35 | ||||
| Education | College/under (reference) | |||||
| University and above | −1.67 | −4.23, 0.89 | ||||
| Employment | Employed (reference) | |||||
| status | Self-employed | −2.03 | −4.73, 0.67 | |||
| Retired/student | −4.68 * | −8.41, −0.96 | ||||
| Unemployed/other | −0.21 | −3.33, 2.91 | ||||
| Housing type | Owed (reference) | |||||
| Other | 1.55 | −1.20, 4.30 | ||||
| Housing size | 1–2 people (reference) | |||||
| 3–4 people | 0.21 | −2.28, 2.70 | ||||
| 5 or more people | −2.93 | −6.04, 0.18 | ||||
| Region | Ontario (reference) | |||||
| Other provinces | −3.02 * | −5.76, −0.29 | ||||
| Religion | No (reference) | |||||
| Christianity/Catholicism | −2.06 | −4.41, 0.30 | ||||
| Other | −1.15 | −4.02, 1.72 | ||||
| Family income | 1 = lowest, 5 = highest | 0.37 | −0.73, 1.47 | |||
| Health status | 1 = very poor, 5 = very good | −7.95 ** | −9.59, −6.32 | |||
Table 3.
COVID-related group differences in the CPDI (N = 457).
Table 3.
COVID-related group differences in the CPDI (N = 457).
| Variables | N (%) | CPDI | |||
|---|---|---|---|---|---|
| M (SD) | F | p | |||
| COVID-19 Experience | Infection/exposure status Yes No/missing |
43 (9.41) 414 (90.59) |
29.09 (15.81) 25.25 (13.71) |
3.50 | 0.062 |
| Action status Yes No/missing |
54 (11.82) 403 (88.18) |
22.62 (12.05) 26.01 (14.14) |
3.52 | 0.061 | |
| COVID-19 Behaviour | Avoidance behaviour Yes No/missing |
451 (98.69) 6 (1.31) |
25.73 (13.94) 16.53 (11.90) |
1.98 | 0.160 |
| Endorsement behaviour Yes No/missing |
448 (98.03) 9 (1.97) |
25.72 (13.97) 20.02 (11.89) |
0.23 | 0.629 | |
Table 4.
Correlations between continuous predictors and the CPDI.
Table 4.
Correlations between continuous predictors and the CPDI.
| Variables | M (SD) | CPDI | ||
|---|---|---|---|---|
| r | p (2-Tailed) | |||
| Sociodemographic | ||||
| Family income | 1 = lowest, 5 = highest | 2.94 (1.02) | −0.104 | 0.027 |
| Health status | 1 = very poor, 5 = very good | 3.58 (0.80) | −0.618 | 0.000 |
| COVID-19 Cognition | ||||
| Infection likeliness | 1 = lowest, 5 = highest | 3.11 (0.90) | 0.194 | 0.000 |
| Self-contraction worry | 1 = lowest, 5 = highest | 3.50 (1.04) | 0.423 | 0.000 |
| Family-contraction worry | 1 = lowest, 5 = highest | 3.83 (1.03) | 0.341 | 0.000 |
| Information authenticity concern | 1 = lowest, 5 = highest | 2.95 (0.95) | 0.263 | 0.000 |
| Canada measure attitude | 1 = very positive, 5 = very negative | 2.51 (1.18) | 0.189 | 0.000 |
| Threat perception | 1 = lowest, 5 = highest | 4.21 (0.80) | 0.255 | 0.000 |
| Discrimination perception | 1 = lowest, 5 = highest | 3.54 (0.97) | 0.299 | 0.000 |
| Future infection prediction | 0–100% | 19.86 (16.38) | 0.220 | 0.000 |
| Personal behavioural measure perception | 1 = completely ineffective, 5 = completely effective |
4.05 (0.57) | 0.061 | 0.195 |
| Personal health hygiene perception | 1 = completely ineffective, 5 = completely effective |
3.36 (0.95) | 0.137 | 0.004 |
| Public measure Support | 1 = firmly oppose, 5 = firmly support | 4.42 (0.54) | −0.022 | 0.637 |
| Moderators | ||||
| SWLS | 1 = strongly disagree, 7 = strongly agree | 24.73 (5.79) | −0.515 | 0.000 |
|
Disclaimer/Publisher’s Note: The statements, opinions and data contained in all publications are solely those of the individual author(s) and contributor(s) and not of MDPI and/or the editor(s). MDPI and/or the editor(s) disclaim responsibility for any injury to people or property resulting from any ideas, methods, instructions or products referred to in the content. |
[ad_2]