Electron precipitation caused by intense whistler-mode waves: combined effects of anomalous scattering and phase bunching
1 Introduction
Electron precipitation into the Earth’s upper atmosphere is a crucial process for the loss of energetic electrons in the radiation belts. Resonant interactions with whistler-mode waves play a significant role in scattering electron pitch angles into the loss cone, resulting in efficient electron precipitation. For instance, the short and intense electron precipitation events, known as microbursts, are widely attributed to be driven by whistler-mode chorus waves (Breneman et al., 2017; Miyoshi et al., 2020; Chen et al., 2022). These waves contribute to the depletion of the outer radiation belt (e.g., Blake et al., 1996; O’Brien et al., 2004; Thorne et al., 2005). Specifically, ∼1 MeV (mega-electron-volt) electrons can be precipitated through interactions with ducted chorus waves at high magnetic latitudes (Chen et al., 2022), while sub-MeV electrons are subject to resonances with chorus waves at moderate magnetic latitudes (Douma et al., 2018; Shumko et al., 2018; Zhang et al., 2022a).
Quasilinear theory, which assumes diffusive resonant interactions between electrons and whistler-mode waves (Kennel and Engelmann, 1966; Lyons, 1974), is commonly employed in modeling interactions between electrons and whistler-mode waves. It has been successful in simulating long-term energetic electron dynamics associated with whistler-mode waves (e.g., Horne et al., 2005; Albert et al., 2009; Thorne et al., 2013; Li et al., 2014; Ma et al., 2018). However, recent observations have revealed that whistler-mode waves can often possess sufficient intensity to drive nonlinear interactions with energetic electrons (Zhang et al., 2018; Zhang et al., 2019). Comparisons between numerical and observational results have also shown that quasilinear theory (Kennel and Engelmann, 1966) alone is inadequate to explain the intense electron precipitation observed at both low Earth orbit (Mozer et al., 2018) and in the near-equatorial region (Shumko et al., 2018). Hence, it is believed that nonlinear interactions between electrons and whistler-mode waves play a significant role in these processes.
Nonlinear interactions between electrons and whistler-mode waves typically involve two main mechanisms: nonlinear phase trapping and phase bunching (Bortnik et al., 2008). In the case of phase trapping, electrons become trapped in resonance with whistler-mode waves and are rapidly accelerated to higher energies and larger pitch angles (Albert, 2000; Omura et al., 2007; Artemyev et al., 2014; Vainchtein et al., 2018). On the other hand, phase bunching scatters electrons to lower energies and smaller pitch angles (Albert, 1993; Artemyev et al., 2018), which is believed to drive the intense electron precipitation. Recent studies have also highlighted additional nonlinear effects, namely anomalous trapping (Kitahara and Katoh, 2019) and positive bunching (Gan et al., 2020).
Both anomalous trapping and positive bunching occur for electrons with small equatorial pitch angles. Anomalous trapping can efficiently accelerate electrons to higher energies and pitch angles, similar to standard phase trapping. However, electrons “anomalously” trapped at small pitch angles exhibit a much larger ratio of trapped electrons compared to the entire electron population, as compared to phase trapping. Positive bunching electrons, on the other hand, undergo the process similar to phase bunching but in the opposite direction. While phase bunching always decreases electron pitch angle and energy, positive bunching increases the pitch angles and energies of electrons with small pitch angles. The theoretical analysis of these two processes was conducted in earlier studies by Neishtadt (1975) and Henrard and Lemaitre (1983), as well as a more recent study by Bellan (2013), by utilizing the Hamiltonian approach. Building upon these previous studies, Albert et al. (2021) and Artemyev et al. (2021a) discussed the anomalous trapping process specifically in the context of interactions between electrons and whistler-mode waves, providing theoretical criteria for the occurrence of anomalous trapping. Later in this paper, these criteria are examined in detail and compared to numerical results.
Previously, it was believed that intense electron precipitation events were associated with nonlinear interactions. However, electrons near the loss cone experience anomalous trapping and positive bunching, collectively referred to as anomalous scattering (AS) from now on. Anomalous scattering always increases electron pitch angles, which reduces precipitation. Conversely, phase bunching can transport electrons non-locally into the loss cone in phase space, thereby increasing precipitation. The combined effects of anomalous scattering and phase bunching on electron precipitation represent a key question in understanding nonlinear electron precipitation caused by whistler-mode waves, which remains unanswered. Anomalous scattering can also occur when electrons interact with electromagnetic ion cyclotron (EMIC) waves. Grach and Demekhov. (2020) showed that nonlinear interactions with parallel and intense EMIC waves lead to a higher level of loss cone filling near the minimum resonance energy. Bortnik et al. (2022) specifically discussed the effects of anomalous scattering, referred to as force bunching, and concluded that force bunching could potentially block electron precipitation caused by EMIC waves. Subsequently, Grach et al. (2022) and Hanzelka et al. (2023) evaluated the effects of force bunching on the precipitation phase space density (PSD) and demonstrated that force bunching does not reduce the precipitation PSD. This is because the electrons scattered outward are balanced by the inward transport of electrons within the loss cone.
In this paper, we address the question of the combined effects of anomalous scattering and phase bunching by parallel whistler-mode waves. Such effects have been discussed for EMIC waves, as introduced above, but not for the case of whistler-mode waves. We use test particle simulations to numerically evaluate the nonlinear interactions. Quasilinear theory and nonlinear Hamiltonian approaches are also compared to numerical results. Section 2 describes the numerical methodology including test particle and quasilinear methods. Section 3 describes the main results of this paper. Section 4 discusses the implications of our results and summarizes the main conclusions.
2 Methodology
2.1 Test particle simulation
This paper uses the test particle simulations to model the interactions between electrons and whistler-mode waves, following the method of Gan et al. (2020). In this study, a 1-D dipole geometry is employed for the background magnetic field, with the equatorial field intensity equivalent to that at L = 6. The cold electron density follows an empirical density model,
Initial electron equatorial pitch angle ranges from
Here,
2.2 Quasilinear theory and quasi-equilibrium state (QES) of electron precipitation
Test particle simulation results are quantitatively compared to quasilinear results. Quasilinear diffusion coefficients are calculated based on Ma et al. (2018), using the same background and wave parameters, as described in Section 2.1. Electron PSD distribution near the loss cone at the quasi-equilibrium state is calculated following Kennel and Petschek (1966):
Here
Here,
2.3 Identification of phase trapping electrons
To quantify the contribution of different nonlinear processes, we identify the electrons that are phase trapped or anomalously trapped during simulations of half bounce-period. The key characteristic of nonlinearly trapped electrons is that they stay in resonance with whistler-mode waves for an extensive amount of time. The resonance is identified by calculating the relative phase speed
3 Results
3.1 Electron precipitation in nonlinear regime
Figure 1 illustrates the typical trajectories of electrons interacting with intense whistler-mode waves of 1 nT, which represents typical nonlinear interactions. In Figures 1A, B, 360 electrons initially with an energy of 50 keV and an equatorial pitch angle of 10° move from the mirror point to the equator. All of these electrons experience anomalous trapping, leading to a significant increase in their pitch angles and energies. In this particular case, none of the electrons are precipitated, but their pitch angles increase due to the nonlinear interactions. Electrons with the same energy, but smaller pitch angles also undergo anomalous trapping, preventing any electrons close to the loss cone from being precipitated in the typical nonlinear regime. For electrons with the same energy (50 keV) but slightly larger pitch angles (13.5°), the probability of anomalous trapping decreases, as shown in Figures 1C, D. The non-trapping electrons experience positive bunching (Gan et al., 2020), which also leads to an increase in their pitch angles. Consequently, all electrons in this scenario are further affected by the anomalous scattering, resulting in no precipitation. When the pitch angles are even higher (18°), electrons exhibit the typical nonlinear phase trapping and phase bunching features. Figures 1E, F demonstrate that phase trapping increases the electron pitch angle and energy, while phase bunching decreases them. In this case, phase bunching scatters electrons into the loss cone, driving precipitation. The typical nonlinear interactions depicted in Figure 1 indicate that electron precipitation in the nonlinear regime is primarily driven by phase bunching, which only occurs when the equatorial pitch angle is sufficiently large, surpassing the pitch angle range considered in the quasilinear theory.
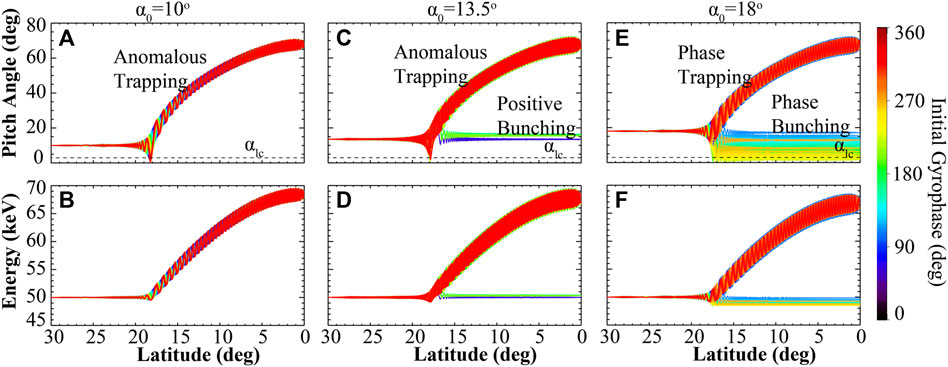
FIGURE 1. Typical interactions between electrons (
To assess the combined effects of various nonlinear processes on electron precipitation, we conducted three sets of test particle simulations lasting for 20 s each. These simulations employed three different wave amplitudes: 50 pT, 200 pT, and 1 nT. All models shared the same initial PSD distribution, described by Eqs 1 2 and displayed in Figure 2A. The PSD evolution of the precipitating electrons is illustrated in Figure 2B (Nunn and Omura, 2015), with colors representing different energies. Dashed, dotted, and solid lines correspond to wave amplitudes of 50 pT, 200 pT, and 1 nT, respectively. A common characteristic observed in all models and energy ranges is the significant variability of precipitating electron PSD during the initial few seconds of the simulations. However, it tends to stabilize within 20 s, indicating the quasi-equilibrium state. In this state, the overall shapes of the electron PSD distributions in pitch angle and energy change slowly and can be considered stable. This paper will primarily focus on discussing the QES derived from the test particle simulations and comparing it to the results obtained from the quasilinear approach. It is important to note that the precipitation PSD in the QES is lower than that observed within the first 1–2 s. Consequently, some of the conclusions drawn from the QES may not be applicable to events observed on timescales shorter than approximately 1 s, such as microbursts (Zhang et al., 2022b).
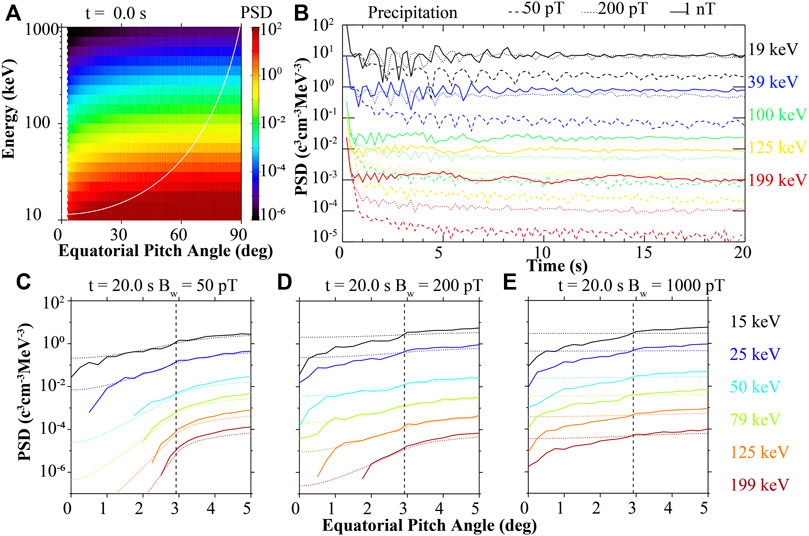
FIGURE 2. The PSD evolution of the precipitating electrons driven by whistler-mode waves with different wave amplitudes. (A) Initial PSD distribution in equatorial pitch angle-energy space. The vertical black dashed line marks the loss cone. The white solid line marks the minimum resonant energy. (B) Precipitation PSD variation versus time, color coded for different energies. Dashed, dotted, and solid lines represent the model results using whistler-mode amplitude of 50 pT, 200 pT, and 1 nT, respectively. (C–E) Pitch angle distribution of electron PSD near the loss cone after 20 s of simulations using wave amplitude of 50 pT, 200 pT, and 1 nT, respectively, color coded for different energies. The loss cone is marked by the vertical dashed lines. The dotted lines are the results calculated with quasilinear methods.
Based on the evolution of the precipitation PSD presented in Figure 2B, we extracted a snapshot of the electron PSD at a simulation time of 20 s and compared it to the expected QES based on the calculations from quasilinear theory (Eqs 3, 4). The results are displayed in Figures 2C, D, E for wave amplitudes of 50 pT, 200 pT, and 1 nT, respectively, with colors indicating different energy levels. The corresponding dotted lines represent the quasilinear results. As depicted in Figure 2C, for a wave amplitude of 50 pT, the test particle results align well with the quasilinear results, except for deep within the loss cone at low energies. The lack of electrons deep within the loss cone is attributed to the method used for setting the atmosphere boundary in test particle simulations, which does not include any backscattering processes. This demonstrates the applicability of quasilinear models when the wave amplitude is not sufficiently intense to induce nonlinear interactions. For an amplitude of 200 pT, the test particle results match the quasilinear predictions for energies above approximately 50 keV. However, at lower energies, the test particle PSD is lower than the quasilinear results within the loss cone. Additionally, the test particle results exhibit a similar shape in the PSD distribution within the loss cone. For a wave amplitude of 1 nT, similar PSD distributions are observed for all energy levels, and they are consistently smaller than the quasilinear expectations. The outcomes depicted in Figures 2D, E highlight that nonlinear interactions generate comparable PSD pitch angle distributions for different energy levels within the loss cone, all of which are lower than the quasilinear expectations. The specific nonlinear processes driving these observed features are analyzed in Section 3.2.
3.2 Nonlinear processes driving electron precipitation
To investigate the specific nonlinear processes driving electron precipitation, we tracked the electrons that were precipitated at time
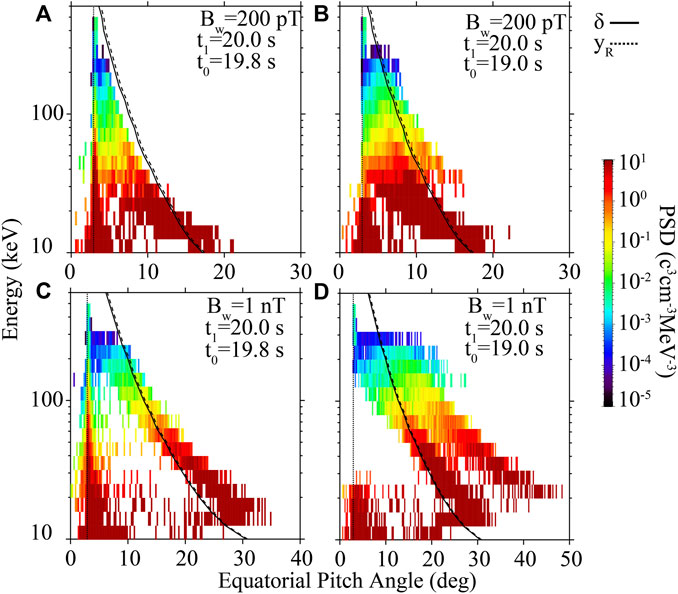
FIGURE 3. PSD distribution of precipitated electrons at time
We further confirm this mechanism we propose, by comparing the tracing results with the theoretical analysis by Albert et al. (2021) and Artemyev et al. (2021a). For anomalous trapping to occur, Albert et al. (2021) provides the criterion
Here,
Here,
Based on the analysis presented above, we discuss the mechanisms governing electron precipitation in the presence of nonlinear interactions. Figure 4B provides an illustration of the pitch angle-energy space, where the phase bunching boundary is depicted. This boundary represents the inner limit within which phase bunching can occur, transporting electrons toward the vicinity of the loss cone. The advection and diffusion effects associated with the phase bunching process determine whether the electrons move into or out of the loss cone. For equatorial pitch angles smaller than the phase bunching boundary values, the dominant effect of anomalous scattering causes electrons to scatter into higher pitch angles. Consequently, electrons within the phase bunching boundary cannot undergo direct precipitation through nonlinear interactions with whistler-mode waves. However, once they are transported outside of this boundary, they undergo precipitation through the phase bunching process. Furthermore, the phase bunching boundary converges to smaller pitch angles as the energy increases, as indicated by the values
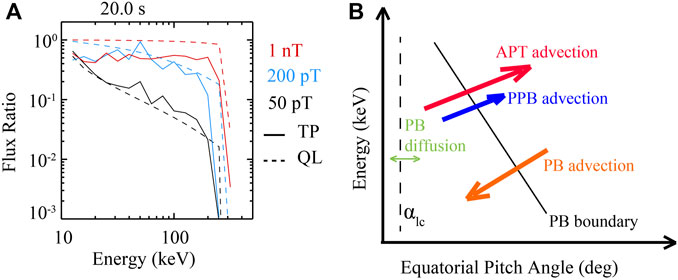
FIGURE 4. (A) Precipitation to trapped electron flux ratio versus energy, color coded for different wave amplitudes. The dashed lines mark the quasilinear results, and the solid lines represent the test particle results. (B) Illustration of electron precipitation mechanisms in the pitch angle and energy space in the nonlinear regime. Here, APT represents Anomalous Phase Trapping; PPB represents Positive Phase Bunching; PB represents Phase Bunching.
We further quantify the precipitation in the nonlinear regime by calculating the precipitation flux ratio and comparing it to the quasilinear QES expectations defined in Eq. 5. The comparison is presented in Figure 4A, where solid lines represent the test particle results and dashed lines represent the quasilinear results. Different colors correspond to different wave amplitudes. In the quasilinear regime, the test particle flux ratio aligns well with the quasilinear results, as demonstrated by the black lines representing an amplitude of 50 pT. For an amplitude of 1 nT, the quasilinear theory predicts a completely filled loss cone for all resonant energies. However, the test particle simulations, which are dominated by nonlinear processes across the entire energy range, yield a smaller flux ratio compared to the quasilinear theory. For an amplitude of 200 pT, nonlinear processes dominate the precipitation for energies below approximately 30 keV, as evidenced by the results in Figures 3A, B, which were discussed earlier. Consistently, Figure 4A illustrates that the test particle flux ratio is smaller than the quasilinear results below approximately 30 keV. However, for higher energies, the test particle results closely match the quasilinear ones, indicating that quasilinear processes are the main driving mechanism for electron precipitation in that energy range. Overall, the results suggest that nonlinear precipitation leads to a flux ratio smaller than that predicted by quasilinear expectations.
3.3 Nonlinear diffusion and advection
As is shown in Figure 4A, electron precipitation in the nonlinear regime is driven by the combination of various nonlinear processes. Thus, quantification of the nonlinear diffusion and advection is critical for the understanding of nonlinear precipitation processes. Figure 5 shows the diffusion coefficients based on quasilinear theory and test particle simulations for nonlinear waves (200 pT and 1 nT). The bounce-averaged quasilinear coefficients are calculated based on Ma et al. (2018), and are shown in Figures 5A, D for amplitudes of 200 pT and 1 nT, respectively. Quasilinear diffusion coefficients at the equatorial loss cone (
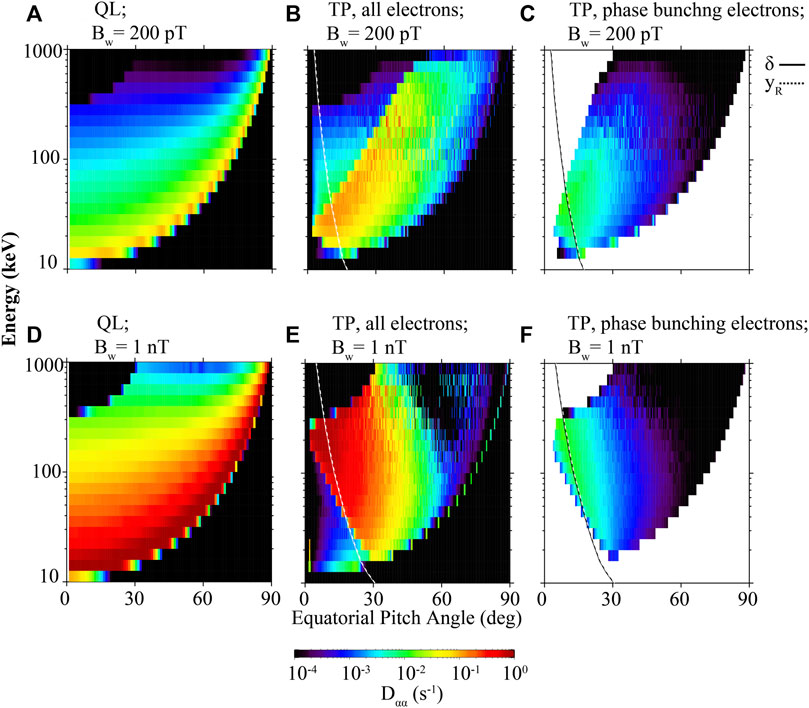
FIGURE 5. Diffusion coefficients of different electron populations and wave amplitudes, within the equatorial pitch angle-energy space. (A) Quasilinear diffusion coefficients; (B) diffusion coefficients of all electrons from test particle simulations; (C) diffusion coefficients of phase bunching electrons for the amplitude of 200 pT from test particle simulations. (D–F) Same as (A–C) but for the amplitude of 1 nT. The solid and dashed white lines are contours of
Here,
The parameters are the same as those of Eq. 8 but for phase bunching electrons only. The phase bunching electrons are identified by excluding the phase trapping electrons. Identification of phase trapping is described in Section 2.3.
Advection coefficients and the ratio of phase/anomalous trapping electrons are presented in Figure 6. Results for the amplitude of 200 pT and 1nT are shown in Figures 6A–C, and Figures 6D–F, respectively. As is shown in Figure 6A, phase trapping ratio, i.e., the ratio between the number of phase trapping electrons and the total population, is highest to the left of the phase bunching boundary, which reaches a value of 50%. Phase trapping advection is shown in Figure 6B, which is quantified by the average of equatorial pitch angle variation of the phase trapping electrons. Phase trapping advection is highest at the nonlinear boundary. Advection of the phase bunching is also denoted by the average of equatorial pitch angles for the phase bunching electrons. For small pitch angle region, phase bunching advection is positive due to dominant positive bunching processes, as shown in Figure 1B. The boundary of the positive advection agrees with the theoretical boundaries qualitatively well. Regarding the results for the amplitude of 1 nT (Figures 6D–F), anomalous trapping probability reaches 100% within the phase bunching boundary. Phase trapping advection shows a similar distribution to that of 200 pT, with the highest advection at the upper resonant energy boundary, which corresponds to the highest resonant latitude. For advection of bunching electrons, positive bunching only occurs for pitch angles close to the phase bunching boundary with high energy. It is worth noting that the bunching processes are not possible for most regions left of the phase bunching boundary, due to the 100% trapping ratio.
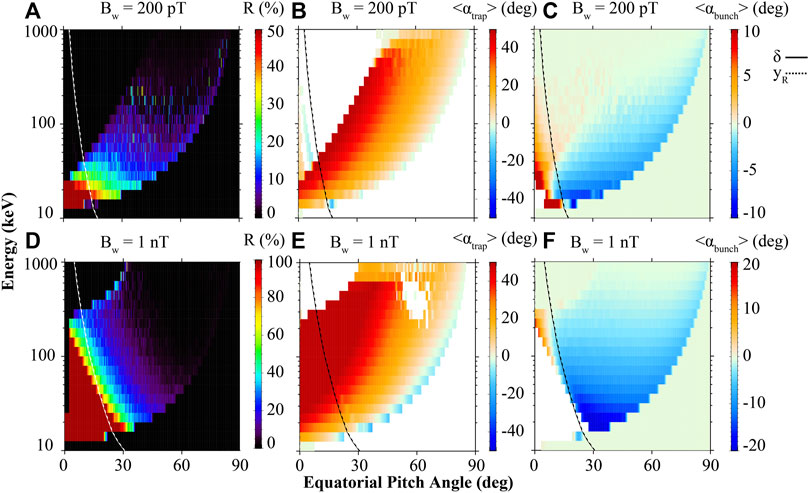
FIGURE 6. Phase trapping ratio and advection coefficients of both phase trapping and bunching distribution in equatorial pitch angle-energy space. (A) Phase trapping ratio; (B) advection coefficients of phase trapping electrons; (C) advection coefficients of phase bunching electrons for the amplitude of 200 pT. (D–F) Same as (A–C) but for the amplitude of 1 nT. Solid and dashed lines mark the theoretically calculated phase bunching boundary based on Albert et al. (2021) and Artemyev et al. (2021a), respectively.
In Figure 7, we show the diffusion coefficients and advection coefficients of nonlinear processes with color coded lines for different energies to present their characteristics more clearly. Diffusion coefficients of phase bunching electrons for the wave amplitude of 200 pT are shown in Figure 7A in solid lines. As is shown in Figure 5C, for the amplitude of 200 pT, wave-particle interactions transit to the quasilinear regime as the electron pitch angle decreases and energy increases. We also show quasilinear diffusion coefficients of this region with dotted lines in Figure 7A for completeness, as phase bunching is not possible within the quasilinear regime. Pitch angle diffusion coefficients, shown in logarithmic scale, mostly decrease linearly as pitch angle increases. For nonlinear energy range (<40 keV), diffusion coefficients have similar values for a specific pitch angle, with the nonlinear pitch angle range extending to smaller pitch angles for lower energies. For higher energies, the quasilinear process is dominant. Quasilinear diffusion coefficients increase with pitch angle and decrease with energy. Such reverse in energy dependence corresponds to the flux ratio distribution versus energy shown in Figure 4A. The flux ratio also increases with energy in the nonlinear regime and decreases in the quasilinear regime for amplitude of 200 pT. Advection coefficients of phase bunching electrons (200 pT) are shown in Figure 7B. For energies within the nonlinear regime, phase bunching shows positive advection for small pitch angles and negative advection for larger pitch angles. The absolute values of phase bunching advection coefficients decrease with increasing energy. For quasilinear energies (above 40 keV), close-to-zero advection is shown due to the dominant diffusion process. Advection coefficients of phase trapping electrons are presented in Figure 7C, and they increase with increasing energy, as discussed above. Results of the amplitude of 1 nT are shown in the same format in Figures 7D–F. In this case, all energies shown are in the nonlinear regime. Phase bunching diffusion coefficients of 1 nT for energies also follow the same trend, except for the pitch angle range close to the inner-most phase bunching boundary. Maximum diffusion coefficients also increase with increasing energy similar to what is shown in Figure 7A for the amplitude of 200 pT, but for all energies. Advection coefficients of phase bunching electrons decrease with increasing energy in the case of 1 nT. For lower energy electrons (<40 keV), only negative phase bunching advection is observed. For higher energies, advection is positive at small pitch angles, and negative at larger pitch angles. Advection coefficients of trapping electrons exhibit a similar pitch angle distribution and increase with increasing energy.
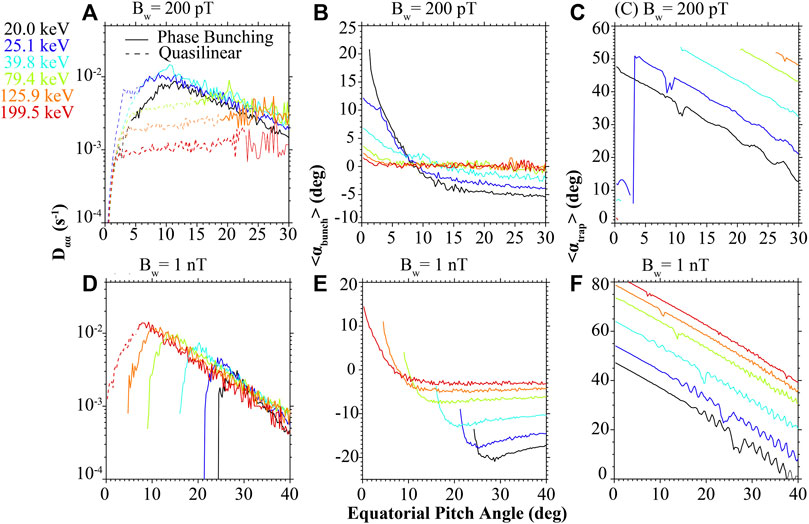
FIGURE 7. Diffusion coefficients and advection coefficients of phase bunching and trapping electrons. (A) Diffusion coefficients of phase bunching electrons interacting with the wave amplitude of 200 pT shown in solid lines, color coded for different energies. The dashed lines show the quasilinear diffusion coefficients in the quasilinear regime, where phase bunching is not possible. (B) Advection coefficients of phase bunching electrons; (C) advection coefficients of phase trapping electrons. (D–F) Same as (A–C) but for the amplitude of 1 nT.
4 Discussion
As discussed above, the precipitation flux ratio transits from nonlinear characteristics at low energies to quasilinear characteristics at high energies, when the wave amplitude is 200 pT. For the amplitude of 1 nT, however, nonlinear characteristics persist for all resonant energies. The distribution of such nonlinear characteristics can be quantitatively analyzed through the nonlinear inhomogeneity ratio. In Figures 8A, B, we show the distribution of inhomogeneity ratio S, which follows Omura et al. (2007):
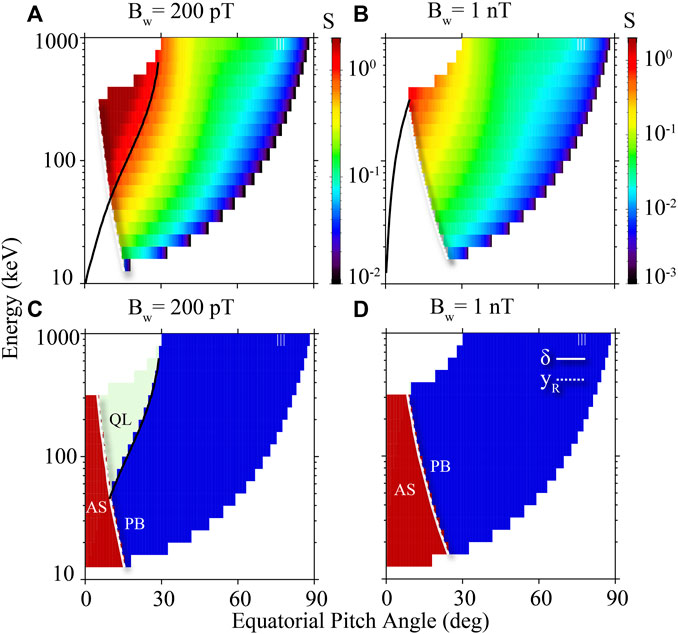
FIGURE 8. The distribution of inhomogeneity ratio and different regimes in electron equatorial pitch angle-energy space. (A) Inhomogeneity ratio (S) distribution for the amplitude of 200 pT. Black solid line marks the points where S = 1. The white solid and dashed lines mark the theoretically derived phase bunching boundary from Albert et al. (2021) and Artemyev et al. (2021b). (B) Inhomogeneity ratio S distribution for the amplitude of 1 nT. (C) Distribution of different regimes in pitch angle-energy space for the amplitude of 200 pT. Green region represents quasilinear regime, where electrons are diffused into the loss cone via quasilinear processes. Red region marks the region where electrons are anomalously trapped or positively bunched away from the loss cone. Blue region marks the region where electrons can be precipitated through phase bunching processes. (D) Same as (C) but for the amplitude of 1 nT.
Here,
As shown in Figures 8A, B, the inhomogeneity ratio S is not calculated for small pitch angle regions, i.e., within the phase bunching boundary, which results in the gaps. This is because the inhomogeneity ratio S from Omura et al. (2007) is not suitable for analyzing electrons with very small equatorial pitch angles. The inhomogeneity ratio S is derived from Equation (5) of Omura et al. (2007):
Here,
The simulations in this paper assume a uniform wave amplitude, which may be approximated by a very long wave packet. As shown by Zhang et al. (2019), short and intense whistler-mode wave packets are also commonly observed in the Earth’s radiation belts. These short packets are able to resonate with electrons nonlinearly, but would significantly reduce the trapping effects, including the anomalous trapping (Mourenas et al., 2018; Gan et al., 2020; Artemyev et al., 2021a). This may lead to a more diffusive precipitation process, which was discussed in Mourenas et al. (2022). The effects of wave packet length, and the wave coherency (Zhang et al., 2020) need to be considered in the numerical simulations and are left as future extensions of this paper.
5 Conclusion
In this paper, we systematically estimate the combined effects of anomalous scattering and phase bunching caused by intense whistler-mode waves on electron precipitation. We proposed a new physical picture of energetic electron precipitation in the nonlinear regime. The transition of electron precipitation from quasilinear to nonlinear regimes is analyzed using current theories. Nonlinear diffusion and advection coefficients, which are crucial for the nonlinear precipitation processes, are also calculated using the test particle simulations. The key findings of this paper are summarized below:
1. Nonlinear electron precipitation is driven by phase bunching right outside the phase bunching boundary, instead of right outside of the loss cone.
2. Anomalous trapping and positive phase bunching prevent electrons within the phase bunching boundary from precipitation.
3. Nonlinear precipitation region is determined by both the phase bunching boundary and inhomogeneity ratio and is dominant at lower energies. The maximum energy for nonlinear precipitation increases with increasing wave amplitude.
4. Phase bunching driven precipitation leads to a smaller flux ratio compared to quasilinear expectations at the quasi-equilibrium state.
5. Maximum phase bunching diffusion coefficients are much smaller than those from quasilinear theory. Phase bunching diffusion coefficients near the phase bunching boundary increase with increasing energy.
The results from this study are based on purely parallel whistler-mode waves. Previous studies have also shown abundant large amplitude oblique whistler-mode waves with wave normal angles close to the resonance cone angle (e.g., Cattell et al., 2008; Li et al., 2016). The nonlinear effects for these quasi-electrostatic whistler-mode waves can be very different from parallel waves (Artemyev et al., 2013; Goyal et al., 2017; Goyal et al., 2018; Zhang et al., 2022a) and further investigation is needed to fully understand their roles in electron precipitation.
Determination of phase bunching boundary is crucial to understanding precipitation in the nonlinear regime. Previous theoretical analyses have provided rough estimates of this boundary. However, these theoretical analyses are focused on anomalous trapping and do not consider positive bunching process. Thus, the theoretical results do not agree with the numerical results well for the case of 200 pT where positive bunching also plays a significant role. Further numerical and theoretical studies that quantitatively determine the phase bunching are important and left as future work.
As shown in this paper, the pitch angle distribution of precipitation PSD is different from quasilinear expectations in the nonlinear regime, which leads to a smaller flux ratio. This could be due to the fact that phase bunching diffusion coefficients near the phase bunching boundary is much smaller than quasilinear diffusion coefficients near the loss cone. Theoretical expressions of the nonlinear precipitation PSD distribution using nonlinear diffusion and advection coefficients could serve as an interesting future study. Potential results from these future studies could also contribute to improving the method of calculating whistler-mode wave intensity based on the electron precipitation ratio proposed by Li et al. (2013), which relies on quasilinear theory (Kennel and Petschek, 1966). It is also important to evaluate the relative contributions of the advection and diffusion coefficients in driving the electron precipitation, as well as determine the precipitation to trapped flux ratio. For short timescales of several bounces, if the phase bunching advection coefficients are the dominant term, the precipitation ratio will be more sensitive to the electron pitch angle distribution and the large pitch angle gradient of the PSD near the phase bunching boundary could potentially lead to local peaks or an inverse PSD gradient within the loss cone. On the other hand, if phase bunching diffusion coefficients are dominant, the electron pitch angle distribution near the loss cone are not sensitive to the electron pitch angle distribution, similar to what was predicted by the quasilinear theory (e.g., Kennel and Petschek, 1966), although the distribution would be different from the quasilinear prediction due to the different diffusion coefficients from phase bunching, as discussed above. For longer timescales which is the focus of this study, the initial distribution should not have significant effects on electron precipitation with intense whistler-mode waves.
Inhomogeneity ratio has been commonly used to estimate the nonlinear effects of whistler-mode waves. However, as discussed in this paper, previous analytical expressions of the inhomogeneity ratio are not applicable concerning the precipitation problem, since the electron pitch angle is small and major assumptions of the derivation of these inhomogeneity ratios become invalid. Further studies on the correct form of inhomogeneity ratio at very small pitch angles are essential to our understanding of the role of nonlinear interactions in electron precipitation. This is beyond the scope of this paper and is left as a follow-up study.
Data availability statement
The original contributions presented in the study are publicly available. This data can be found here: https://doi.org/10.6084/m9.figshare.23282702.v1.
Author contributions
LG: Formal Analysis, Investigation, Methodology, Software, Validation, Visualization, Writing–original draft, Writing–review and editing. WL: Funding acquisition, Supervision, Writing–review and editing. MH: Writing–review and editing. QM: Writing–review and editing. JA: Writing–review and editing. AA: Writing–review and editing.
Funding
The author(s) declare financial support was received for the research, authorship, and/or publication of this article. At Boston University, this research is supported by NASA grants 80NSSC20K0698, 80NSSC19K0845, 80NSSC21K1312, and 80NSSC20K0196, NSF grants AGS-1847818, AGS-2019950, and AGS-2225445. LG gratefully acknowledges the NASA FINESST grant 80NSSC20K1506.
Conflict of interest
The authors declare that the research was conducted in the absence of any commercial or financial relationships that could be construed as a potential conflict of interest.
Publisher’s note
All claims expressed in this article are solely those of the authors and do not necessarily represent those of their affiliated organizations, or those of the publisher, the editors and the reviewers. Any product that may be evaluated in this article, or claim that may be made by its manufacturer, is not guaranteed or endorsed by the publisher.
Supplementary material
The Supplementary Material for this article can be found online at: https://www.frontiersin.org/articles/10.3389/fspas.2023.1322934/full#supplementary-material
References
Albert, J. M. (1993). Cyclotron resonance in an inhomogeneous magnetic field. Phys. Fluids B Plasma Phys. 5 (8), 2744–2750. doi:10.1063/1.860715
Albert, J. M., Meredith, N. P., and Horne, R. B. (2009). Three-dimensional diffusion simulation of outer radiation belt electrons during the 9 October 1990 magnetic storm. J. Geophys. Res. Space Phys. 114 (A9). doi:10.1029/2009JA014336
Albert, J. M. (2000). Gyroresonant interactions of radiation belt particles with a monochromatic electromagnetic wave. J. Geophys. Res. Space Phys. 105 (A9), 21191–21209. doi:10.1029/2000JA000008
Albert, J. M., Artemyev, A. V., Li, W., Gan, L., and Ma, Q. (2021). Models of resonant wave-particle interactions. J. Geophys. Res. Space Phys. 126 (6), e2021JA029216. doi:10.1029/2021JA029216
Artemyev, A. V., Neishtadt, A. I., Albert, J. M., Gan, L., Li, W., and Ma, Q. (2021a). Theoretical model of the nonlinear resonant interaction of whistler-mode waves and field-aligned electrons. Phys. Plasmas 28 (5), 052902. doi:10.1063/5.0046635
Artemyev, A. V., Neishtadt, A. I., Vainchtein, D. L., Vasiliev, A. A., Vasko, I. Y., and Zelenyi, L. M. (2018). Trapping (capture) into resonance and scattering on resonance: summary of results for space plasma systems. Commun. Nonlinear Sci. Numer. Simulations 65, 111–160. doi:10.1016/j.cnsns.2018.05.004
Artemyev, A. V., Neishtadt, A. I., Vasiliev, A. A., and Mourenas, D. (2021b). Transitional regime of electron resonant interaction with whistler-mode waves in inhomogeneous space plasma. Phys. Rev. E 104 (5), 055203. doi:10.1103/PhysRevE.104.055203
Artemyev, A. V., Vasiliev, A. A., Mourenas, D., Agapitov, O. V., Krasnoselskikh, V., Boscher, D., et al. (2014). Fast transport of resonant electrons in phase space due to nonlinear trapping by whistler waves. Geophys. Res. Lett. 41 (16), 5727–5733. doi:10.1002/2014GL061380
Artemyev, A. V., Vasiliev, A. A., Mourenas, D., Agapitov, O. V., and Krasnoselskikh, V. V. (2013). Nonlinear electron acceleration by oblique whistler waves: landau resonance vs. cyclotron resonance. Phys. Plasmas 20 (12), 122901. doi:10.1063/1.4836595
Bellan, P. M. (2013). Pitch angle scattering of an energetic magnetized particle by a circularly polarized electromagnetic wave. Phys. Plasmas 20 (4), 042117. doi:10.1063/1.4801055
Blake, J. B., Looper, M. D., Baker, D. N., Nakamura, R., Klecker, B., and Hovestadt, D. (1996). New high temporal and spatial resolution measurements by SAMPEX of the precipitation of relativistic electrons. Adv. Space Res. 18 (8), 171–186. doi:10.1016/0273-1177(95)00969-8
Bortnik, J., Albert, J. M., Artemyev, A., Li, W., Jun, C.-W., Grach, V. S., et al. (2022). Amplitude dependence of nonlinear precipitation blocking of relativistic electrons by large amplitude EMIC waves. Geophys. Res. Lett. 49 (12), e2022GL098365. doi:10.1029/2022GL098365
Bortnik, J., Thorne, R. M., and Inan, U. S. (2008). Nonlinear interaction of energetic electrons with large amplitude chorus. Geophys. Res. Lett. 35 (21), 35500. doi:10.1029/2008GL035500
Breneman, A. W., Crew, A., Sample, J., Klumpar, D., Johnson, A., Agapitov, O., et al. (2017). Observations directly linking relativistic electron microbursts to whistler mode chorus: van allen probes and FIREBIRD II. Geophys. Res. Lett. 44 (22), 265–272. doi:10.1002/2017GL075001
Cattell, C., Wygant, J. R., Goetz, K., Kersten, K., Kellogg, P. J., Rosenvinge, T. V., et al. (2008). Discovery of very large amplitude whistler-mode waves in Earth’s radiation belts. Geophys. Res. Lett. 35 (1), 32009. doi:10.1029/2007GL032009
Chen, L., Zhang, X.-J., Artemyev, A., Angelopoulos, V., Tsai, E., Wilkins, C., et al. (2022). Ducted chorus waves cause sub-relativistic and relativistic electron microbursts. Geophys. Res. Lett. 49 (5), e2021GL097559. doi:10.1029/2021GL097559
Denton, R. E., Menietti, J. D., Goldstein, J., Young, S. L., and Anderson, R. R. (2004). Electron density in the magnetosphere. J. Geophys. Res. Space Phys. 109 (A9), 10245. doi:10.1029/2003JA010245
Douma, E., Rodger, C. J., Clilverd, M. A., Hendry, A. T., Engebretson, M. J., and Lessard, M. R. (2018). Comparison of relativistic microburst activity seen by SAMPEX with ground-based wave measurements at Halley, Antarctica. J. Geophys. Res. Space Phys. 123 (2), 1279–1294. doi:10.1002/2017JA024754
Frantsuzov, V. A., Artemyev, A. V., Zhang, X.-J., Allanson, O., Shustov, P. I., and Petrukovich, A. A. (2023). Diffusive scattering of energetic electrons by intense whistler-mode waves in an inhomogeneous plasma. J. Plasma Phys. 89 (1), 905890101. doi:10.1017/S0022377822001271
Gan, L., Li, W., Ma, Q., Albert, J. M., Artemyev, A. V., and Bortnik, J. (2020). Nonlinear interactions between radiation belt electrons and chorus waves: dependence on wave amplitude modulation. Geophys. Res. Lett. 47 (4), e2019GL085987. doi:10.1029/2019GL085987
Goyal, R., Sharma, R. P., and Gupta, D. N. (2018). Whistler mode localization and turbulence implicating particle acceleration in radiation belts. Phys. Plasmas 25 (12), 122903. doi:10.1063/1.5054635
Goyal, R., Sharma, R. P., and Kumar, S. (2017). Nonlinear effects associated with quasi-electrostatic whistler waves relevant to that in radiation belts. J. Geophys. Res. Space Phys. 122 (1), 340–348. doi:10.1002/2016JA023274
Grach, V. S., Artemyev, A. V., Demekhov, A. G., Zhang, X.-J., Bortnik, J., Angelopoulos, V., et al. (2022). Relativistic electron precipitation by EMIC waves: importance of nonlinear resonant effects. Geophys. Res. Lett. 49 (17), e2022GL099994. doi:10.1029/2022GL099994
Grach, V. S., and Demekhov, A. G. (2020). Precipitation of relativistic electrons under resonant interaction with electromagnetic ion cyclotron wave packets. J. Geophys. Res. Space Phys. 125 (2), e2019JA027358. doi:10.1029/2019JA027358
Hanzelka, M., Li, W., and Ma, Q. (2023). Parametric analysis of pitch angle scattering and losses of relativistic electrons by oblique EMIC waves. Front. Astronomy Space Sci. 10, 1163515. doi:10.3389/fspas.2023.1163515
Henrard, J., and Lemaitre, A. (1983). A second fundamental model for resonance. Celest. Mech. 30 (2), 197–218. doi:10.1007/BF01234306
Horne, R. B., Thorne, R. M., Glauert, S. A., Albert, J. M., Meredith, N. P., and Anderson, R. R. (2005). Timescale for radiation belt electron acceleration by whistler mode chorus waves. J. Geophys. Res. Space Phys. 110 (A3), 10811. doi:10.1029/2004JA010811
Kennel, C. F., and Engelmann, F. (1966). Velocity space diffusion from weak plasma turbulence in a magnetic field. Phys. Fluids 9 (12), 2377–2388. doi:10.1063/1.1761629
Kennel, C. F., and Petschek, H. E. (1966). Limit on stably trapped particle fluxes. J. Geophys. Res. 71 (1), 1–28. doi:10.1029/JZ071i001p00001
Kitahara, M., and Katoh, Y. (2019). Anomalous trapping of low pitch angle electrons by coherent whistler mode waves. J. Geophys. Res. Space Phys. 124 (7), 5568–5583. doi:10.1029/2019JA026493
Li, W., Ni, B., Thorne, R. M., Bortnik, J., Green, J. C., Kletzing, C. A., et al. (2013). Constructing the global distribution of chorus wave intensity using measurements of electrons by the POES satellites and waves by the Van Allen Probes. Geophys. Res. Lett. 40 (17), 4526–4532. doi:10.1002/grl.50920
Li, W., Santolik, O., Bortnik, J., Thorne, R. M., Kletzing, C. A., Kurth, W. S., et al. (2016). New chorus wave properties near the equator from Van Allen Probes wave observations. Geophys. Res. Lett. 43 (10), 4725–4735. doi:10.1002/2016GL068780
Li, W., Thorne, R. M., Ma, Q., Ni, B., Bortnik, J., Baker, D. N., et al. (2014). Radiation belt electron acceleration by chorus waves during the 17 March 2013 storm. J. Geophys. Res. Space Phys. 119 (6), 4681–4693. doi:10.1002/2014JA019945
Lyons, L. R. (1974). Pitch angle and energy diffusion coefficients from resonant interactions with ion–cyclotron and whistler waves. J. Plasma Phys. 12 (3), 417–432. doi:10.1017/S002237780002537X
Ma, Q., Li, W., Bortnik, J., Thorne, R. M., Chu, X., Ozeke, L. G., et al. (2018). Quantitative evaluation of radial diffusion and local acceleration processes during GEM challenge events. J. Geophys. Res. Space Phys. 123 (3), 1938–1952. doi:10.1002/2017JA025114
Miyoshi, Y., Saito, S., Kurita, S., Asamura, K., Hosokawa, K., Sakanoi, T., et al. (2020). Relativistic electron microbursts as high-energy tail of pulsating aurora electrons. Geophys. Res. Lett. 47, e90360. doi:10.1029/2020GL090360
Mourenas, D., Zhang, X.-J., Artemyev, A. V., Angelopoulos, V., Thorne, R. M., Bortnik, J., et al. (2018). Electron nonlinear resonant interaction with short and intense parallel chorus wave packets. J. Geophys. Res. Space Phys. 123 (6), 4979–4999. doi:10.1029/2018JA025417
Mourenas, D., Zhang, X.-J., Nunn, D., Artemyev, A. V., Angelopoulos, V., Tsai, E., et al. (2022). Short chorus wave packets: generation within chorus elements, statistics, and consequences on energetic electron precipitation. J. Geophys. Res. Space Phys. 127 (5), e2022JA030310. doi:10.1029/2022JA030310
Mozer, F. S., Agapitov, O. V., Blake, J. B., and Vasko, I. Y. (2018). Simultaneous observations of lower band chorus emissions at the equator and microburst precipitating electrons in the ionosphere. Geophys. Res. Lett. 45 (2), 511–516. doi:10.1002/2017GL076120
Neishtadt, A. I. (1975). Passage through a separatrix in a resonance problem with a slowly-varying parameter: PMM. J. Appl. Math. Mech. 39 (4), 594–605. doi:10.1016/0021-8928(75)90060-X
Nunn, D., and Omura, Y. (2015). A computational and theoretical investigation of nonlinear wave-particle interactions in oblique whistlers. J. Geophys. Res. (Space Phys. 120 (4), 2890–2911. doi:10.1002/2014JA020898
O’Brien, T. P., Looper, M. D., and Blake, J. B. (2004). Quantification of relativistic electron microburst losses during the GEM storms. Geophys. Res. Lett. 31 (4), 18621. doi:10.1029/2003GL018621
Omura, Y., Furuya, N., and Summers, D. (2007). Relativistic turning acceleration of resonant electrons by coherent whistler mode waves in a dipole magnetic field. J. Geophys. Res. Space Phys. 112 (A6), 12243. doi:10.1029/2006JA012243
Shumko, M., Turner, D. L., O’Brien, T. P., Claudepierre, S. G., Sample, J., Hartley, D. P., et al. (2018). Evidence of microbursts observed near the equatorial plane in the outer van allen radiation belt. Geophys. Res. Lett. 45 (16), 8044–8053. doi:10.1029/2018GL078451
Tao, X., and Bortnik, J. (2010). Nonlinear interactions between relativistic radiation belt electrons and oblique whistler mode waves. Nonlinear Process. Geophys. 17 (5), 599–604. doi:10.5194/npg-17-599-2010
Thorne, R. M., Li, W., Ni, B., Ma, Q., Bortnik, J., Chen, L., et al. (2013). Rapid local acceleration of relativistic radiation-belt electrons by magnetospheric chorus. Nature 504 (7480), 411–414. doi:10.1038/nature12889
Thorne, R. M., O’Brien, T. P., Shprits, Y. Y., Summers, D., and Horne, R. B. (2005). Timescale for MeV electron microburst loss during geomagnetic storms. J. Geophys. Res. Space Phys. 110 (A9). doi:10.1029/2004JA010882
Vainchtein, D., Zhang, X.-J., Artemyev, A. V., Mourenas, D., Angelopoulos, V., and Thorne, R. M. (2018). Evolution of electron distribution driven by nonlinear resonances with intense field-aligned chorus waves. J. Geophys. Res. (Space Phys. 123 (10), 8149–8169. doi:10.1029/2018JA025654
Zhang, X.-J., Agapitov, O., Artemyev, A. V., Mourenas, D., Angelopoulos, V., Kurth, W. S., et al. (2020). Phase decoherence within intense chorus wave packets constrains the efficiency of nonlinear resonant electron acceleration. Geophys. Res. Lett. 47 (20), e2020GL089807. doi:10.1029/2020GL089807
Zhang, X. J., Angelopoulos, V., Mourenas, D., Artemyev, A., Tsai, E., and Wilkins, C. (2022a). Characteristics of electron microburst precipitation based on high-resolution ELFIN measurements. J. Geophys. Res. Space Phys. 127 (5), e2022JA030509. doi:10.1029/2022JA030509
Zhang, X. J., Artemyev, A., Angelopoulos, V., Tsai, E., Wilkins, C., Kasahara, S., et al. (2022b). Superfast precipitation of energetic electrons in the radiation belts of the Earth. Nat. Commun. 13 (1), 1611. doi:10.1038/s41467-022-29291-8
Zhang, X.-J., Mourenas, D., Artemyev, A. V., Angelopoulos, V., Bortnik, J., Thorne, R. M., et al. (2019). Nonlinear electron interaction with intense chorus waves: statistics of occurrence rates. Geophys. Res. Lett. 46 (13), 7182–7190. doi:10.1029/2019GL083833