Hydraulic Traits and Non-Structural Carbon Responses to Drought Stress in Reaumuria soongorica (Pall.) Maxim. and Salsola passerina Bunge
[ad_1]
Figure 1.
Variations in leaf water potential of Reaumuria soongorica (Pall.) Maxim. (A,B) and Salsola passerina Bunge (C,D) during water treatments. Data are mean ± SE. Abbreviations: ΨPD, predawn leaf water potential; ΨMD, midday leaf water potential.
Figure 1.
Variations in leaf water potential of Reaumuria soongorica (Pall.) Maxim. (A,B) and Salsola passerina Bunge (C,D) during water treatments. Data are mean ± SE. Abbreviations: ΨPD, predawn leaf water potential; ΨMD, midday leaf water potential.
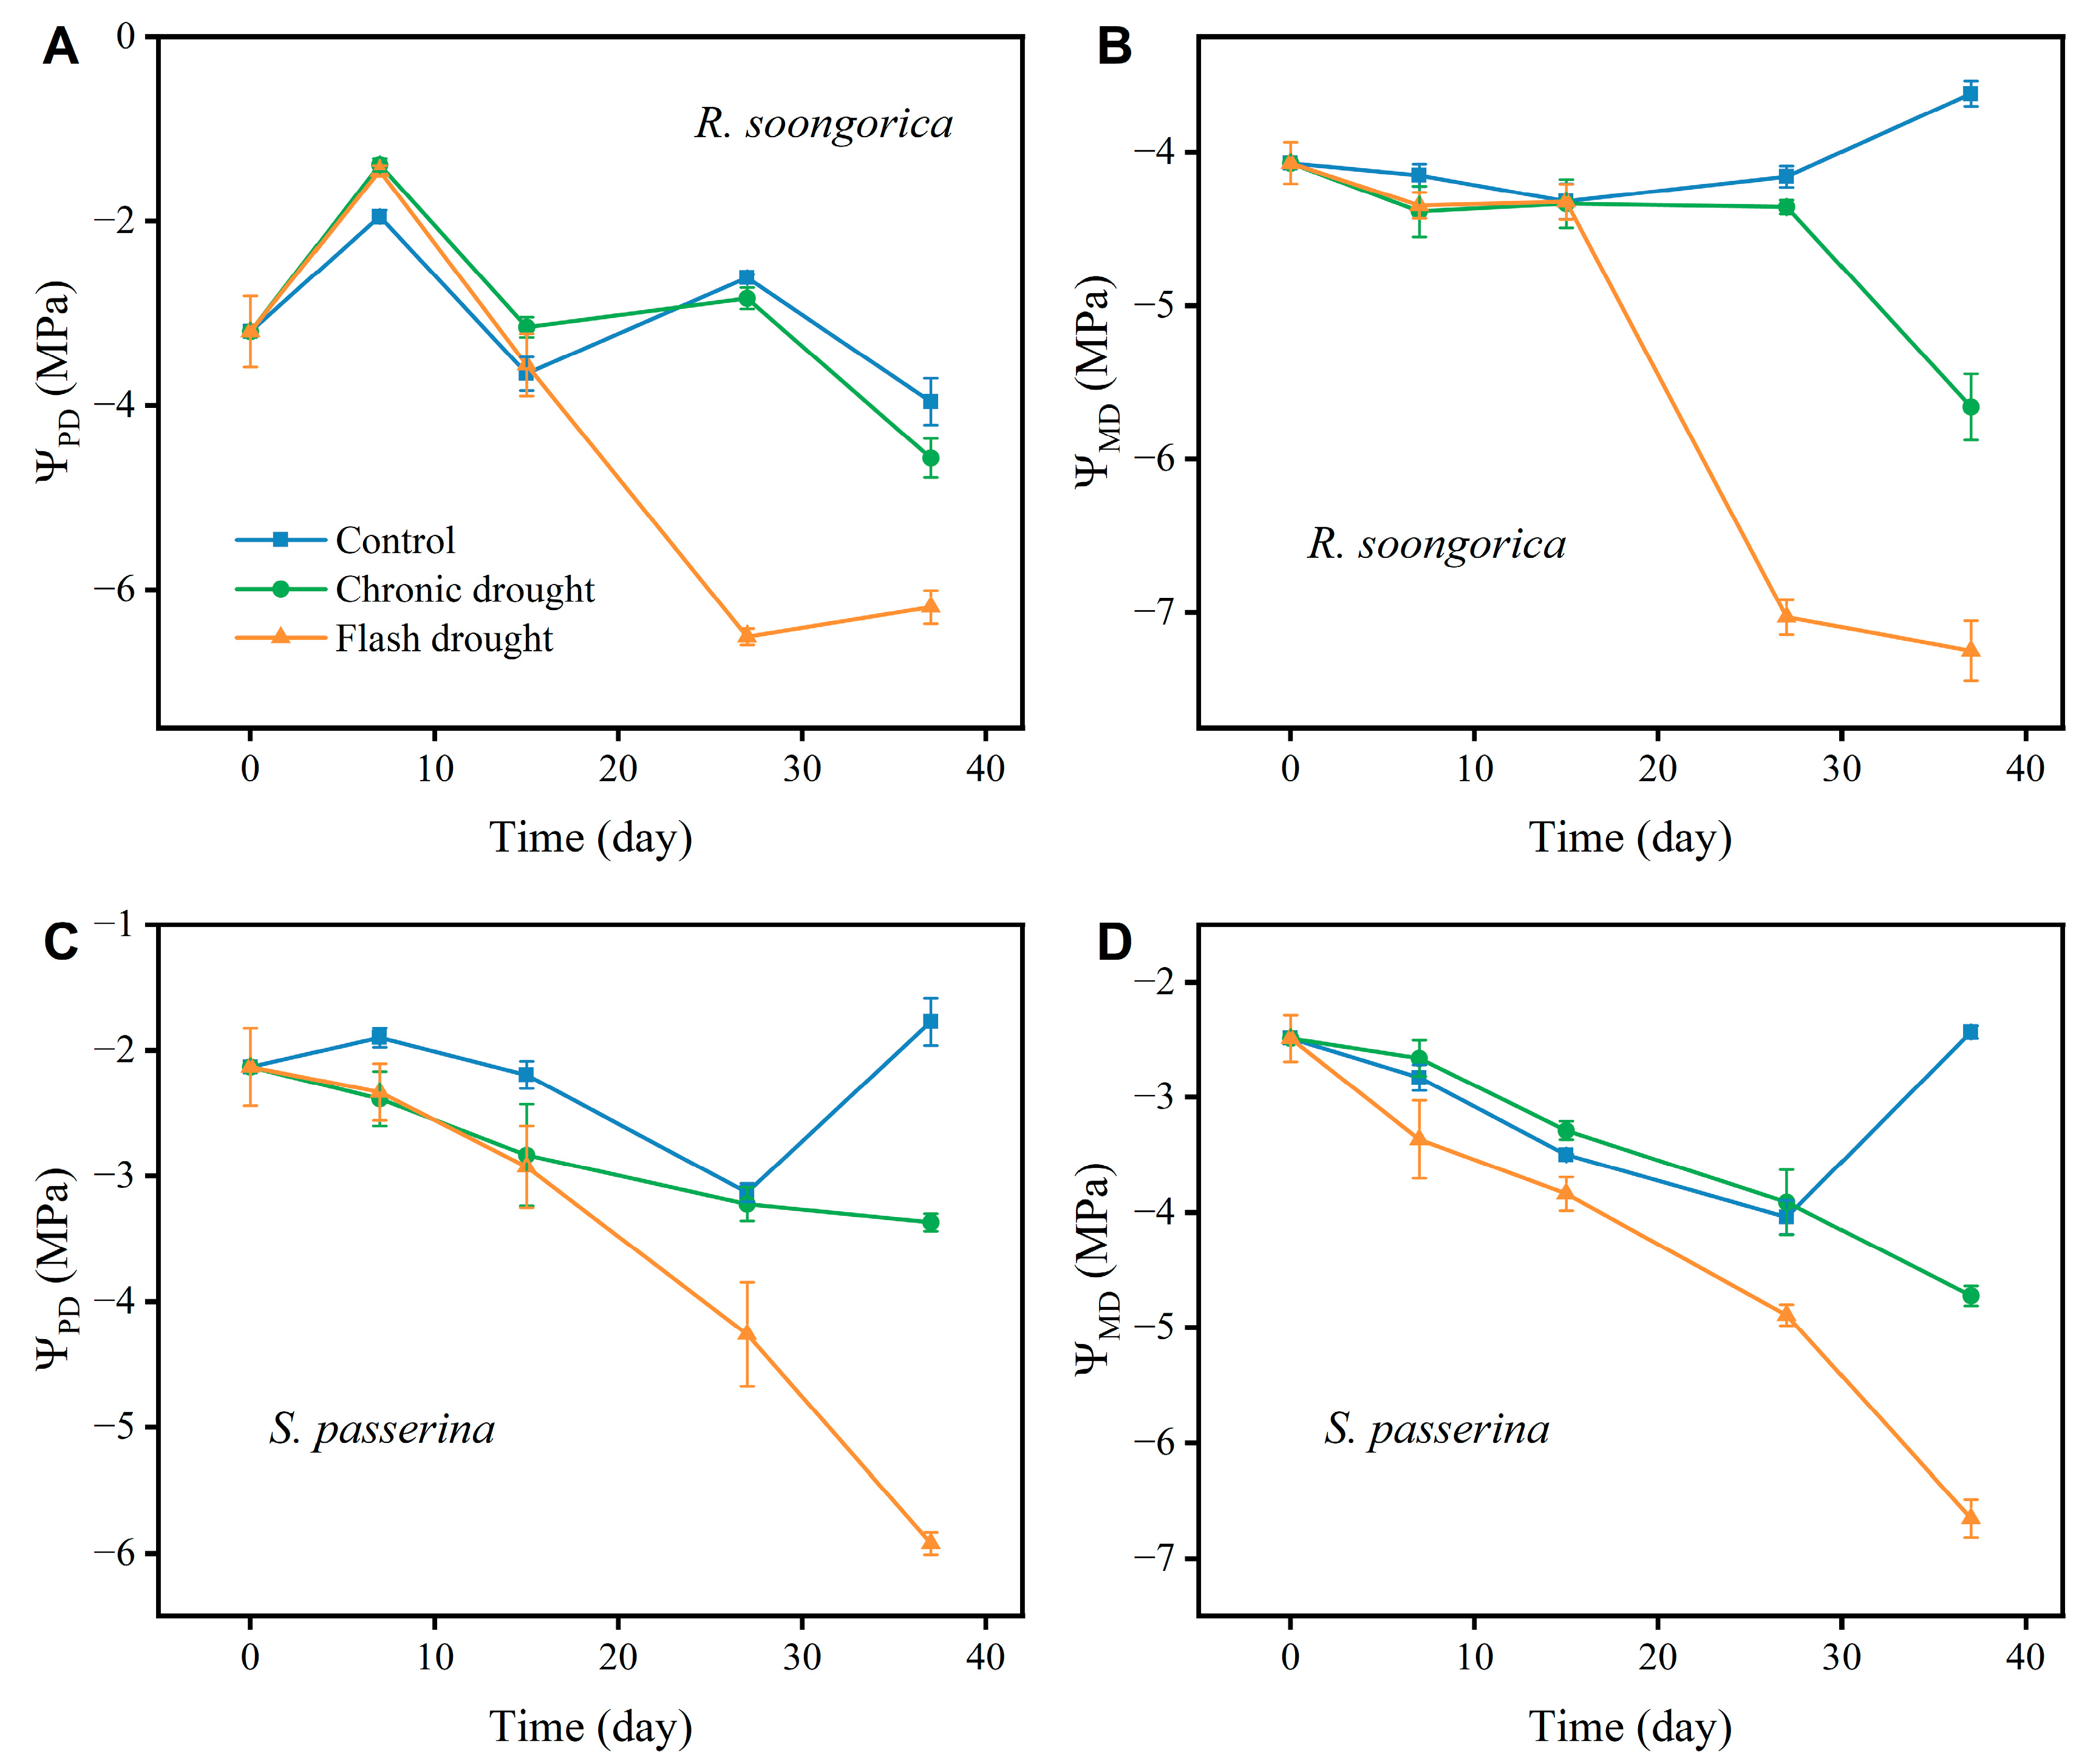
Figure 2.
Variation in water use efficiency (A–C), embolism resistance (D), leaf water potential (E,F), hydraulic safety margin (G), and leaf and stem water content (H,I) between different species or treatment. Lowercase letters indicate the variation between treatments for Reaumuria soongorica (Pall.) Maxim. traits (p < 0.05), and capital letters indicate the variation between treatments for Salsola passerina Bunge traits (p < 0.05). ‘*’ indicates significant differences between R. soongorica and S. passerina (p < 0.05), and ns indicates no difference (p > 0.05). Abbreviations: KS, sapwood specific conductivity; KL, leaf specific conductivity; Hv, Huber value; P50, pressure value in xylem at 50% loss of hydraulic conductivity; ΨPD, predawn leaf water potential; ΨMD, midday leaf water potential; HSM50, hydraulic safety margin; LWC, leaf water content; SWC, steam water content.
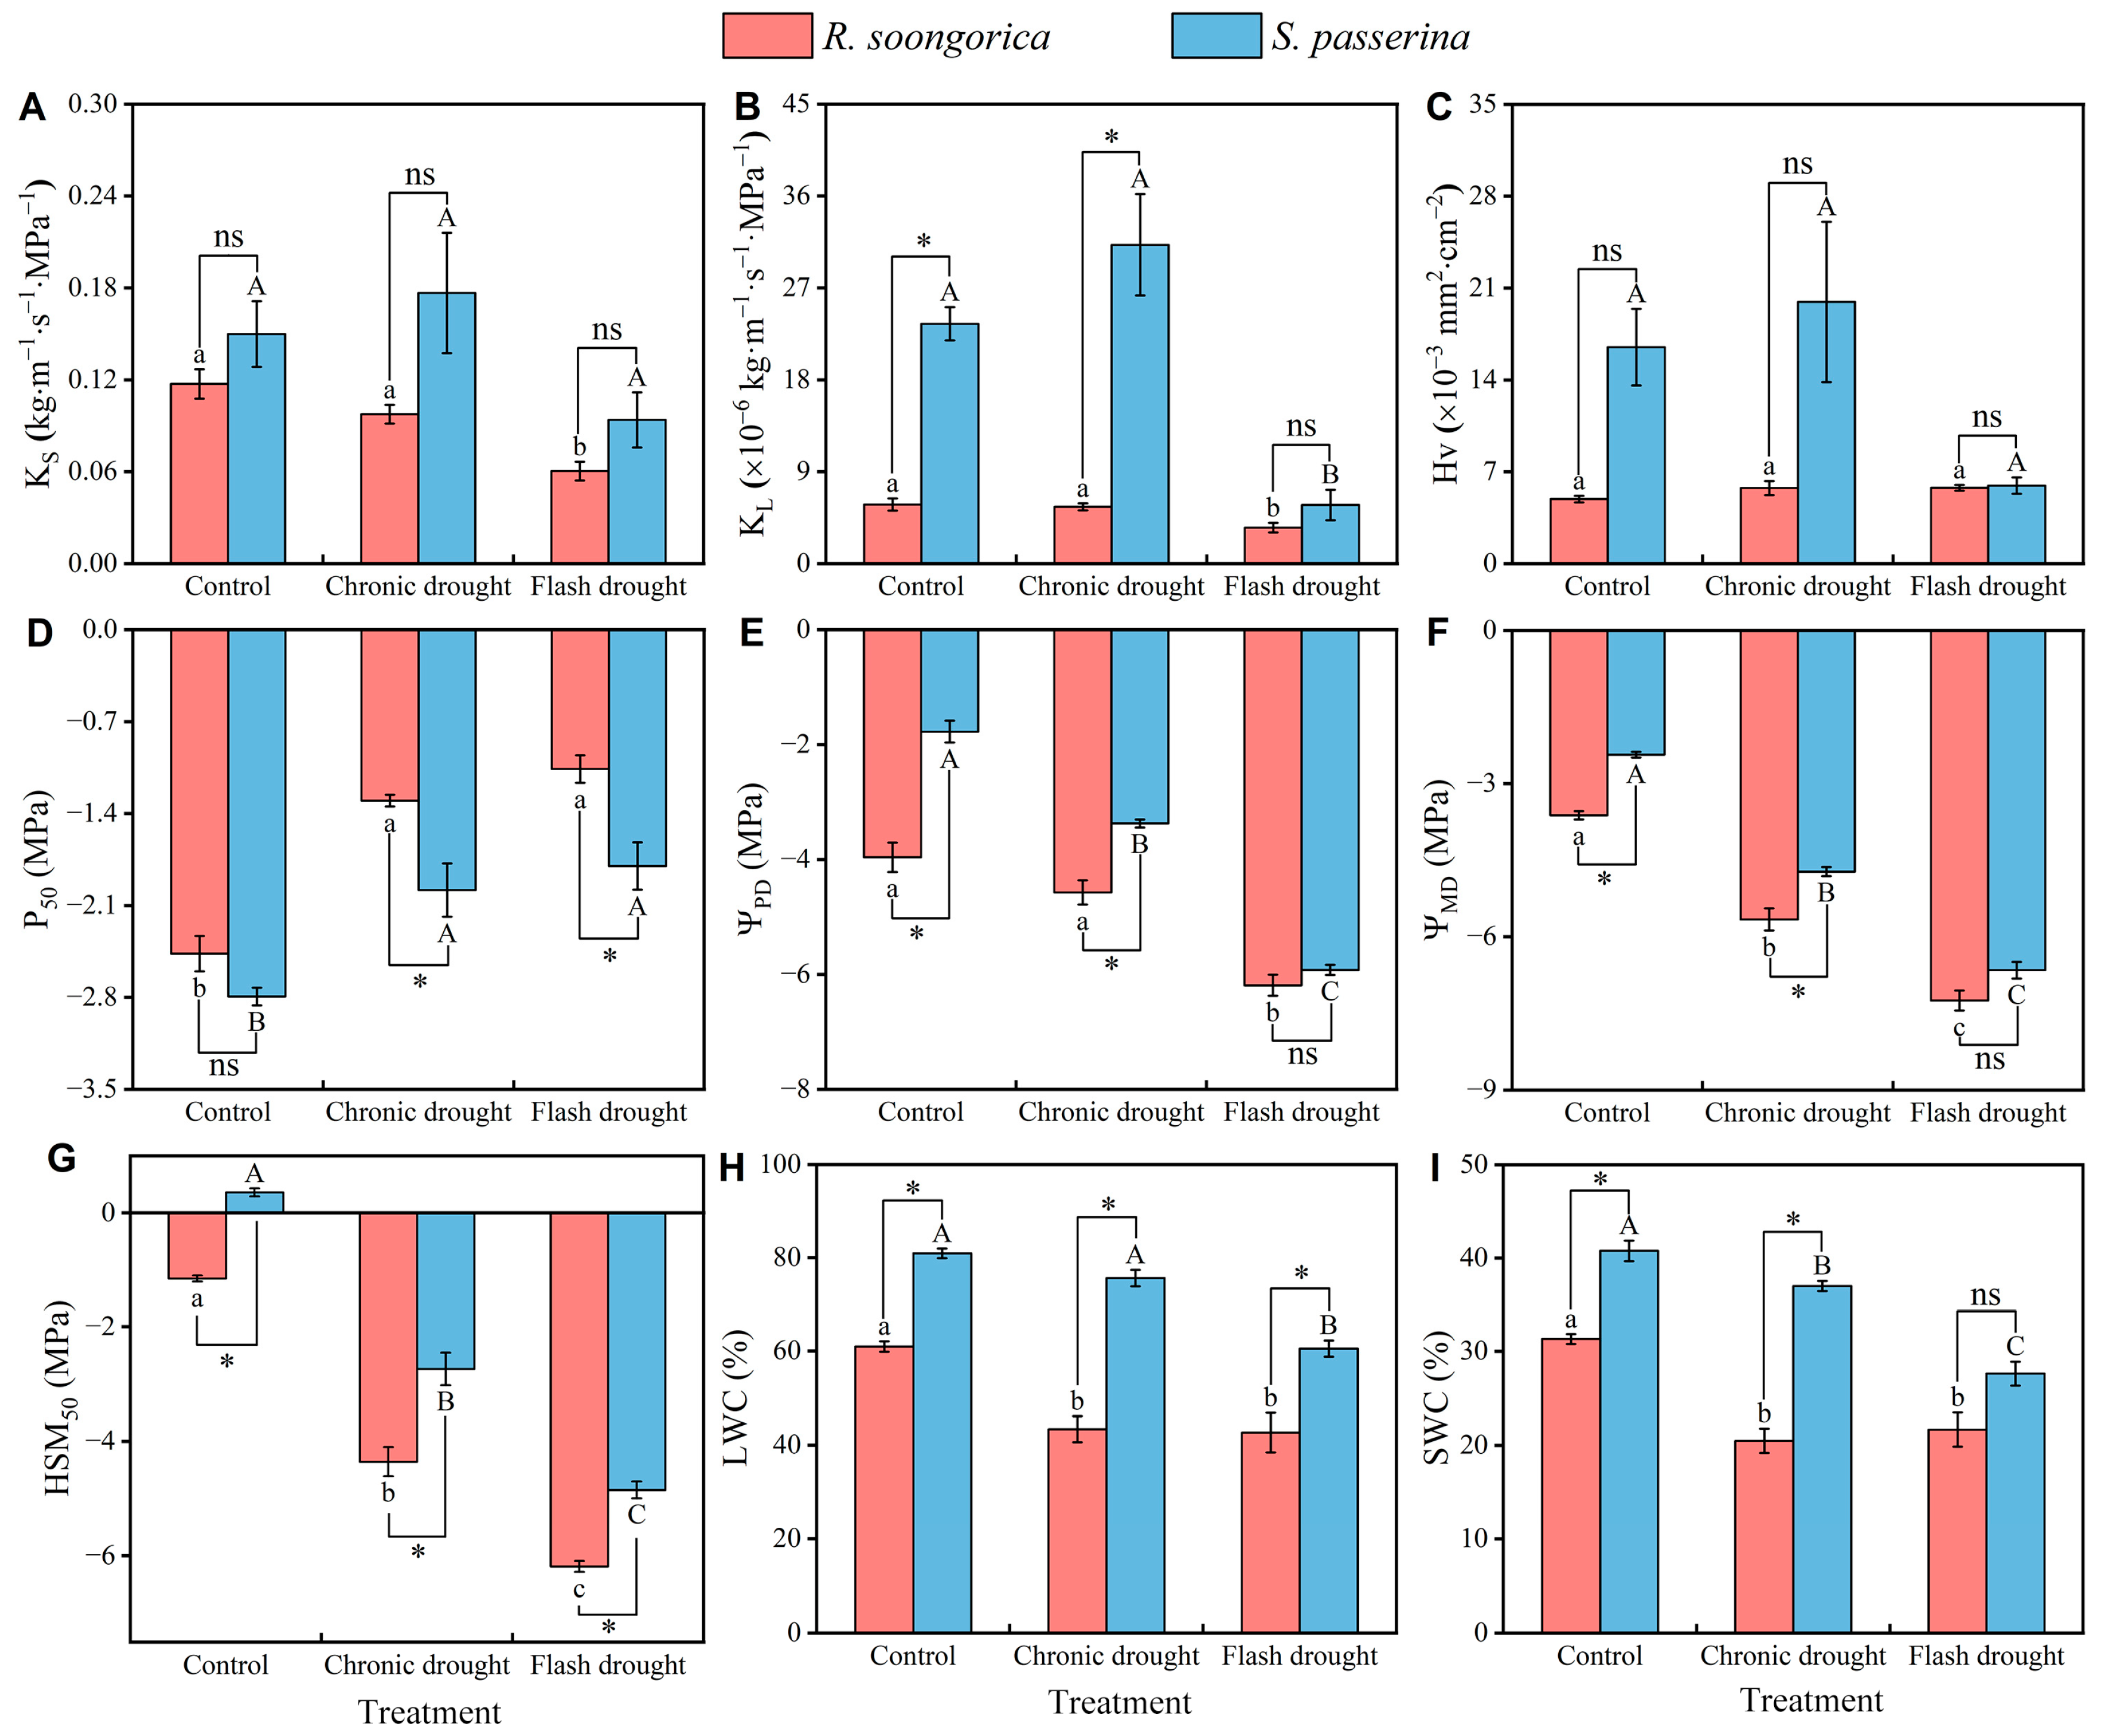
Figure 3.
Vulnerability curves of Reaumuria soongorica (Pall.) Maxim. (A) and Salsola passerina Bunge (B) under different drought treatments. Abbreviations: P50, pressure value in xylem at 50% loss of hydraulic conductivity.
Figure 3.
Vulnerability curves of Reaumuria soongorica (Pall.) Maxim. (A) and Salsola passerina Bunge (B) under different drought treatments. Abbreviations: P50, pressure value in xylem at 50% loss of hydraulic conductivity.
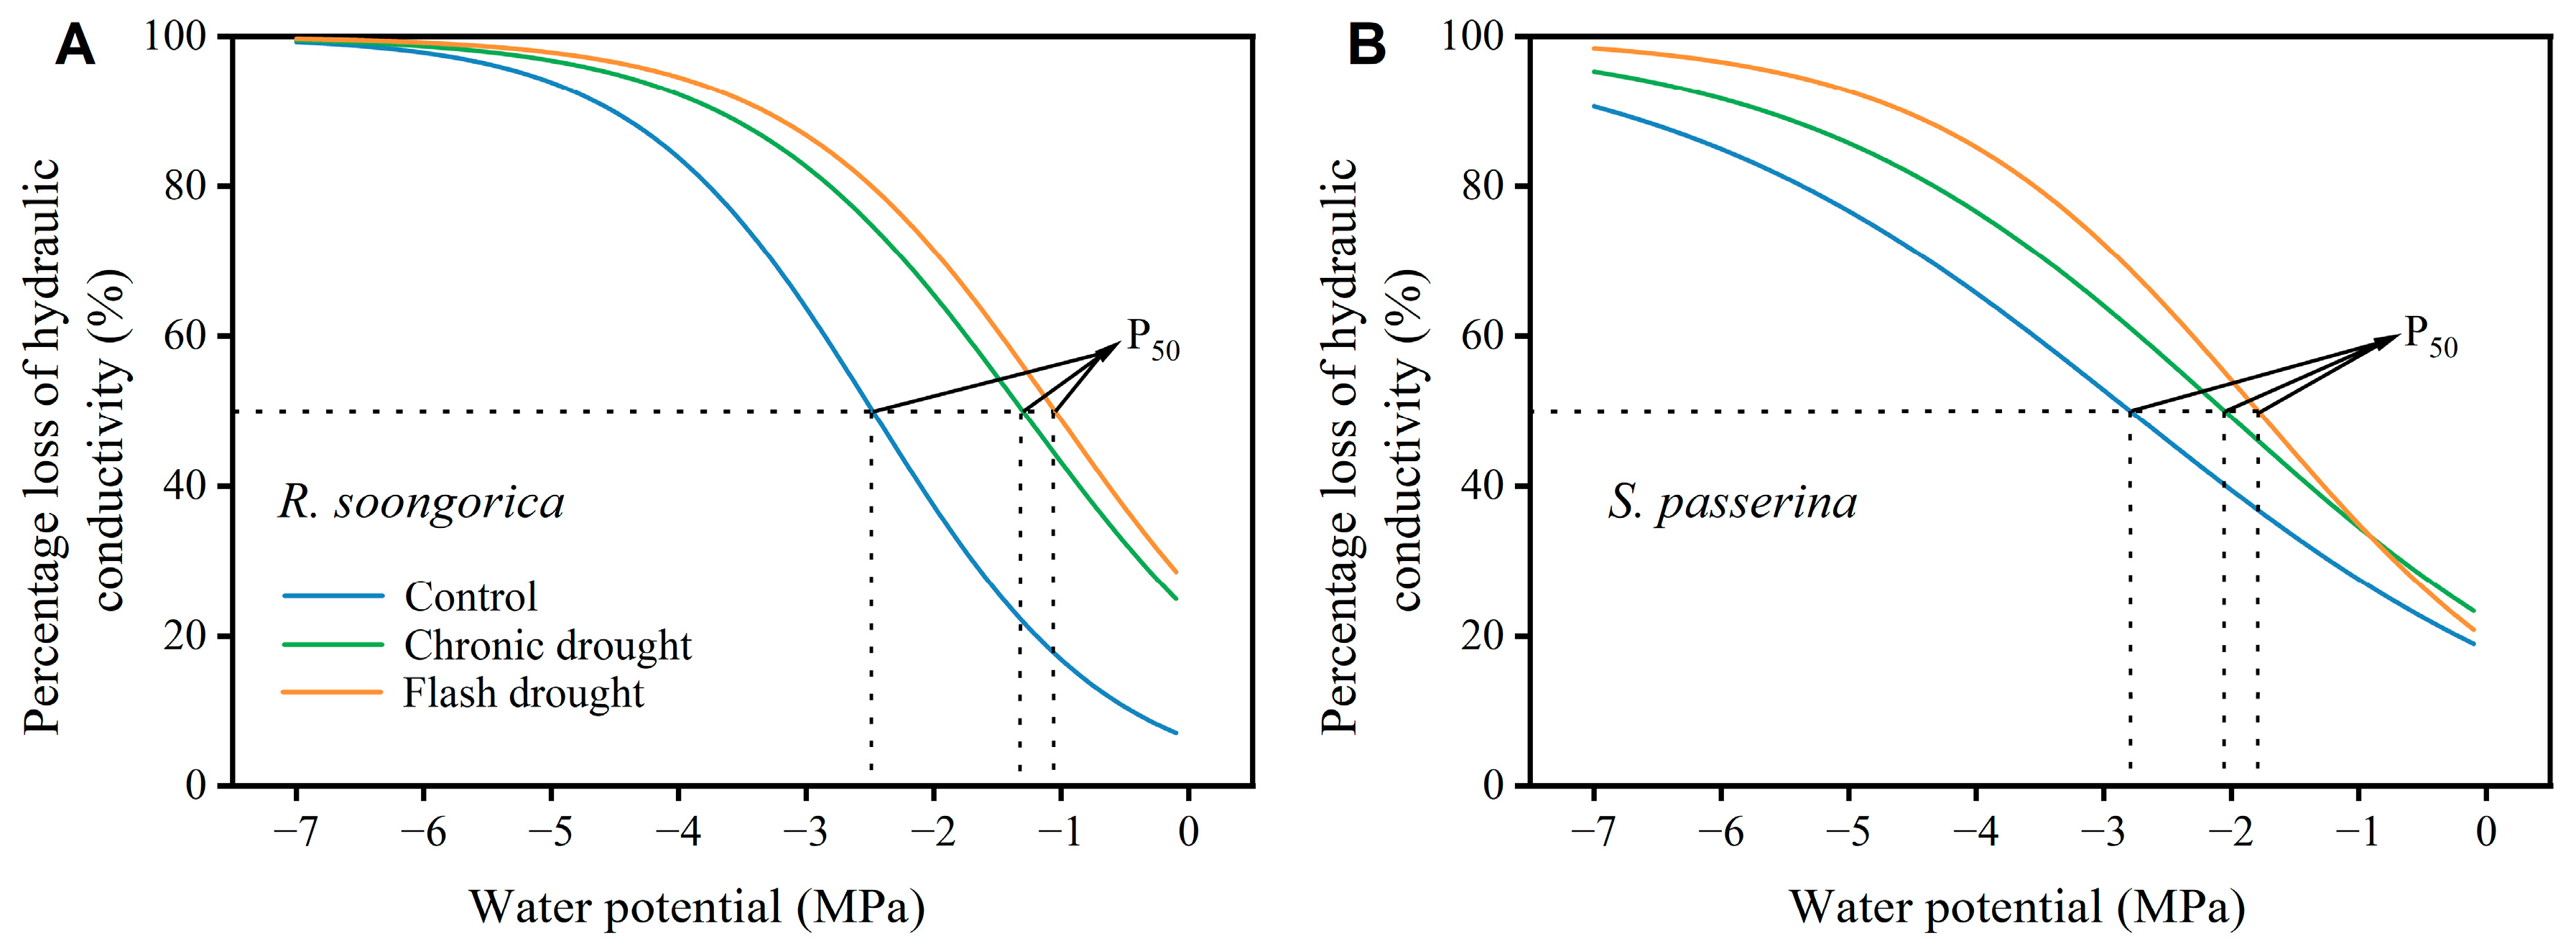
Figure 4.
Variation in soluble sugar concentration (A,E), starch concentration (B,F), ratio of soluble sugar to starch concentration (C,G), and non-structural carbon concentration (D,H) between different species or treatments. Lowercase letters indicate the variation between treatments for Reaumuria soongorica (Pall.) Maxim. traits (p < 0.05), and capital letters indicate the variation between treatments for Salsola passerina Bunge traits (p < 0.05). ‘*’ indicates significant differences between R. soongorica and S. passerina (p < 0.05), and ns indicates no difference (p > 0.05). Abbreviations: L-SSC, leaf soluble sugar concentration; L-SC, leaf starch concentration; L-SSC/L-SC, ratio of leaf soluble sugar to starch concentration; L-NSC, leaf non-structural carbon concentration; S-SSC, stem soluble sugar concentration; S-SC, stem starch concentration; S-SSC/S-SC, ratio of stem soluble sugar to starch concentration; S-NSC, stem non-structural carbon concentration.
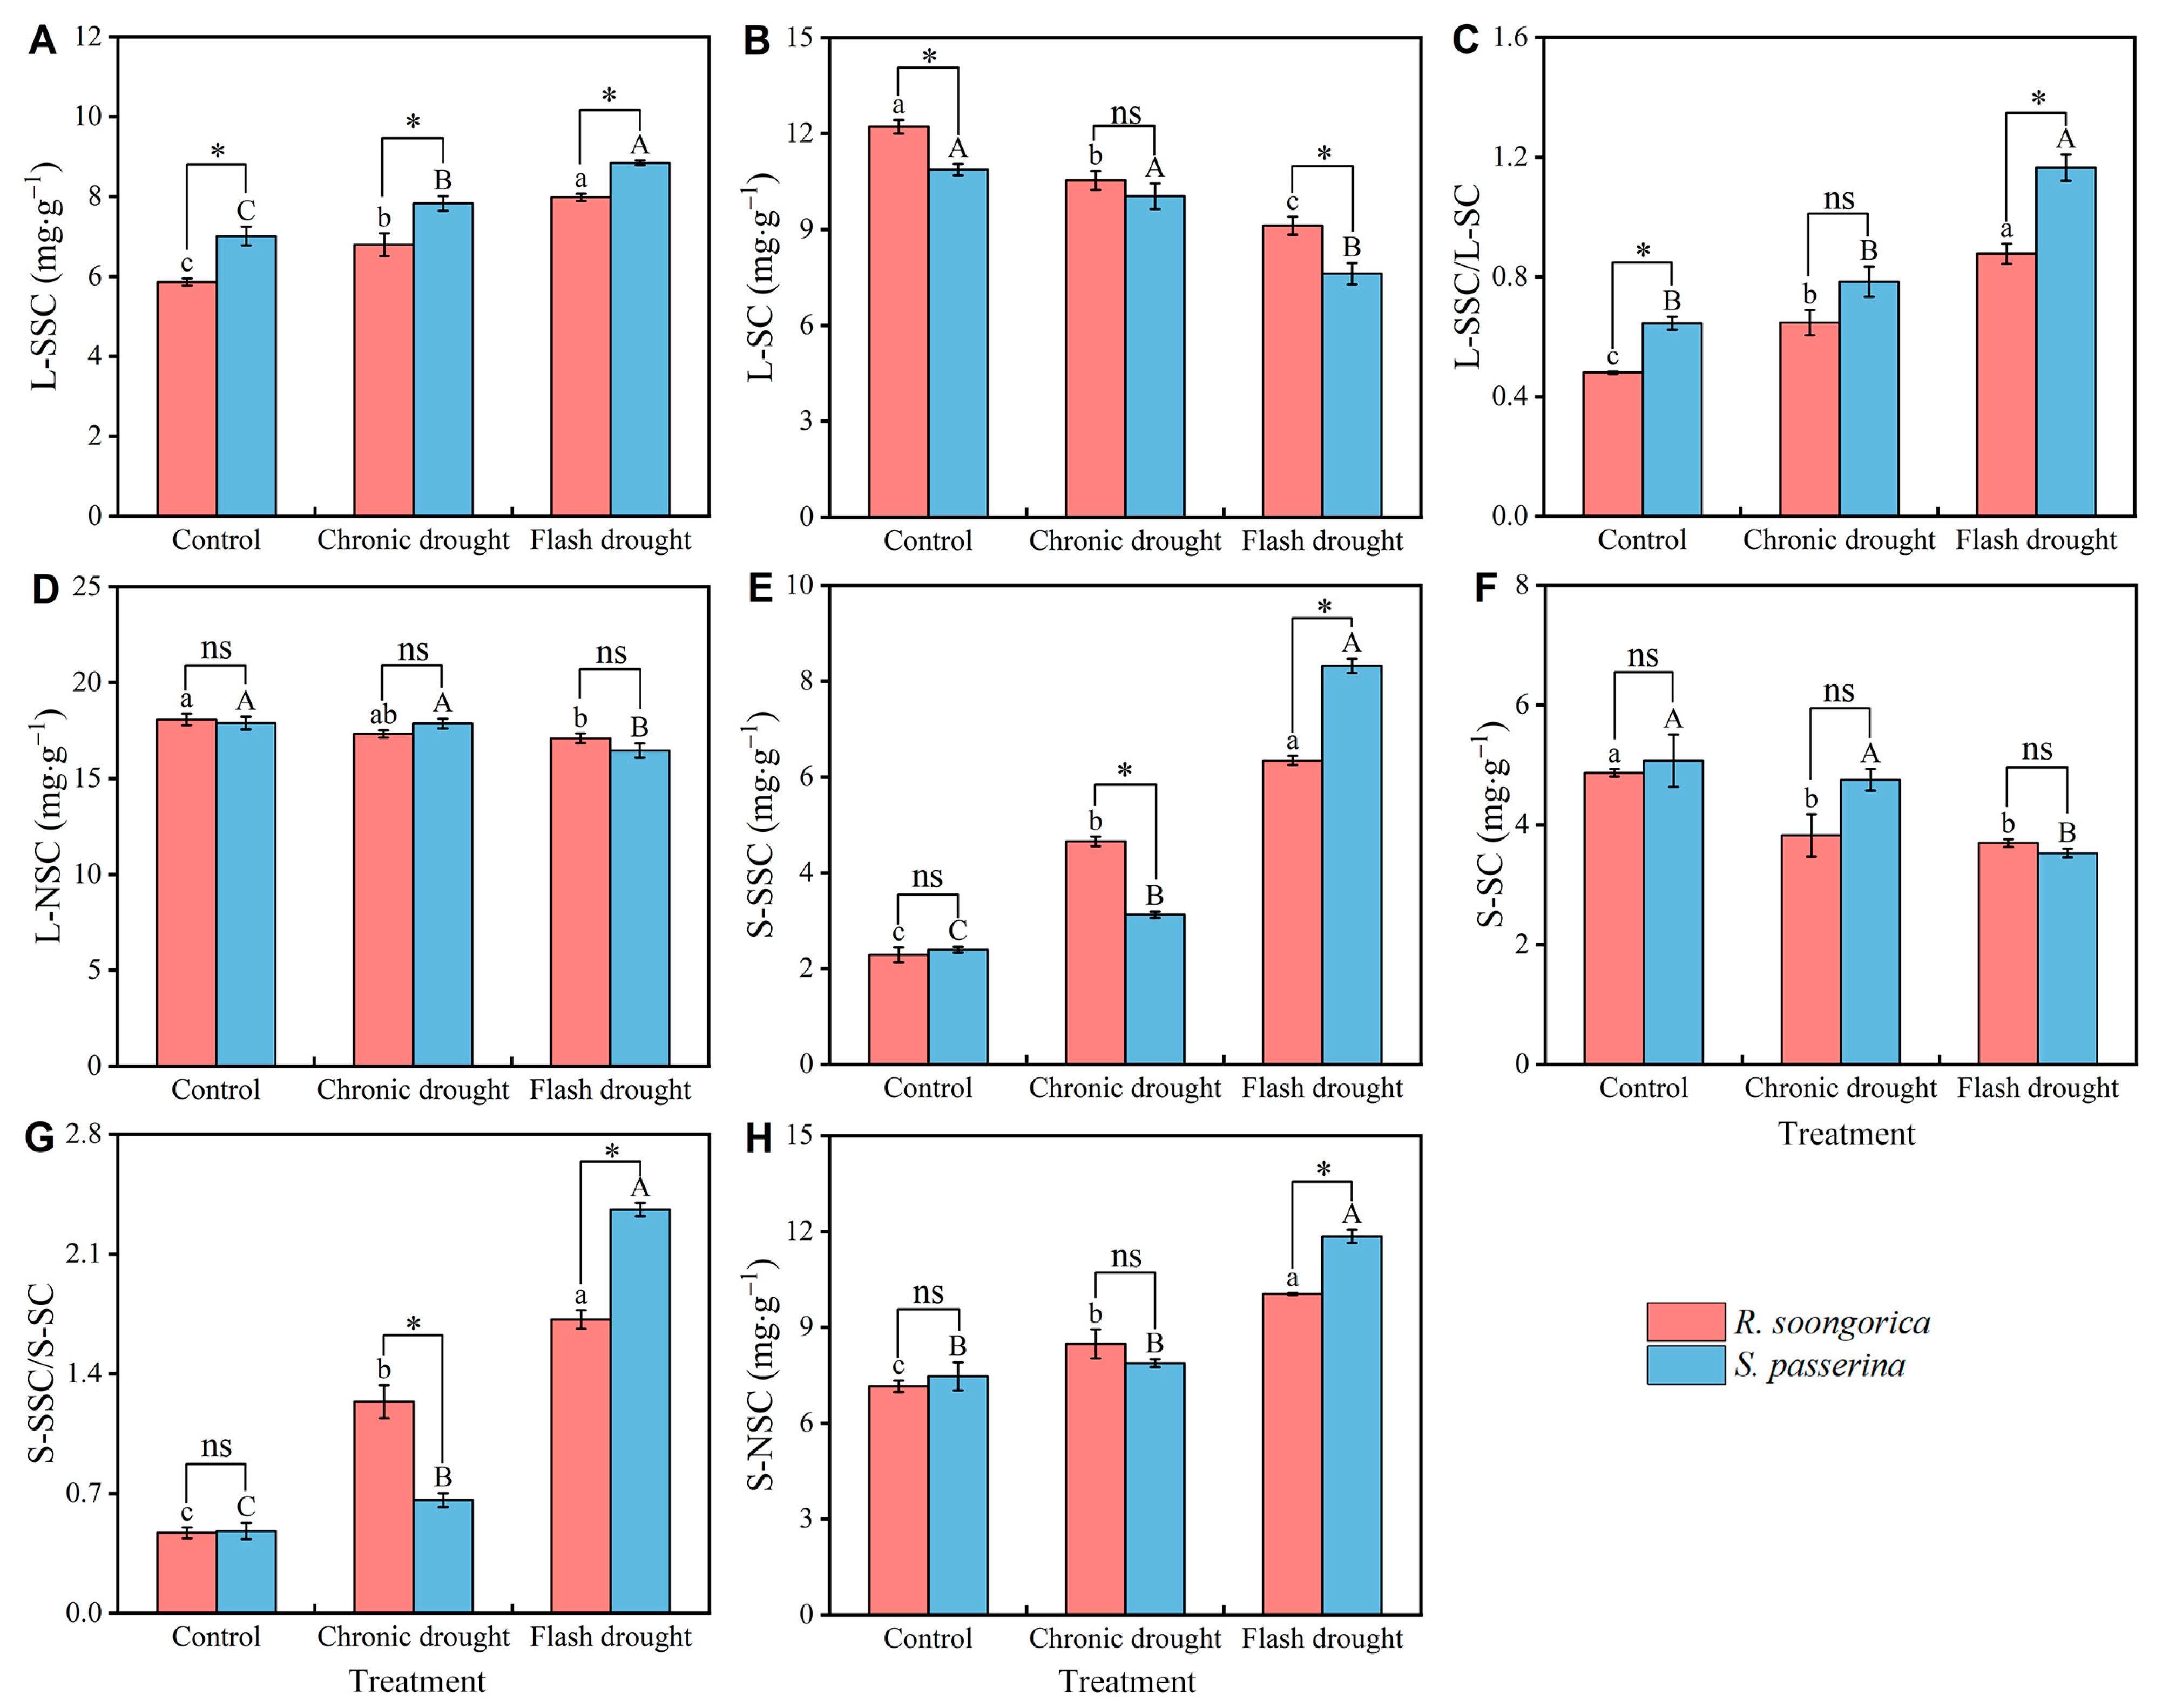
Figure 5.
Variation in stomatal conductance (A) and net photosynthetic rate (B) between species or treatments. Lowercase letters indicate the variation between treatments for Reaumuria soongorica (Pall.) Maxim.traits (p < 0.05), and capital letters indicate the variation between treatments for Salsola passerina Bunge traits (p < 0.05). ‘*’ indicates significant differences between R. soongorica and S. passerina (p < 0.05), and ns indicates no difference (p > 0.05). Abbreviations: gs, stomatal conductance; Pn, net photosynthetic rate.
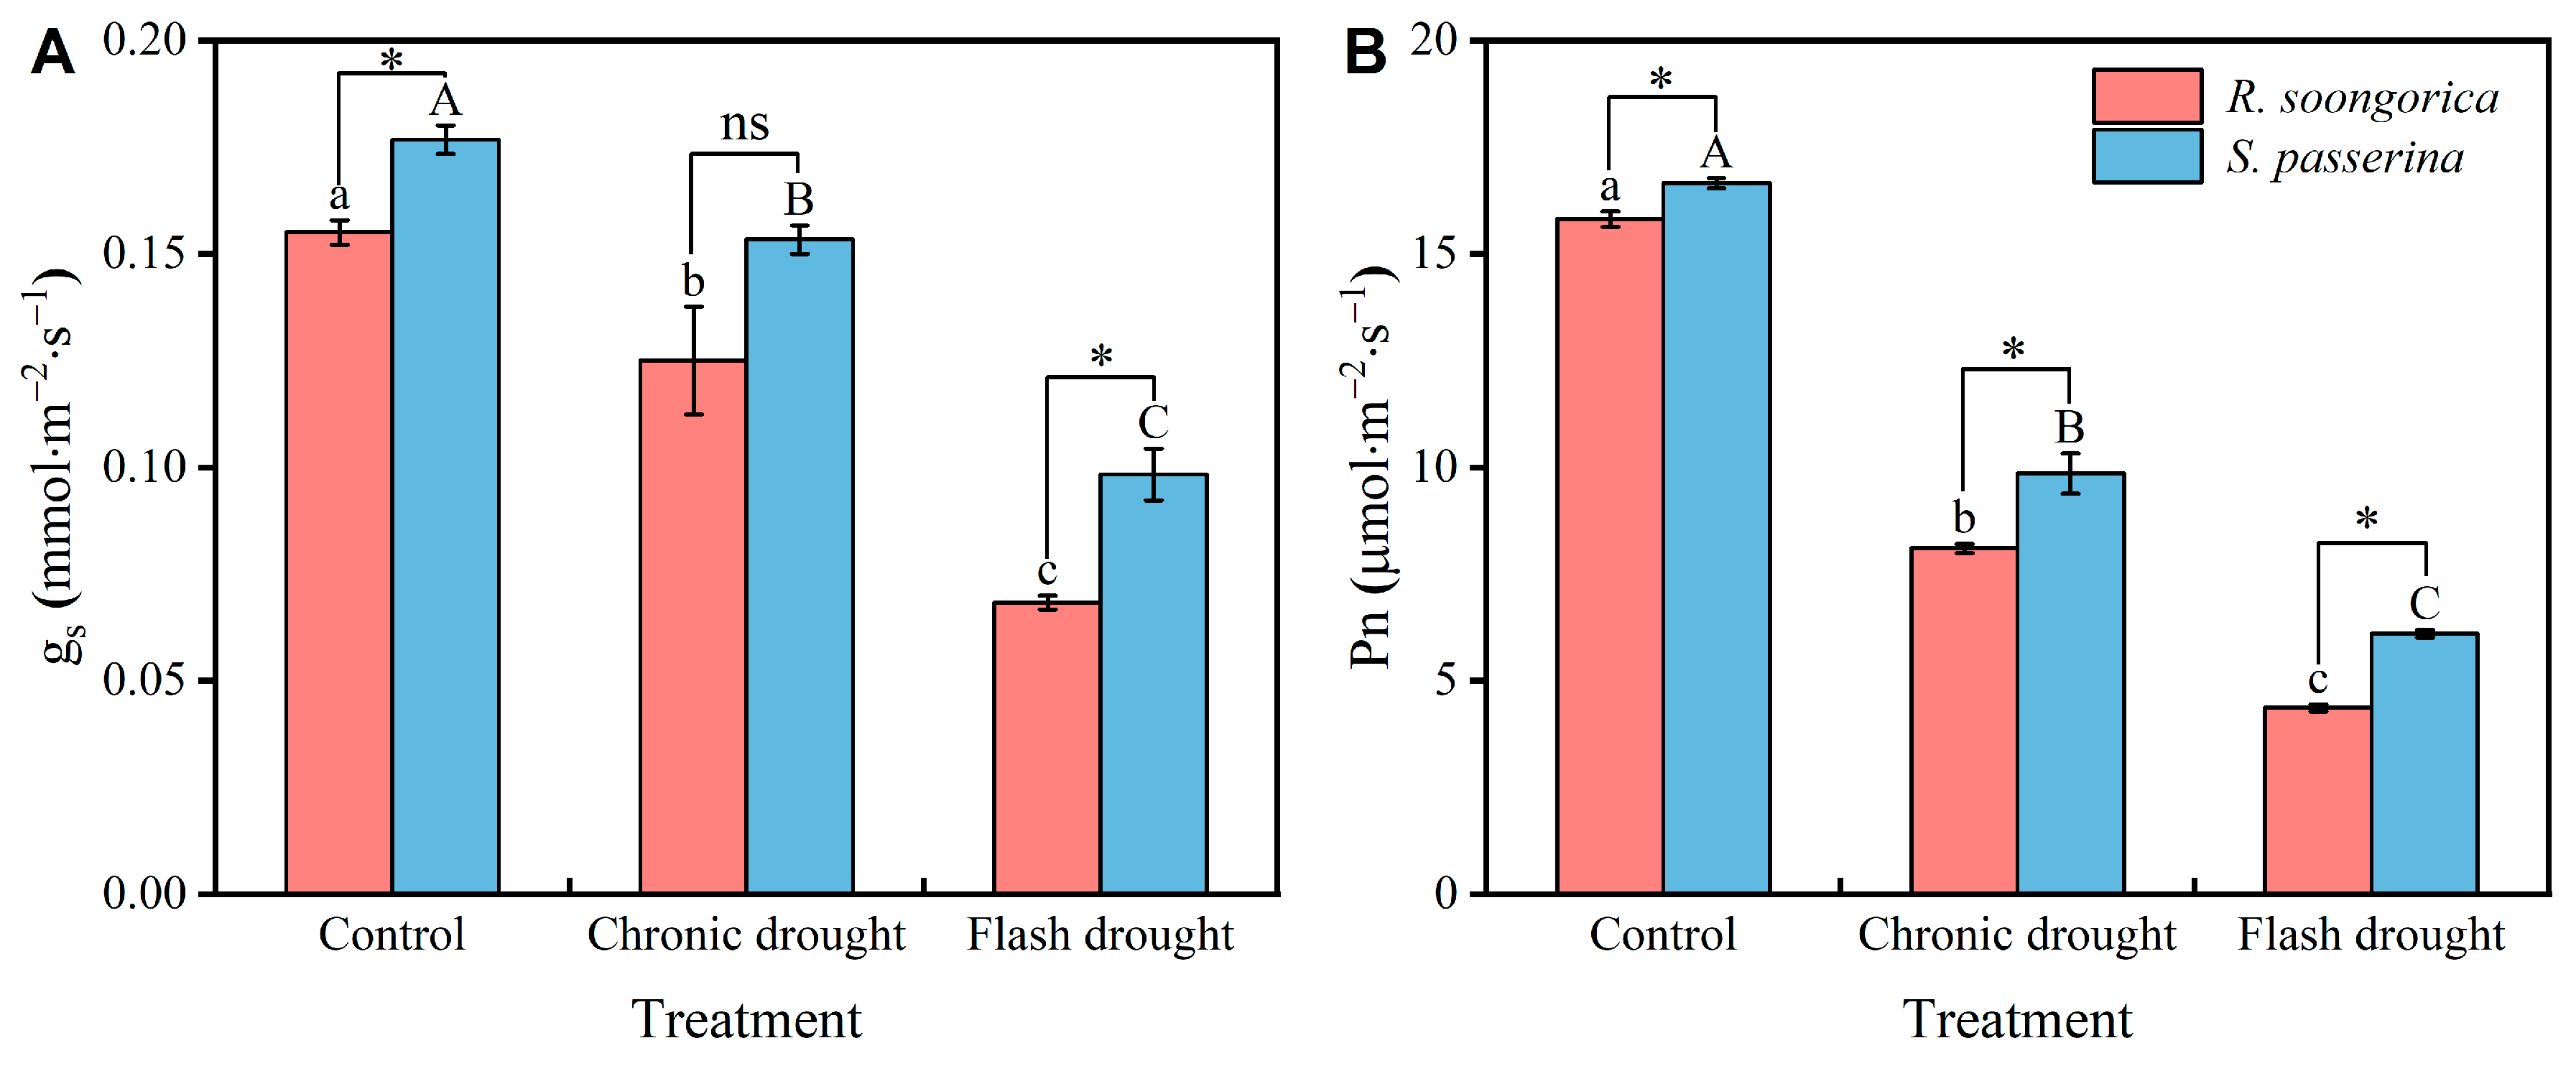
Figure 6.
Principal component analysis of Reaumuria soongorica (Pall.) Maxim. (A) and Salsola passerina Bunge (B) traits. Abbreviations: KS, sapwood specific conductivity; KL, leaf specific conductivity; Hv, Huber value; P50, pressure value in xylem at 50% loss of hydraulic conductivity; ΨPD, predawn leaf water potential ΨMD, midday leaf water potential; HSM50, hydraulic safety margin; LWC, leaf water content; SWC, steam water content; L-SSC, leaf soluble sugar concentration; L-SC, leaf starch concentration; L-NSC, leaf non-structural carbon concentration; S-SSC, stem soluble sugar concentration; S-SC, stem starch concentration; S-NSC, stem non-structural carbon concentration; gs, stomatal conductance; Pn, net photosynthetic rate.
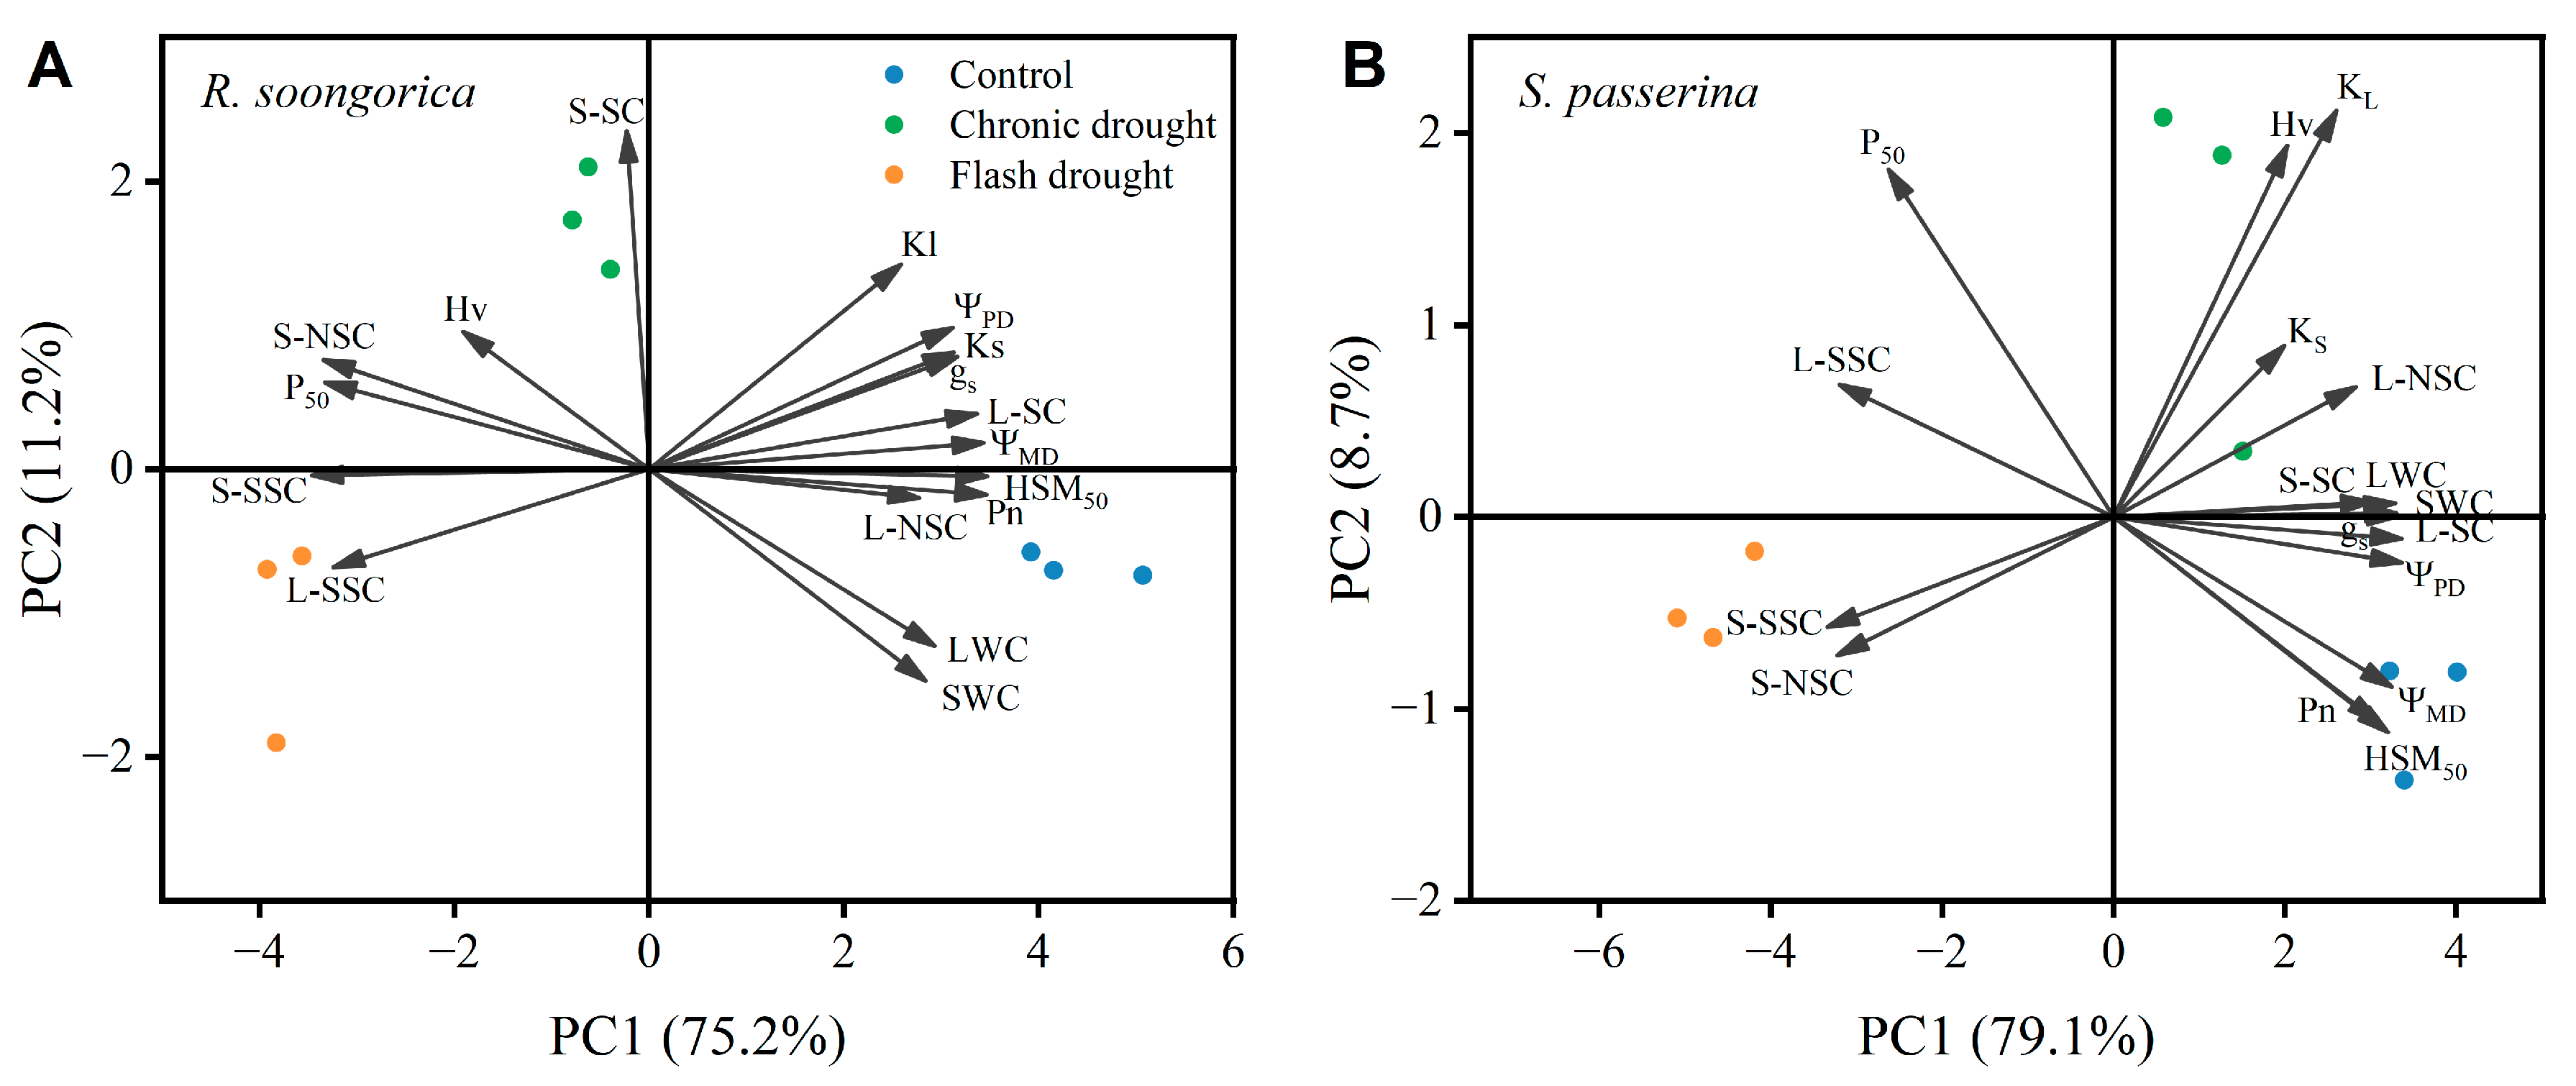
Figure 7.
Results of pathways from piecewise structural equation models (pSEM) demonstrating the relationship between the Reaumuria soongorica (Pall.) Maxim. (A) or Salsola passerina Bunge (B) traits, respectively. The weights of the solid arrows correspond to p-values, where the thickest is <0.001, intermediate is <0.01, and thinnest is <0.05. The dotted arrows correspond to p > 0.05. Values on each arrow indicate the standardized parameter coefficient estimates for each pathway. The final model shows Fischer’s C and p-values as well as R2 for each pathway. Abbreviations: KS, sapwood specific conductivity; ΨMD, midday leaf water potential; L-SSC, leaf soluble sugar concentration; L-SC, leaf starch concentration; S-SSC, stem soluble sugar concentration; S-SC, stem starch concentration; gs, stomatal conductance.
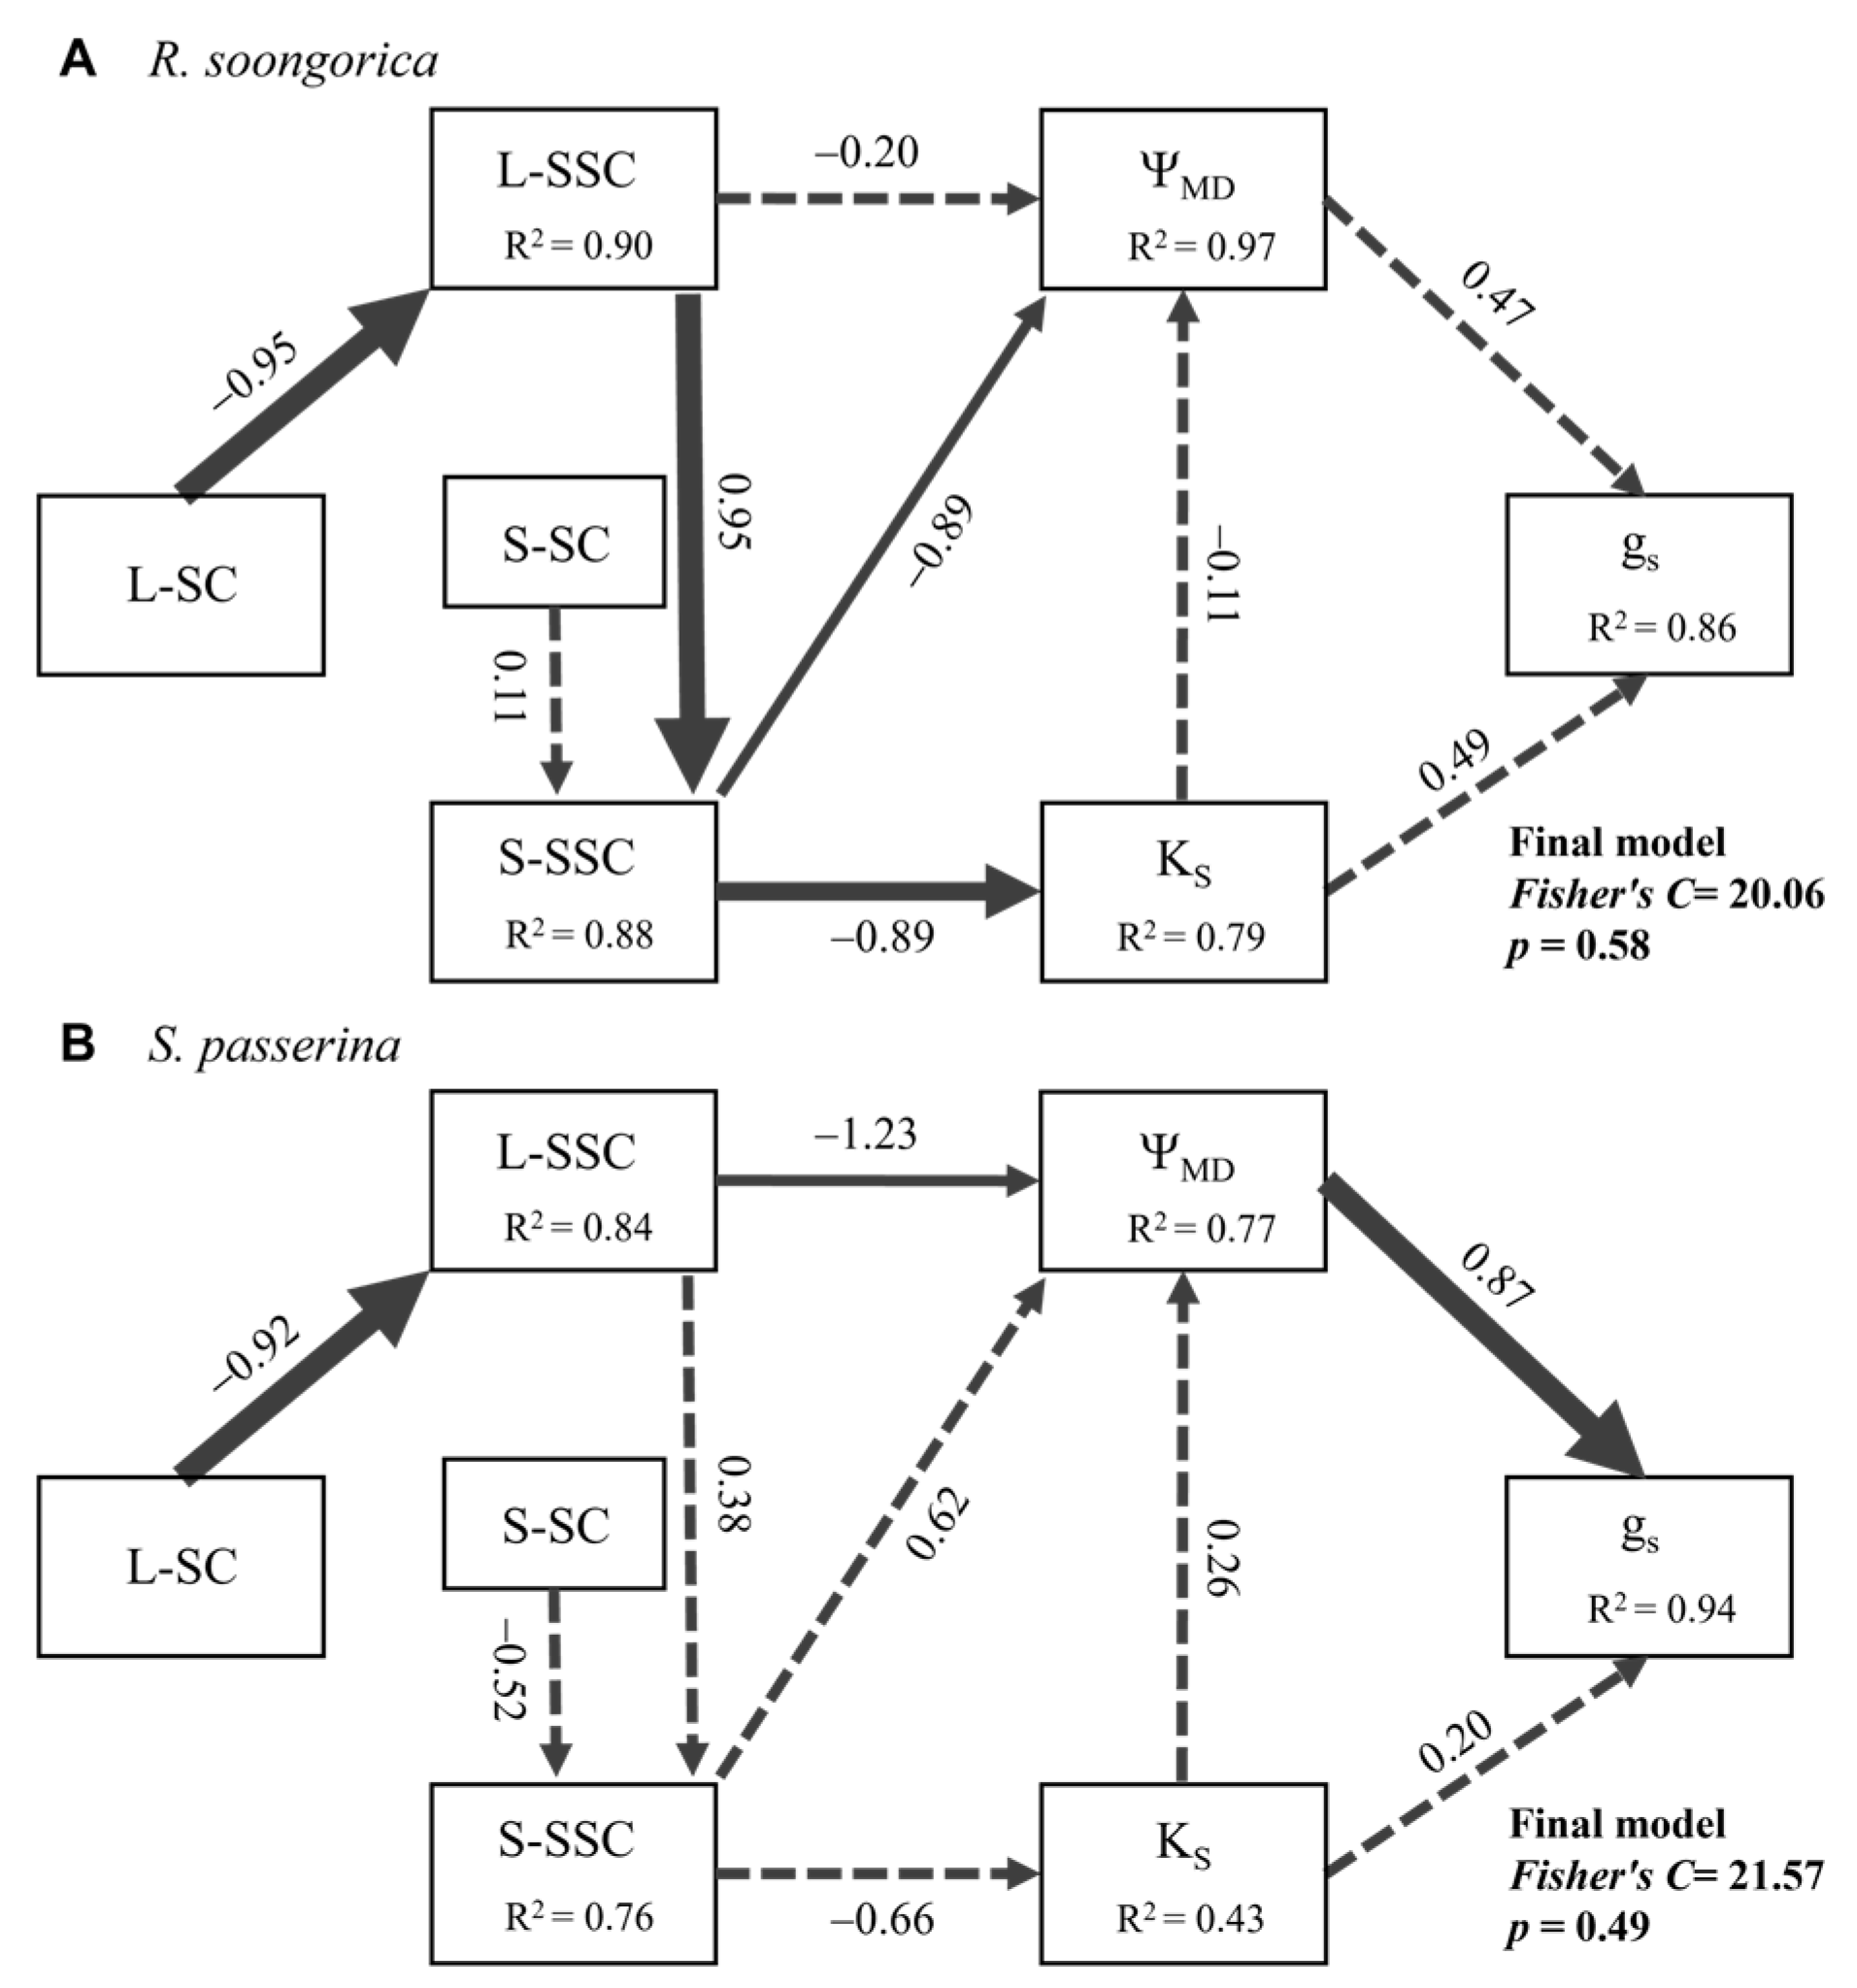
Table 1.
Results of two-way ANOVA for plant water relations traits. The values are F-values. ‘*’ indicates a significant effect (p < 0.05), and ‘**’ indicates a highly significant effect (p < 0.01). Abbreviations: KS, sapwood specific conductivity; KL, leaf specific conductivity; Hv, Huber value; P50, pressure value in xylem at 50% loss of hydraulic conductivity; ΨPD, predawn leaf water potential; ΨMD, midday leaf water potential; HSM50, hydraulic safety margin; LWC, leaf water content; SWC, steam water content.
| Traits | Species | Water Treatment | Species × Water Treatment |
|---|---|---|---|
| KS | 8.50 * | 5.48 * | 0.87 |
| KL | 68.92 ** | 20.15 ** | 14.13 ** |
| Hv | 14.39 ** | 3.30 | 3.57 |
| P50 | 27.98 ** | 45.18 ** | 1.37 |
| ΨPD | 69.80 ** | 164.43 ** | 14.44 ** |
| ΨMD | 57.03 ** | 358.24 ** | 2.04 |
| HSM50 | 107.14 ** | 431.23 ** | 0.33 |
| LWC | 146.64 ** | 33.92 ** | 5.40 * |
| SWC | 122.15 ** | 47.95 ** | 10.42 ** |
Table 2.
Results of two-way ANOVA for non-structural carbohydrates. The values are F-values. ‘*’ indicates a significant effect (p < 0.05), and ‘**’ indicates a highly significant effect (p < 0.01). Abbreviations: L-SSC, leaf soluble sugar concentration; L-SC, leaf starch concentration; L-NSC, leaf non-structural carbon concentration; S-SSC, stem soluble sugar concentration; S-SC, stem starch concentration; S-NSC, stem non-structural carbon concentration.
| Traits | Species | Water Treatment | Species × Water Treatment |
|---|---|---|---|
| L-SSC | 48.34 ** | 61.34 ** | 0.32 |
| L-SC | 21.60 ** | 59.72 ** | 1.69 |
| L-NSC | 0.17 | 9.03 ** | 2.10 |
| S-SSC | 4.13 | 1060.56 ** | 125.35 ** |
| S-SC | 2.55 | 12.48 ** | 5.36 * |
| S-NSC | 5.66 * | 128.18 ** | 26.12 ** |
Table 3.
Results of two-way ANOVA for stomatal conductance and net photosynthetic rate. The values are F-values. ‘**’ indicates a highly significant effect (p < 0.01). Abbreviations: gs, stomatal conductance; Pn, net photosynthetic rate.
Table 3.
Results of two-way ANOVA for stomatal conductance and net photosynthetic rate. The values are F-values. ‘**’ indicates a highly significant effect (p < 0.01). Abbreviations: gs, stomatal conductance; Pn, net photosynthetic rate.
| Traits | Species | Water Treatment | Species × Water Treatment |
|---|---|---|---|
| gs | 28.10 ** | 93.38 ** | 0.26 |
| Pn | 63.74 ** | 1280.85 ** | 2.779 |
[ad_2]