Influence of the Long-Term Application of Management Practices (Tillage, Cover Crop and Glyphosate) on Greenhouse Gas Emissions and Soil Physical Properties
[ad_1]
Author Contributions
Conceptualization, G.K.; methodology, M.O.D., G.K., A.V. and S.S.; software, M.O.D. and G.K.; validation, M.O.D., G.K. and S.S.; formal analysis, M.O.D., G.K., A.V., L.M. and S.S.; investigation, M.O.D., G.K., A.V., L.M. and S.S.; data curation, M.O.D.; writing—original draft preparation, M.O.D.; writing—review and editing, S.S. and G.K.; visualization, M.O.D. and G.K.; supervision, S.S. and G.K.; project administration, S.S. and G.K.; funding acquisition, S.S., L.M. and G.K. All authors have read and agreed to the published version of the manuscript.
Figure 1.
The static chamber boxes at the 2nd and the 5th GHG samplings.
Figure 1.
The static chamber boxes at the 2nd and the 5th GHG samplings.
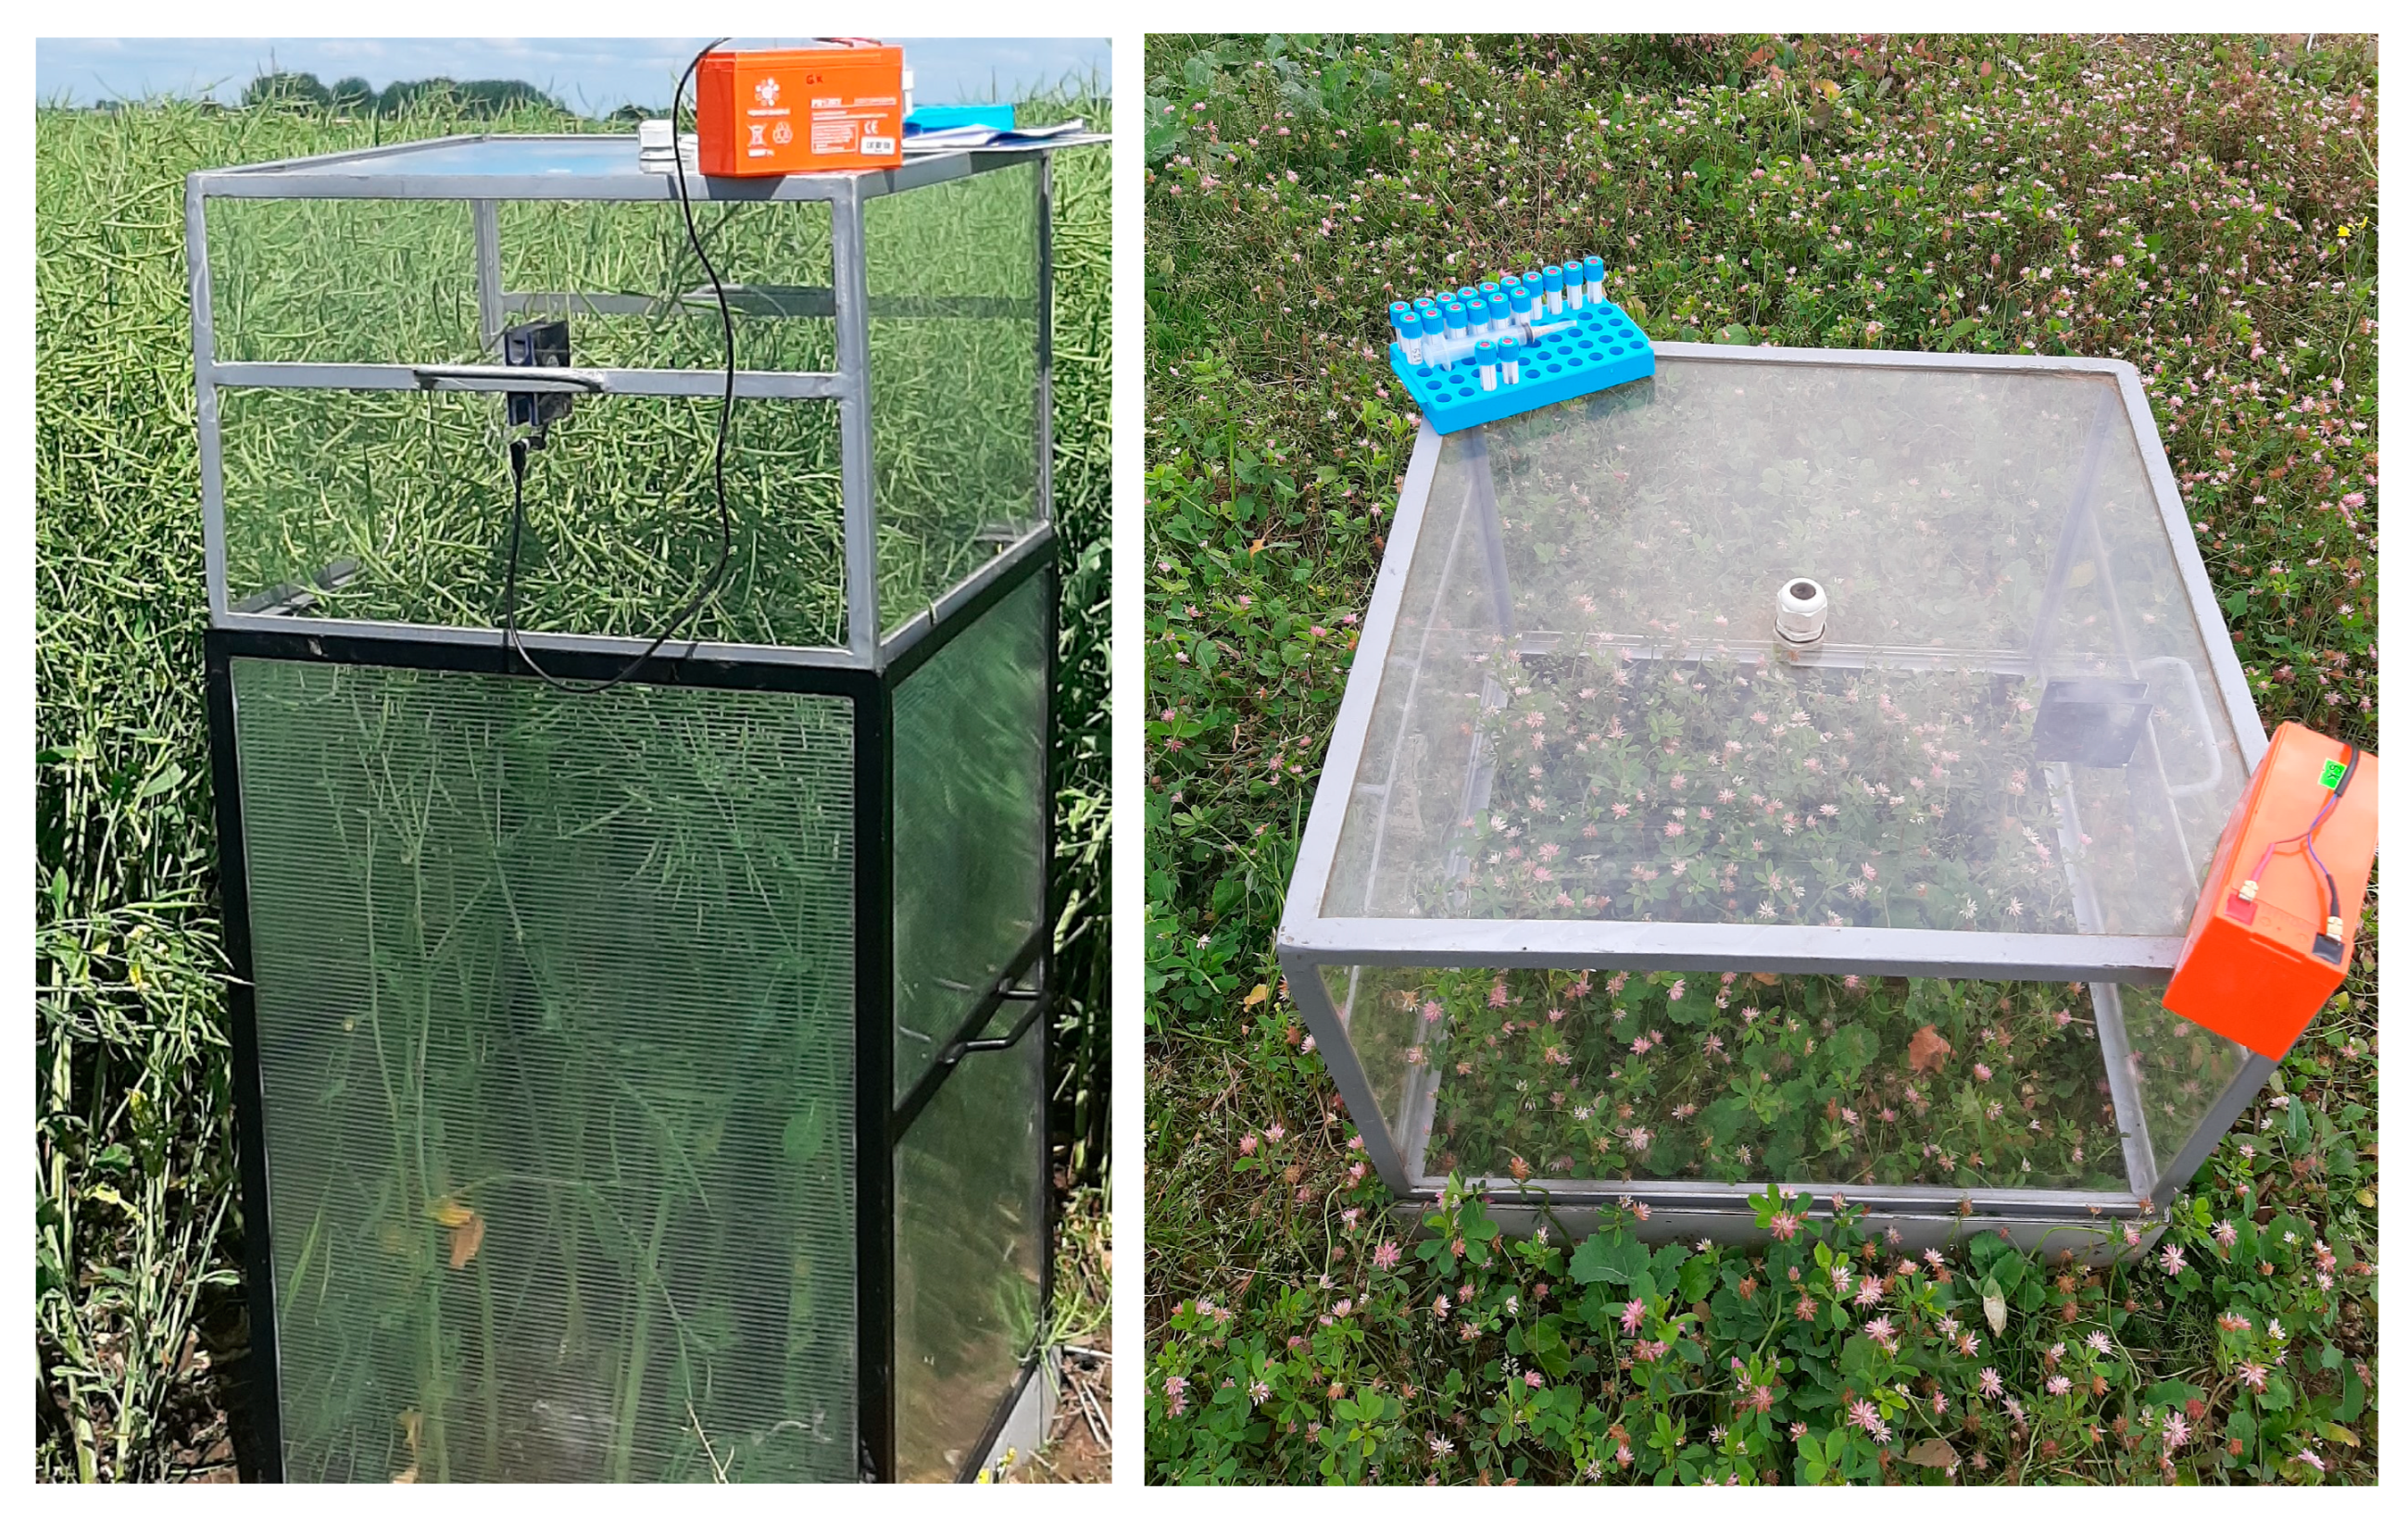
Figure 2.
CO2 fluxes under different management practices during the crop growing season. 1—(ploughing, −CC, −G), 1G—(ploughing, −CC, +G), 1T—(ploughing, +CC, −G), 1TG—(ploughing, +CC, +G), 3—(harrowing, −CC, −G), 3G—(harrowing, −CC, +G), 3T—(harrowing, +CC, −G), 3TG—(harrowing, +CC, +G), 5—(no till, −CC, −G), 5G—(no till, −CC, +G), 5T—(no till, +CC, −G), and 5TG—(no till, +CC, +G). Note: CC—cover crops, G—glyphosate, − negative, + positive. ** indicates significant differences at p < 0.01; * indicates significant differences at p < 0.05; WS indicates the data obtained from the closest weather station (distance < 0.5 km).
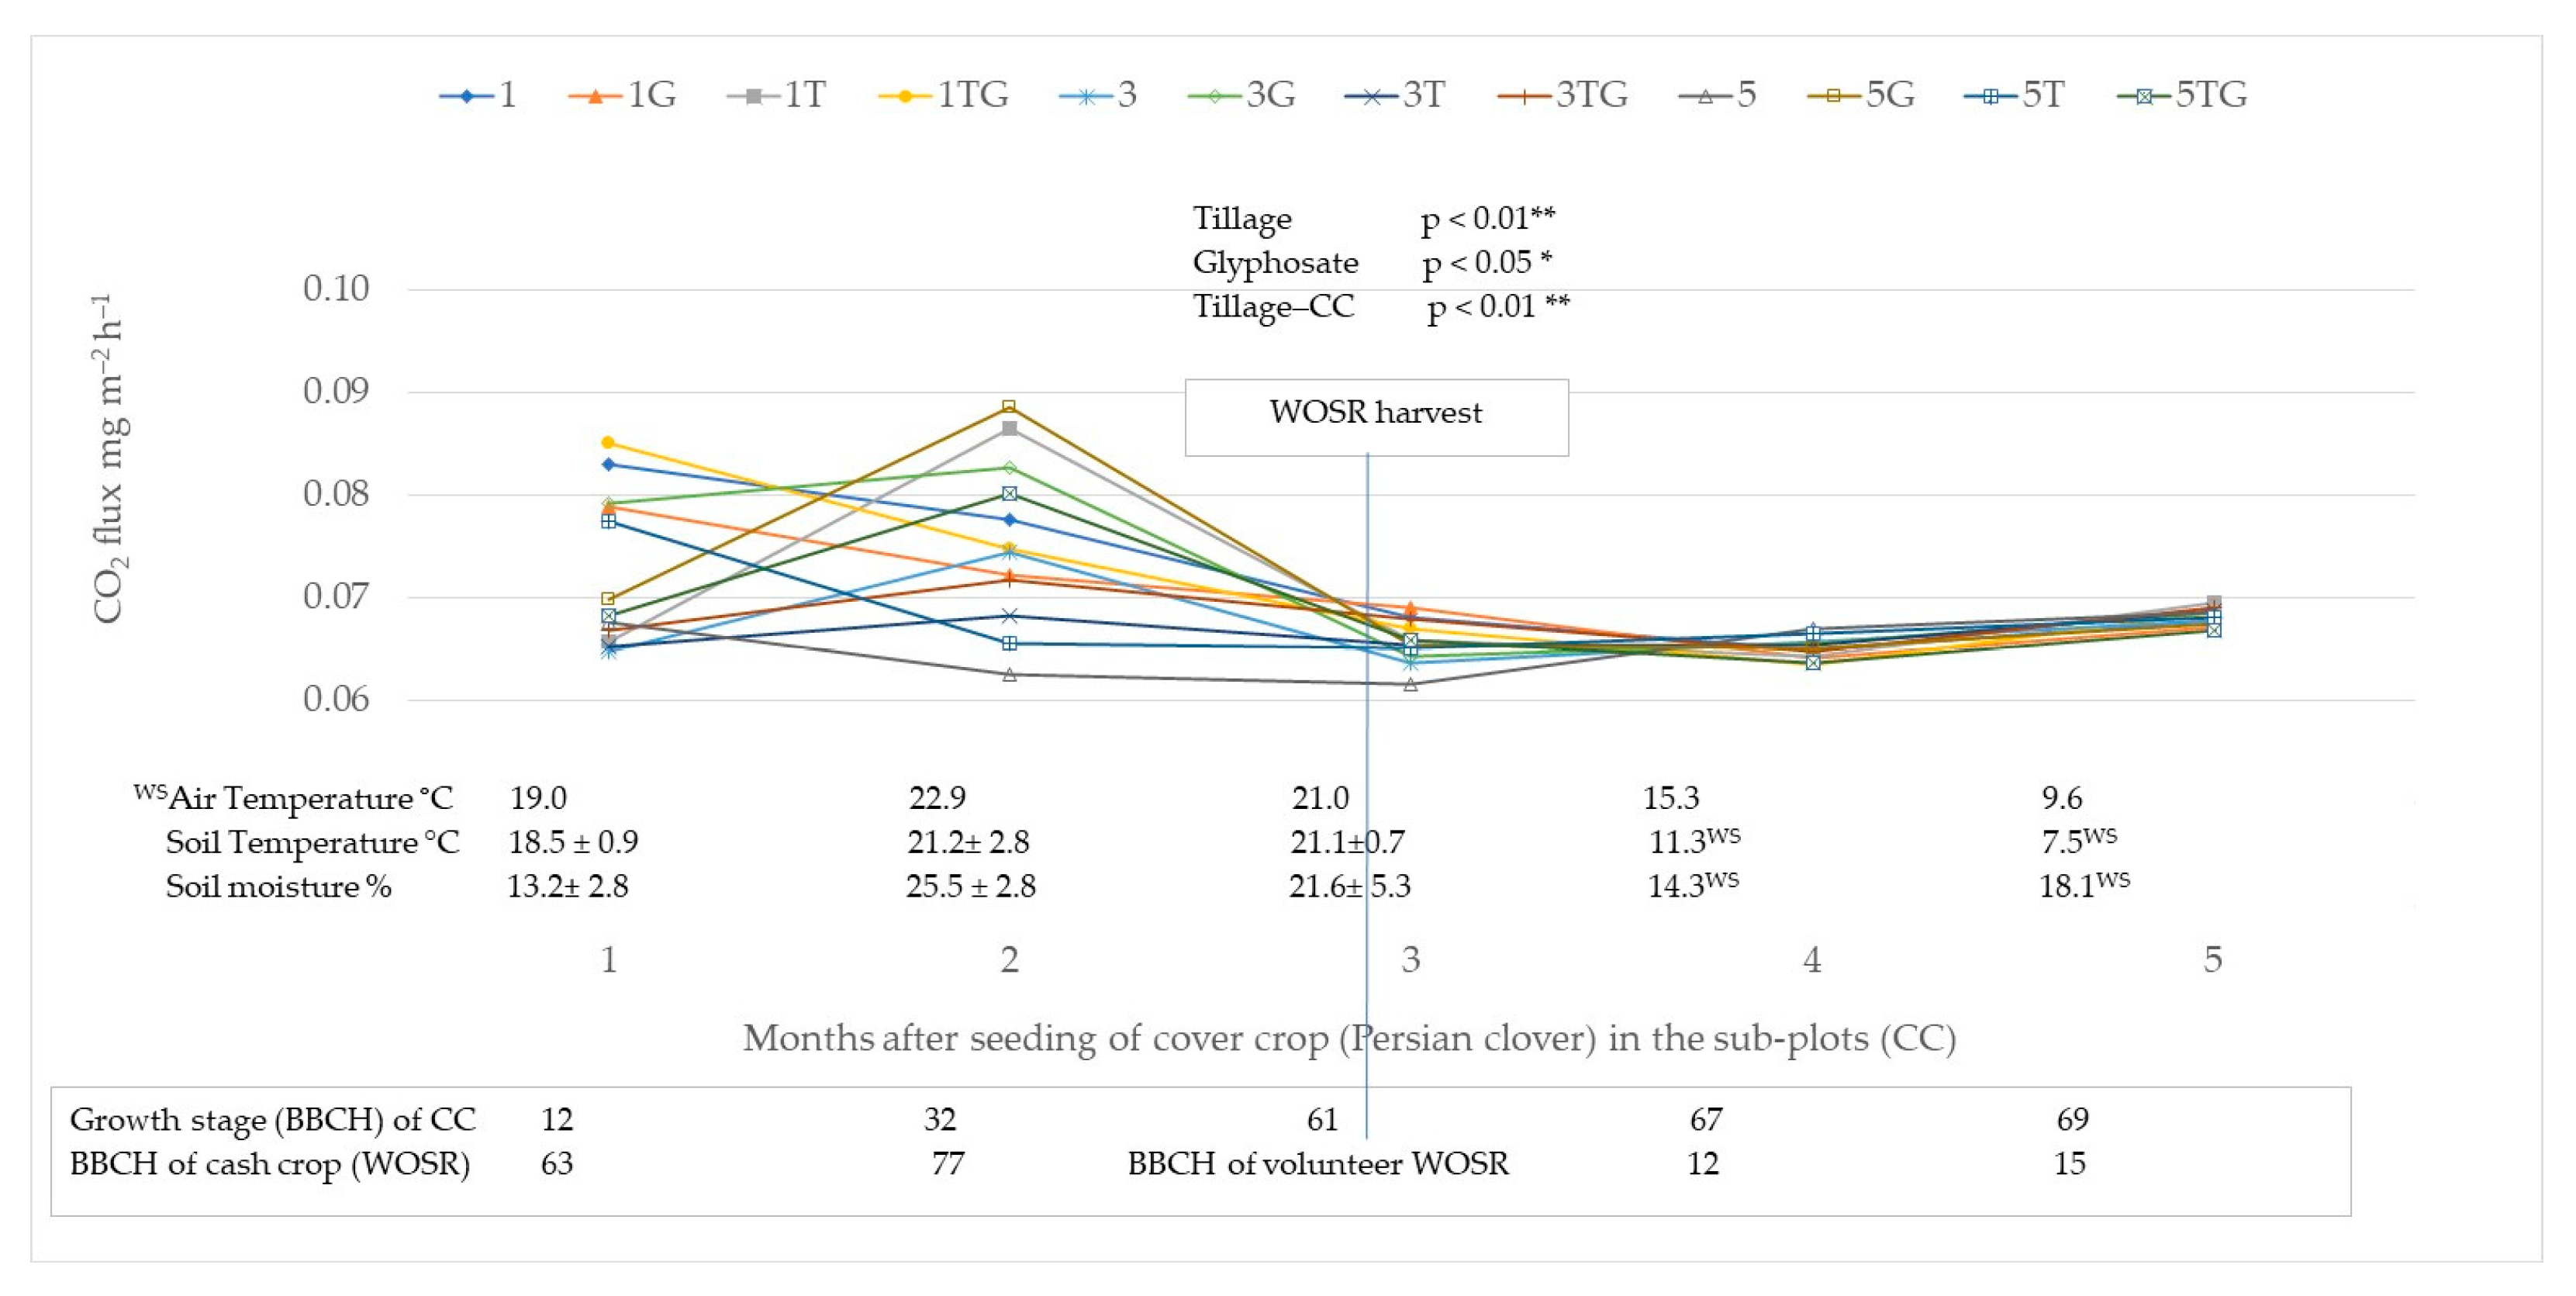
Figure 3.
N2O fluxes under different management practices during the crop growing season. 1—(ploughing, −CC, −G), 1G—(ploughing, −CC, +G), 1T—(ploughing, +CC, −G), 1TG—(ploughing, +CC, +G), 3—(harrowing, −CC, −G), 3G—(harrowing, −CC, +G), 3T—(harrowing, +CC, −G), 3TG—(harrowing, +CC, +G), 5—(no till, −CC, −G), 5G—(no till,−CC, +G), 5T—(no till, +CC, −G), 5TG—(no till, +CC, +G). Note: CC—cover crops, G—glyphosate, − negative, + positive. * indicates significant differences at p < 0.05; WS indicates the data obtained from the closest weather station (distance < 0.5 km).
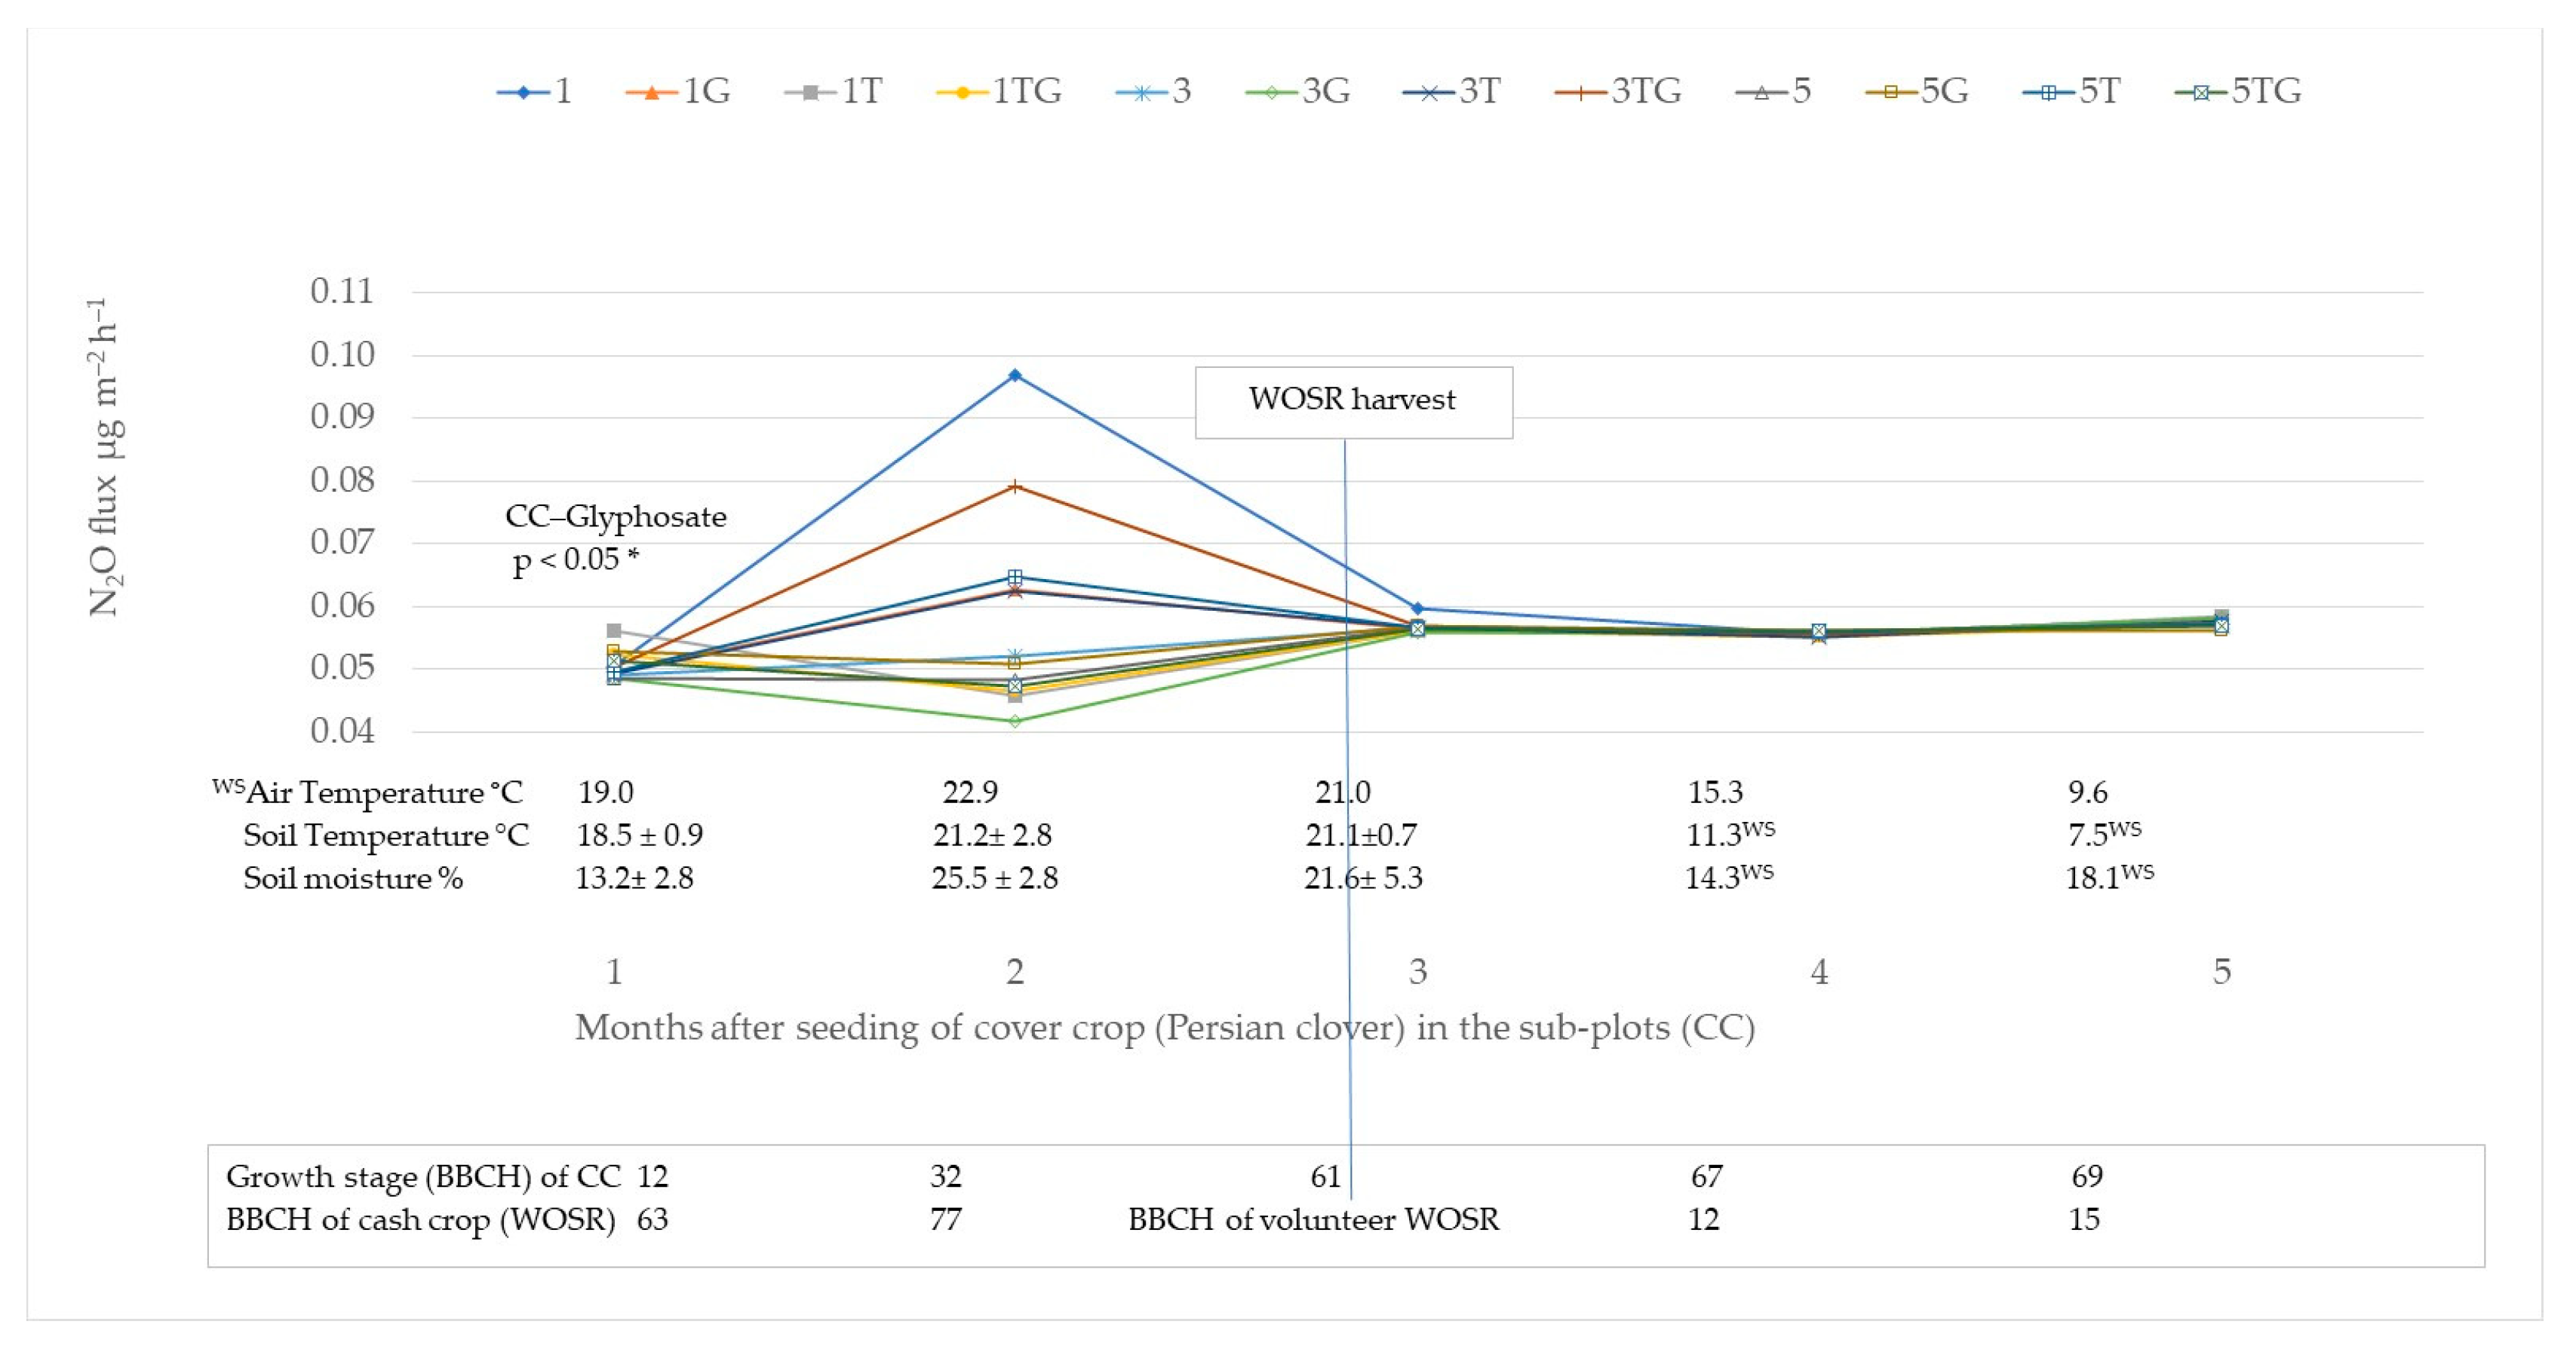
Figure 4.
CH4 fluxes under different management practices during the crop growing season. 1—(ploughing, −CC, −G), 1G—(ploughing, −CC, +G), 1T—(ploughing, +CC, −G); 1TG—(ploughing, +CC, +G), 3—(harrowing, −CC, −G), 3G—(harrowing, −CC, +G), 3T—(harrowing, +CC, −G), 3TG—(harrowing, +CC, +G), 5—(no till, −CC, −G), 5G—(no till, −CC, +G), 5T—(no till, +CC, −G), 5TG—(no till, +CC, +G). Note: CC—cover crops, G—glyphosate, − negative, + positive. * indicates significant differences at p < 0.05; WS indicates the data obtained from the closest weather station (distance < 0.5 km).
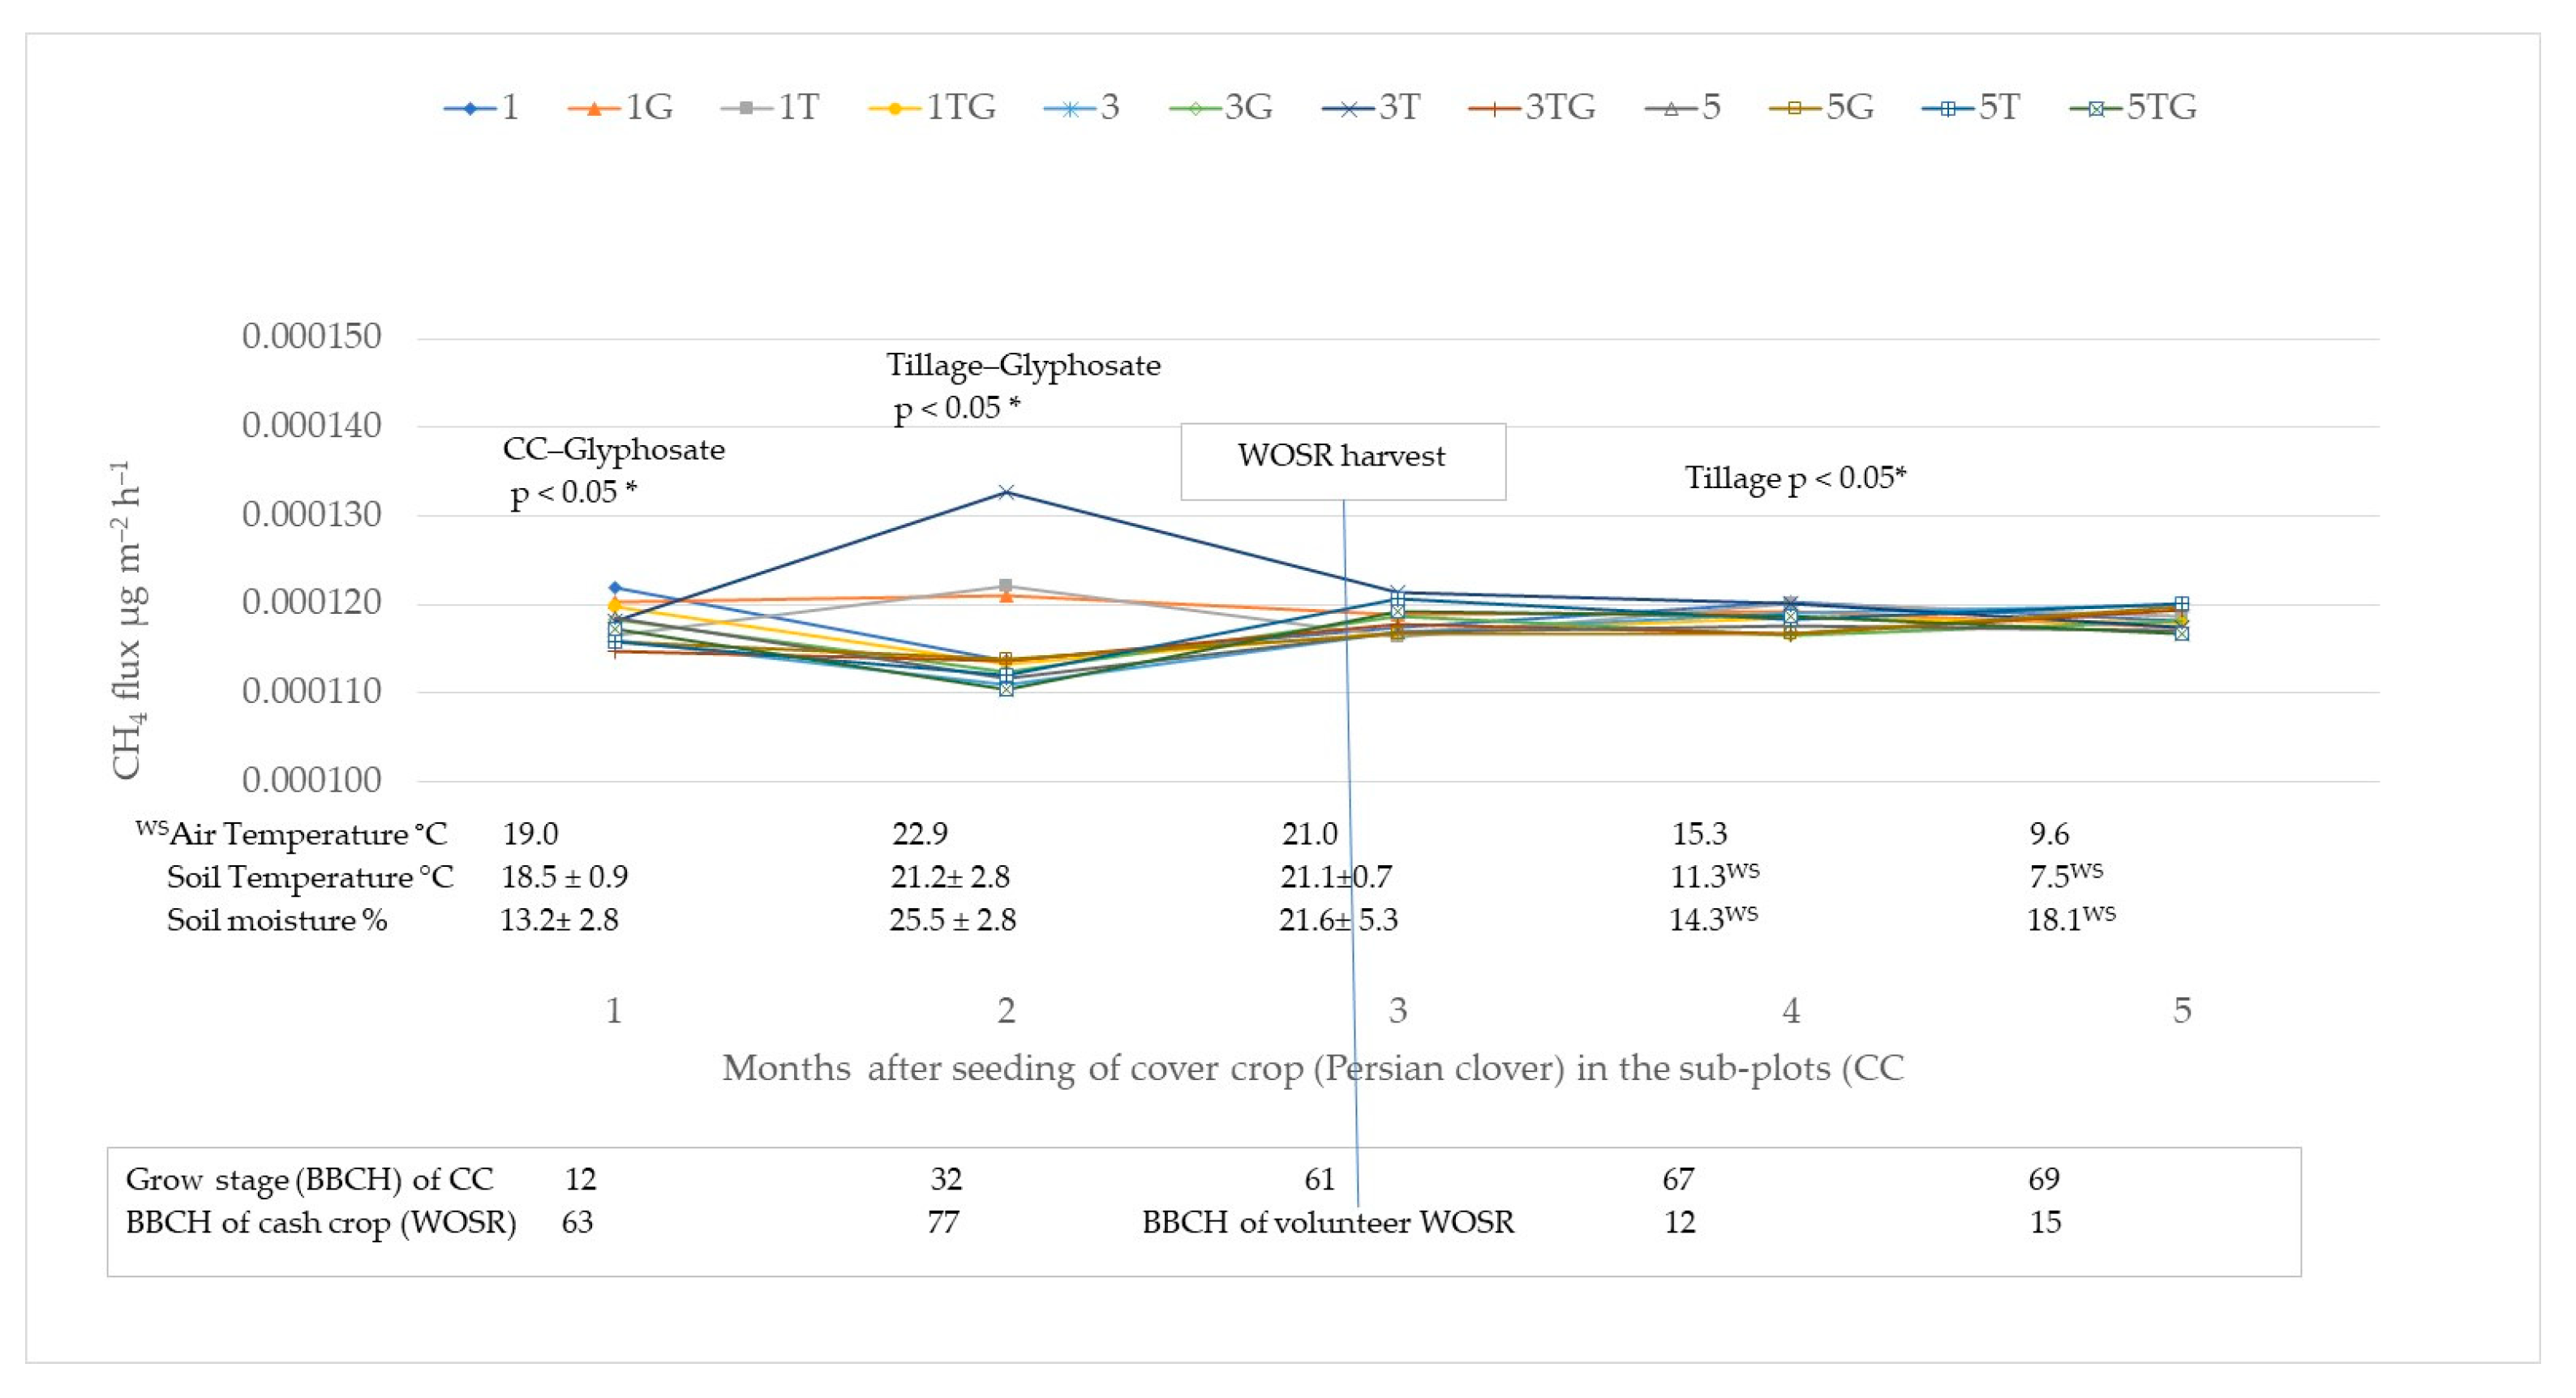
Table 1.
Effects of different management systems (tillage, cover crops, and glyphosate) on soil physical properties.
Table 1.
Effects of different management systems (tillage, cover crops, and glyphosate) on soil physical properties.
| Treatments | VWC % Vol | EC mS m−1 | WFPS % | Temp °C | BD g cm−3 | WSA% | TP m3 m−3 |
|---|---|---|---|---|---|---|---|
| 1 | 18.68 ± 1.36 ab | 11.13 ± 0.90 ab | 43.87 ± 3.19 ab | 20.87 ± 0.59 ab | 1.49 ± 0.03 b | 69.63 ± 1.63 b | 0.44 ± 0.011 a |
| 3 | 18.08 ± 0.47 ab | 10.62 ± 1.19 ab | 42.46 ± 1.09 ab | 20.20 ± 0.32 ab | 1.53 ± 0.01 ab | 79.17 ± 4.09 ab | 0.42 ± 0.004 ab |
| 5 | 19.58 ± 1.16 ab | 11.69 ± 1.60 ab | 45.98 ± 2.73 ab | 20.01 ± 0.23 b | 1.54 ± 0.01 ab | 81.4 ± 2.92 a | 0.42 ± 0.004 ab |
| 1T | 23.57 ± 1.43 a | 16.16 ± 0.68 a | 55.35 ± 3.37 a | 20.17 ± 0.10 ab | 1.48 ± 0.02 b | 68.36 ± 0.94 b | 0.44 ± 0.007 a |
| 3T | 20.92 ± 2.09 ab | 12.16 ± 2.11 ab | 49.14 ± 4.91 ab | 19.34 ± 0.14 b | 1.52 ± 0.01 ab | 73.86 ± 0.68 ab | 0.43 ± 0.003 ab |
| 5T | 21.86 ± 0.50 ab | 14.76 ± 1.24 ab | 51.33 ± 1.17 ab | 20.01 ± 0.29 b | 1.59 ± 0.01 a | 78.21 ± 0.81 ab | 0.40 ± 0.005 b |
| 1G | 19.14 ± 0.41 ab | 11.68 ± 0.96 ab | 44.96 ± 0.97 ab | 22.57 ± 1.42 a | 1.49 ± 0.03 b | 69.63 ± 1.63 b | 0.44 ± 0.011 a |
| 3G | 17.48 ± 1.00 b | 9.43 ± 0.77 b | 41.05 ± 2.34 b | 20.19 ± 0.32 ab | 1.53 ± 0.01 ab | 79.17 ± 4.09 ab | 0.42 ± 0.004 ab |
| 5G | 20.23 ± 0.47 ab | 13.01 ± 0.60 ab | 47.52 ± 1.10 ab | 20.43 ± 0.14 ab | 1.54 ± 0.01 ab | 81.40 ± 2.92 a | 0.42 ± 0.004 ab |
| 1TG | 20.71 ± 1.69 ab | 12.89 ± 1.51 ab | 48.64 ± 3.96 ab | 20.05 ± 0.27 b | 1.48 ± 0.02 b | 68.36 ± 0.94 b | 0.44 ± 0.007 a |
| 3TG | 20.41 ± 0.94 ab | 11.39 ± 0.57 ab | 47.93 ± 2.22 ab | 19.61 ± 0.05 b | 1.52 ± 0.01 ab | 73.86 ± 0.68 ab | 0.43 ± 0.003 ab |
| 5TG | 20.53 ± 0.99 ab | 12.70 ± 0.78 ab | 48.22 ± 2.31 ab | 19.67 ± 0.19 b | 1.59 ± 0.01 a | 78.2 ± 0.81 ab | 0.40 ± 0.005 b |
Table 2.
Correlation matrix for soil physical parameters and greenhouse gas emissions in different management practices.
Table 2.
Correlation matrix for soil physical parameters and greenhouse gas emissions in different management practices.
| VWC | Temp | EC | WFPS | BD | TP | WSA | CO2 | N2O | CH4 | |
|---|---|---|---|---|---|---|---|---|---|---|
| VWC | –0.22 | 0.9 ** | 0.94 ** | –0.03 | –0.01 | –0.19 | –0.26 | 0.18 | 0.14 | |
| Temp | –0.06 | –0.31 | –0.35 * | 0.39 * | –0.28 | 0.3 | –0.08 | 0.25 | ||
| EC | 0.87 ** | 0.03 | –0.06 | –0.18 | –0.16 | 0.15 | 0.05 | |||
| WFPS | 0.3 | –0.34 | –0.02 | –0.31 | 0.18 | 0.01 | ||||
| BD | –0.99 ** | 0.51 ** | –0.18 | 0.04 | –0.39 * | |||||
| TP | –0.54 ** | 0.18 | –0.12 | 0.37 * | ||||||
| WSA | –0.12 | 0.11 | –0.07 | |||||||
| CO2 | 0.14 | 0.28 | ||||||||
| N2O | 0.06 | |||||||||
| CH4 |
[ad_2]