JPM | Free Full-Text | Integrating Optical Genome Mapping and Whole Genome Sequencing in Somatic Structural Variant Detection
Author Contributions
Conceptualization, L.B. and J.B.; methodology, L.B. and J.B.; software, L.B. and L.Z.; validation, L.Z.; formal analysis, L.B.; investigation, L.B., J.B. and L.Z.; resources, S.D.; data curation, L.B., D.B.T. and L.Z.; writing—original draft preparation, L.B.; writing—review and editing, L.B., J.B., S.D. and L.Z; visualization, L.B.; supervision, J.B. and S.D.; project administration, J.B.; funding acquisition, J.B. and S.D. All authors have read and agreed to the published version of the manuscript.
Figure 1.
Bioinformatics workflow for structural variant detection and integration of whole genome sequencing, optical genome mapping, and RNA-Seq: SVs from both WGS, OGM, and RNA-Seq are detected and filtered using the individual subroutines depicted in the dotted boxes. High-confidence calls are merged together, and further filtering is applied to remove germline polymorphisms and SV calls from control datasets. The remaining calls represent likely somatic SVs and SNVs. Note that in the absence of germline controls for these individuals, true somatic calls cannot be fully determined, and we are limited by the comprehensiveness of the control datasets that are available from healthy control populations. A detailed explanation is provided in Material and Methods.
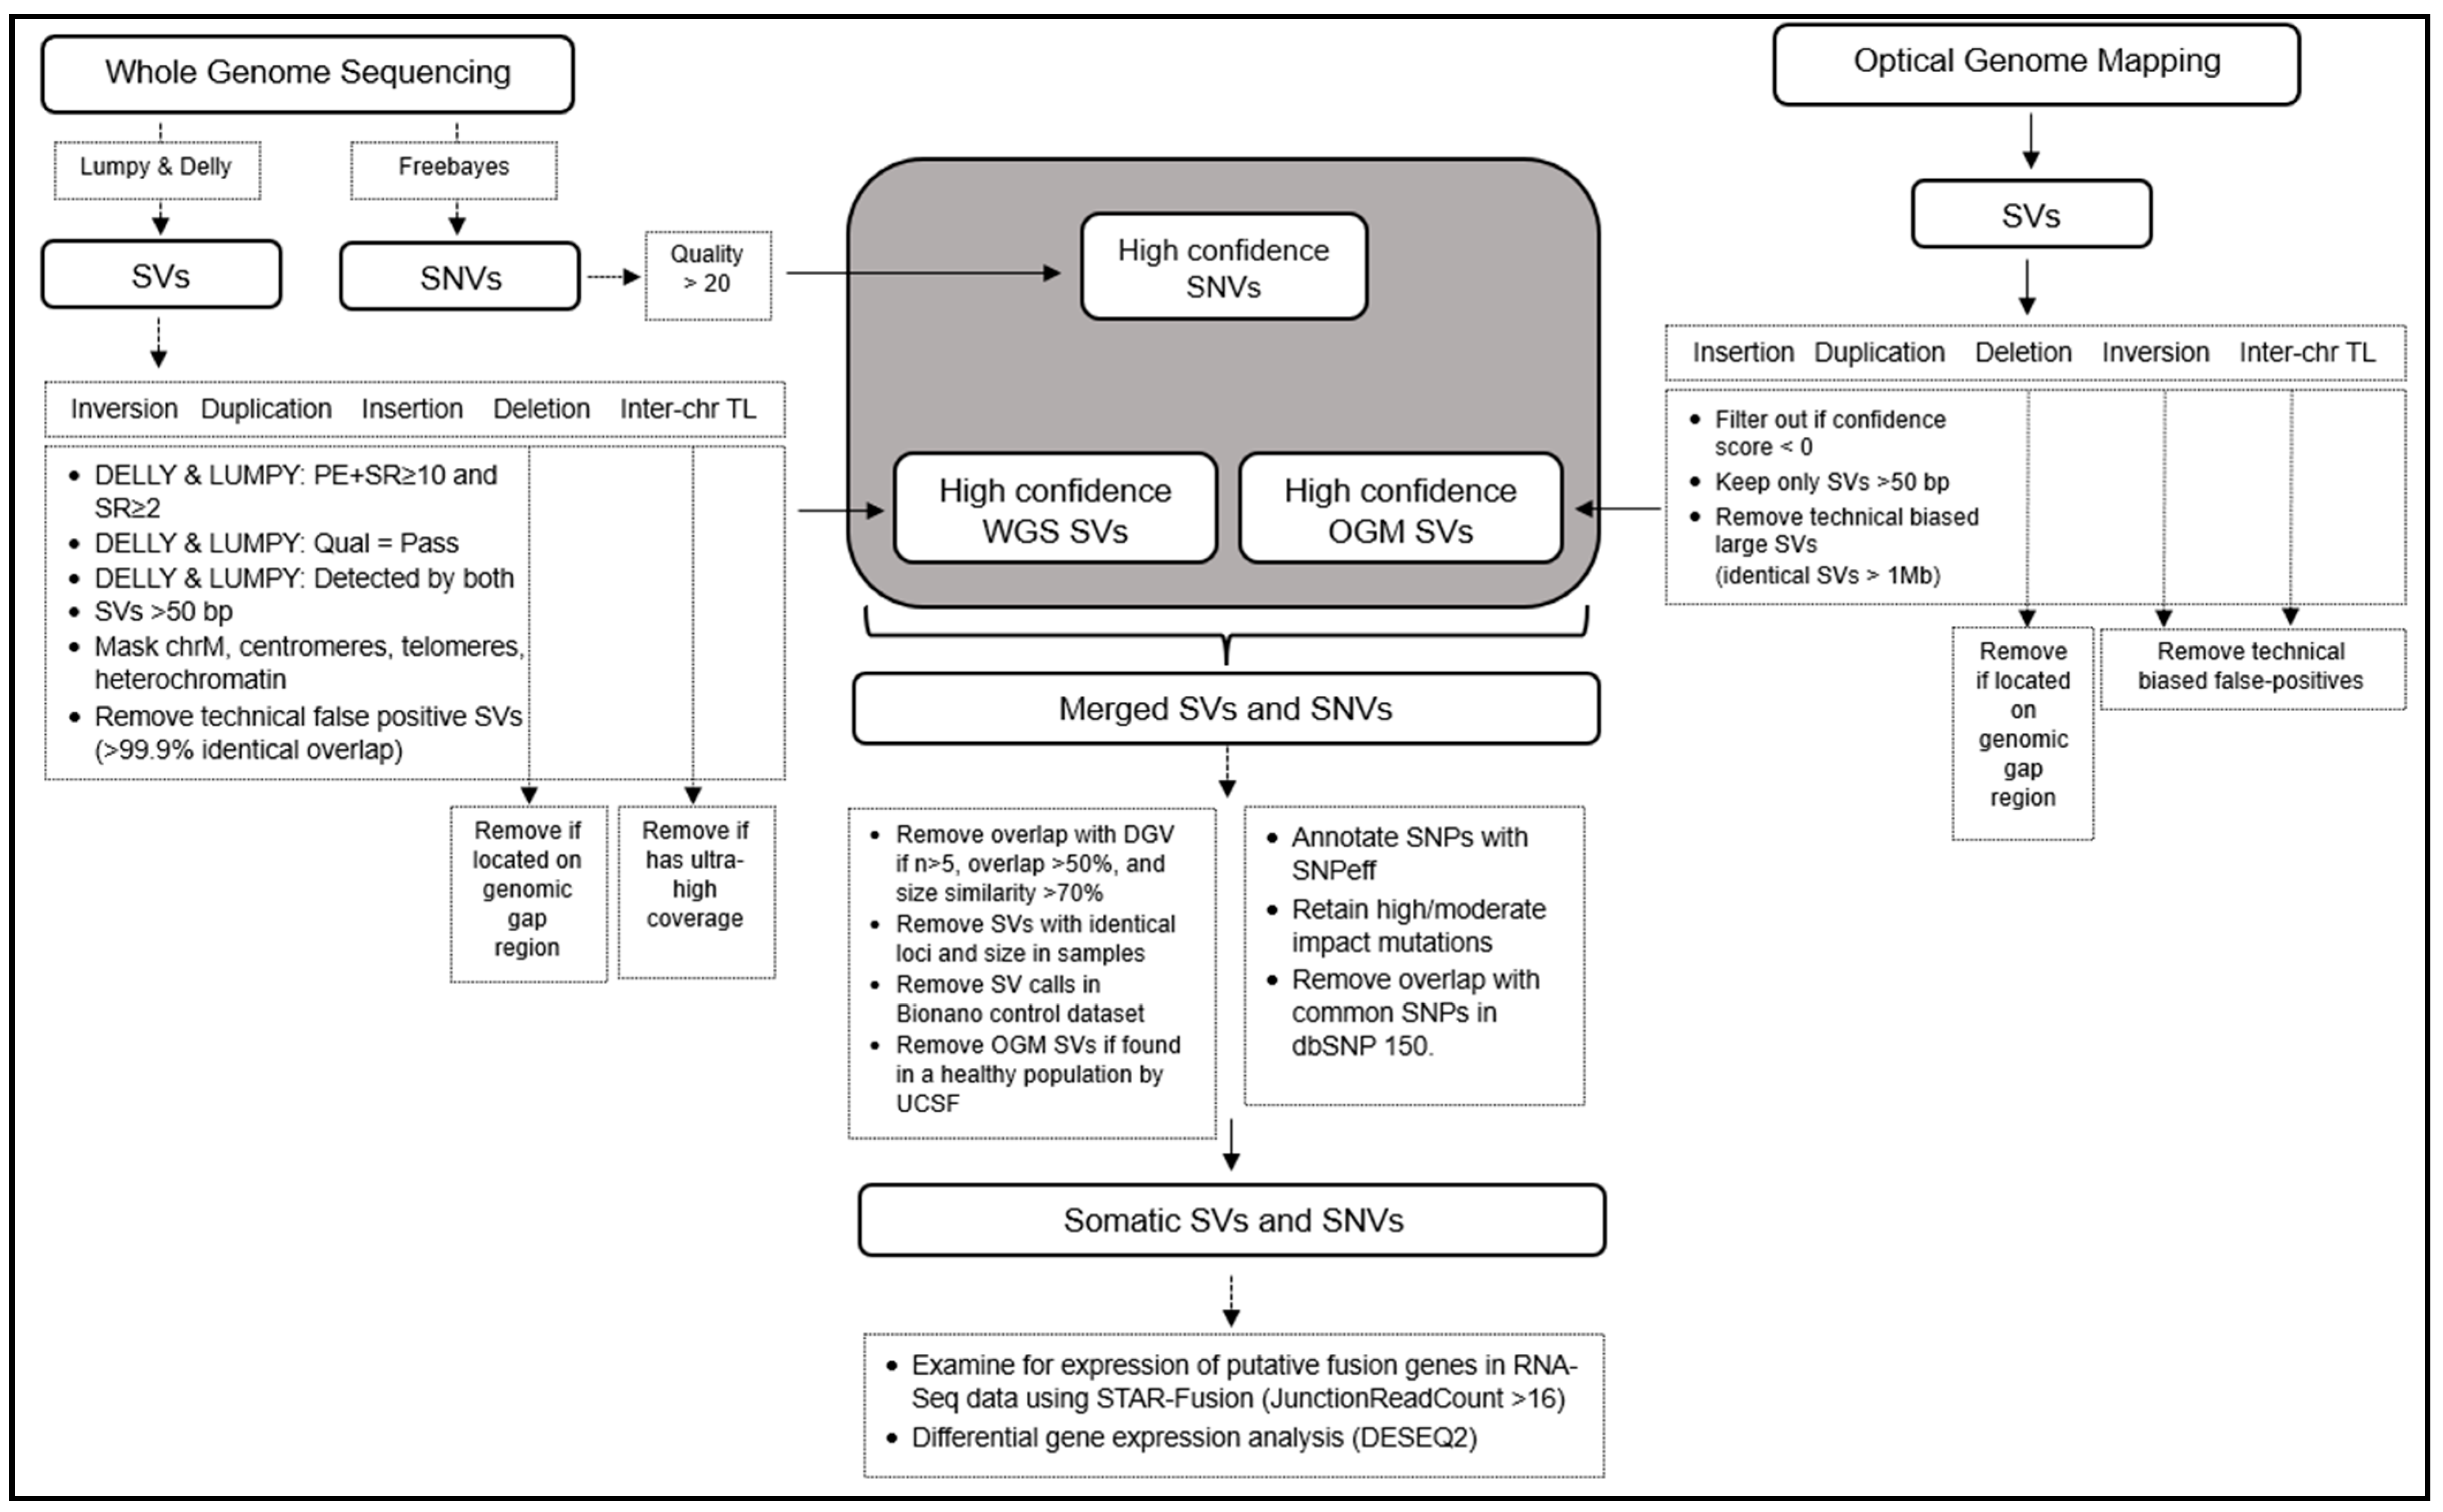
Figure 2.
The SV landscape in B-ALL as detected by WGS and OGM technologies in 29 individuals with pediatric B-ALL. (A) Average number of somatic SVs detected by each technology per sample and the average overlap per sample genome. (B) Counts of somatic SVs detected in cohort by WGS or OGM and percent confirmed by both technologies grouped by SV type. (C) Distribution of counts and percent of somatic deletions and duplication regions detected at various sizes by OGM from <0.5 kbp to ≥1 Mb. No inversions were detected by OGM in our 29 individuals. (D) Distribution of counts and percent of somatic deletions and duplication regions detected at various sizes by WGS from <0.5 kbp to ≥1 Mb. Insertion sizes for WGS are not reported by DELLY/LUMPY and are not included here. (E) Distribution of deletion sizes. The median sizes shown as horizontal lines are 42,720 for OGM and 5248 for WGS. The values are plotted on a log10 scale. p = 2.2 × 10⁻¹⁶ Wilcoxon rank-sum test. (F) The number of SVs found in 29 pediatric B-ALL cases by OGM that were not detected by WGS. TLs = translocations, DEL = deletion, INS = insertions, DUP = duplication, INV = inversions.
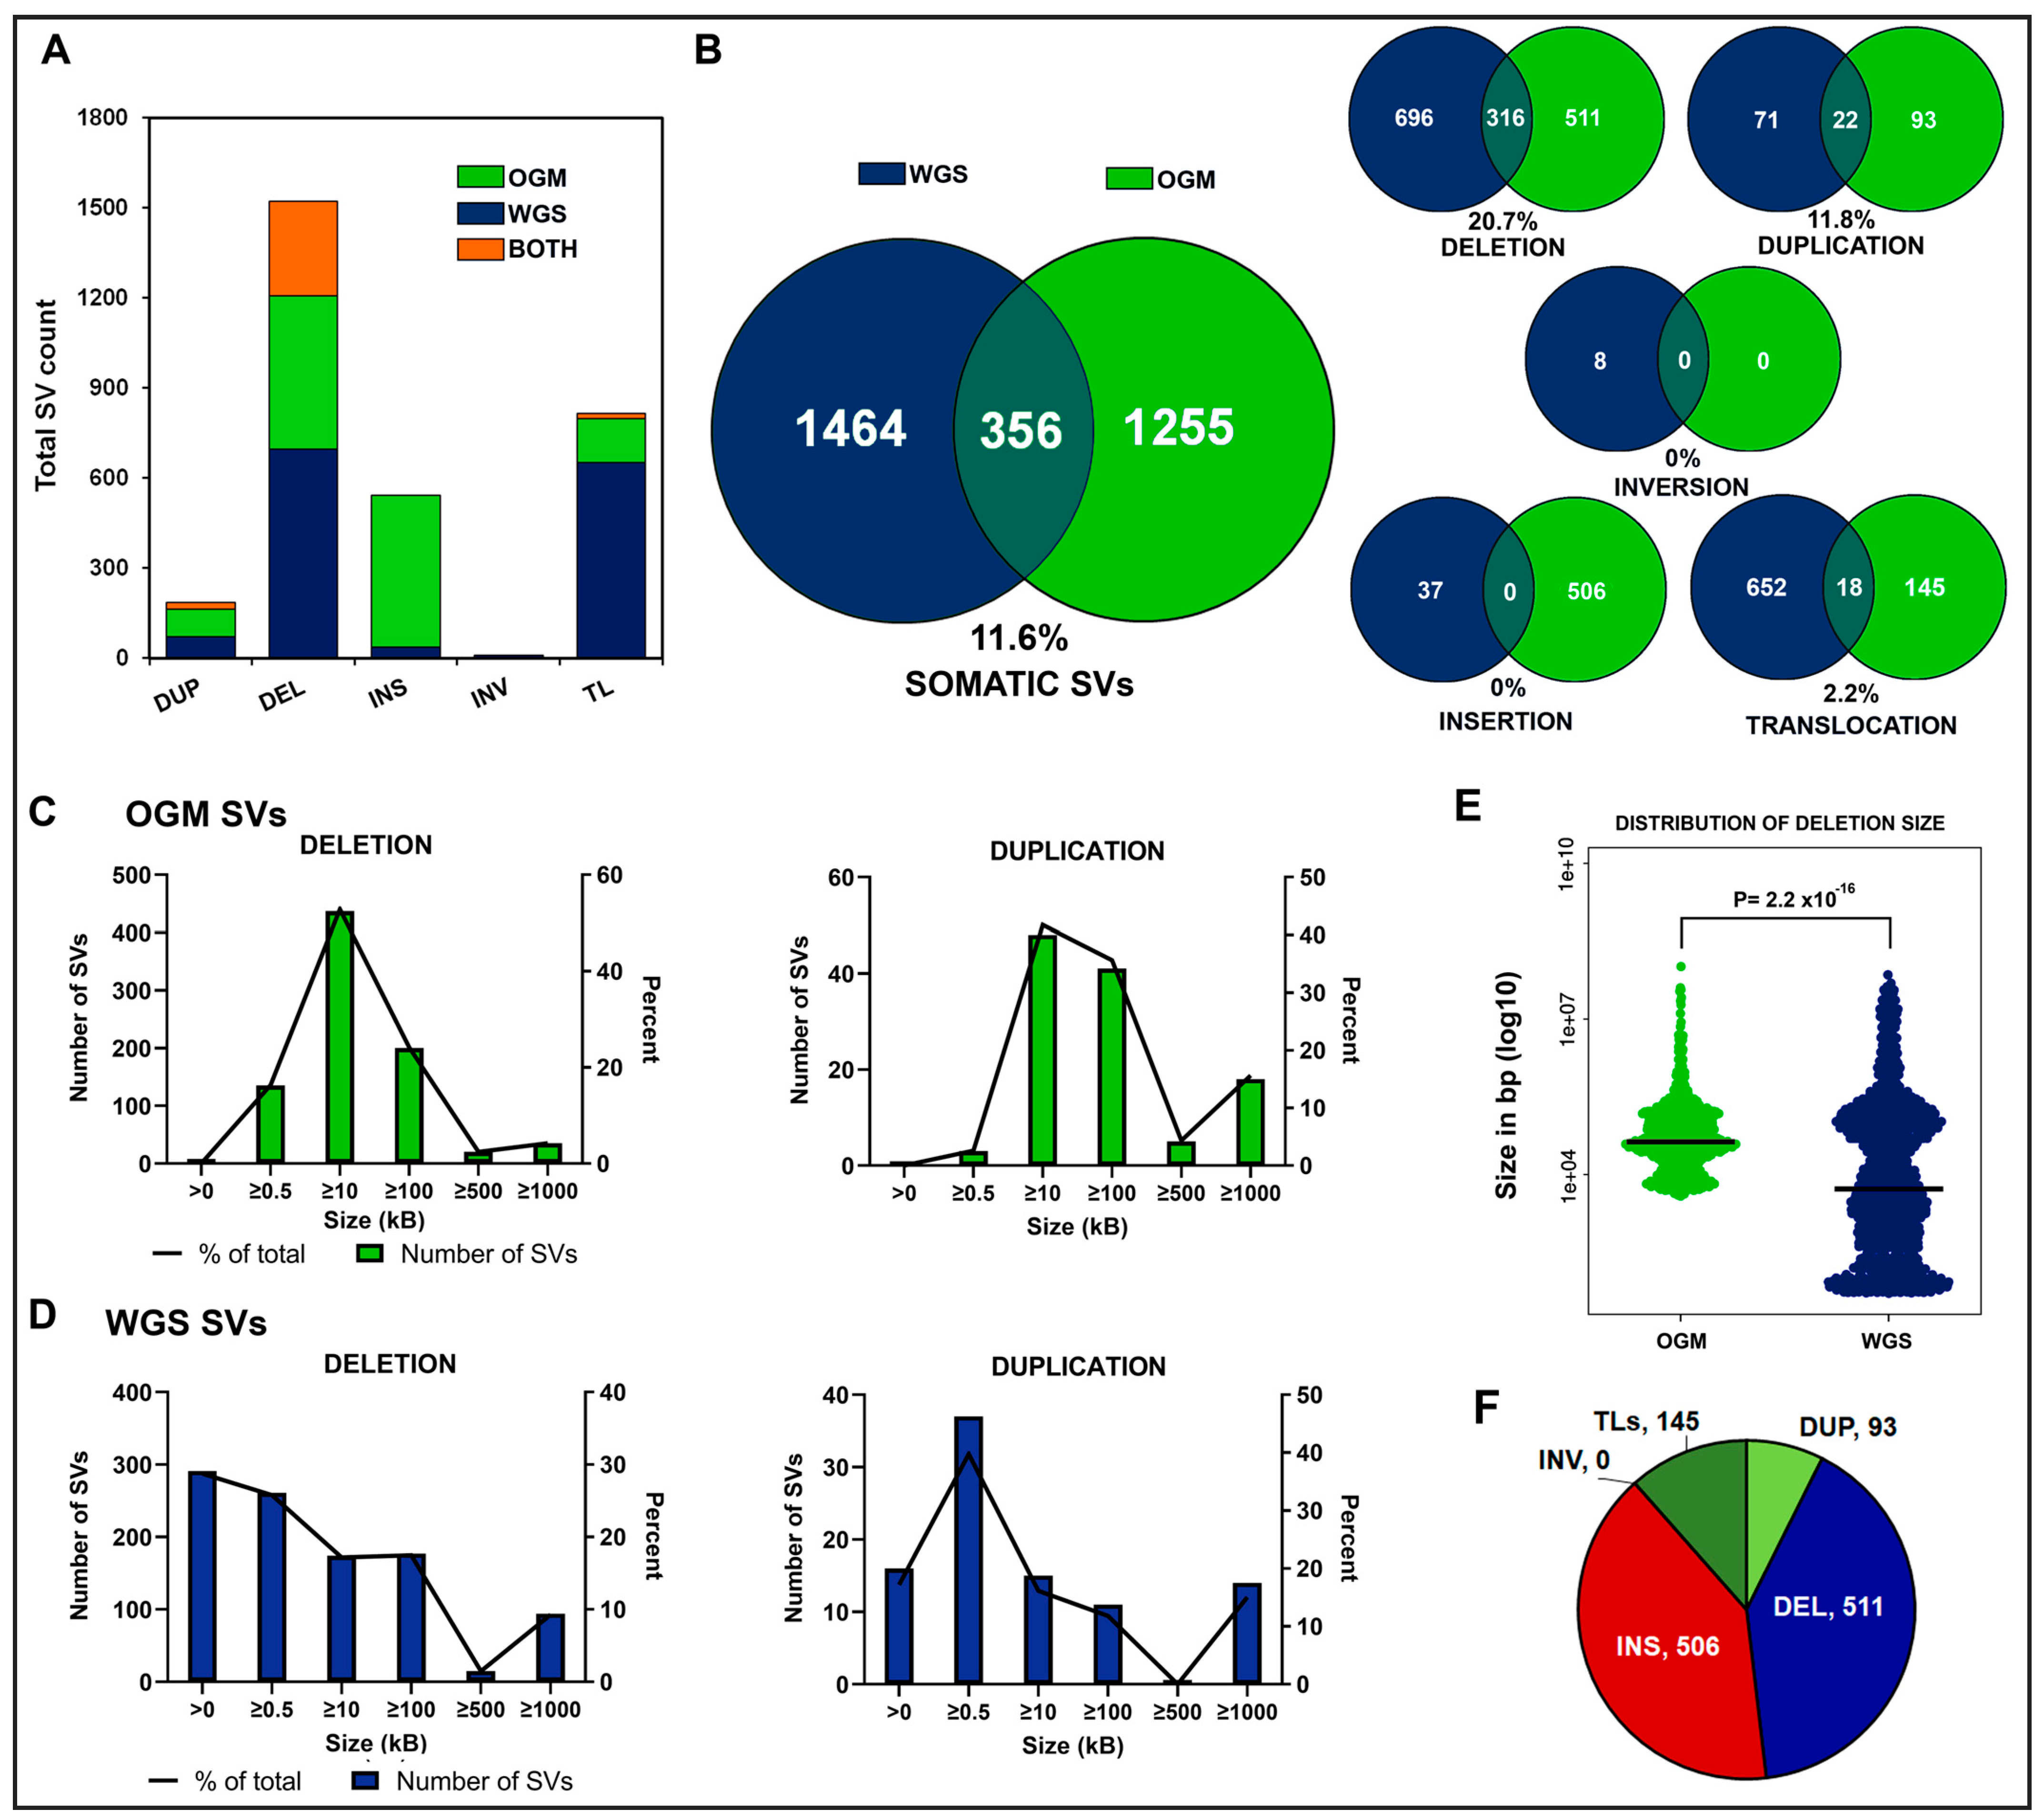
Figure 3.
Resolution of unsupported WGS breakpoints by OGM data: (A) We examined likely sources for breakpoint discrepancies in SVs detected by OGM and WGS, including DLE-1 gap regions, UCSC known repeat regions, WGS SVs overlapping OGM SVs within 100 kb, and any predicted false positive translocation calls from LUMPY. (B) The number of unresolved WGS breakpoints that overlap with UCSC repeats, OGM insertions (ins), duplications (dup), and deletion (del) regions, DLE-1 gap sites, or otherwise likely false positive translocation calls from LUMPY.
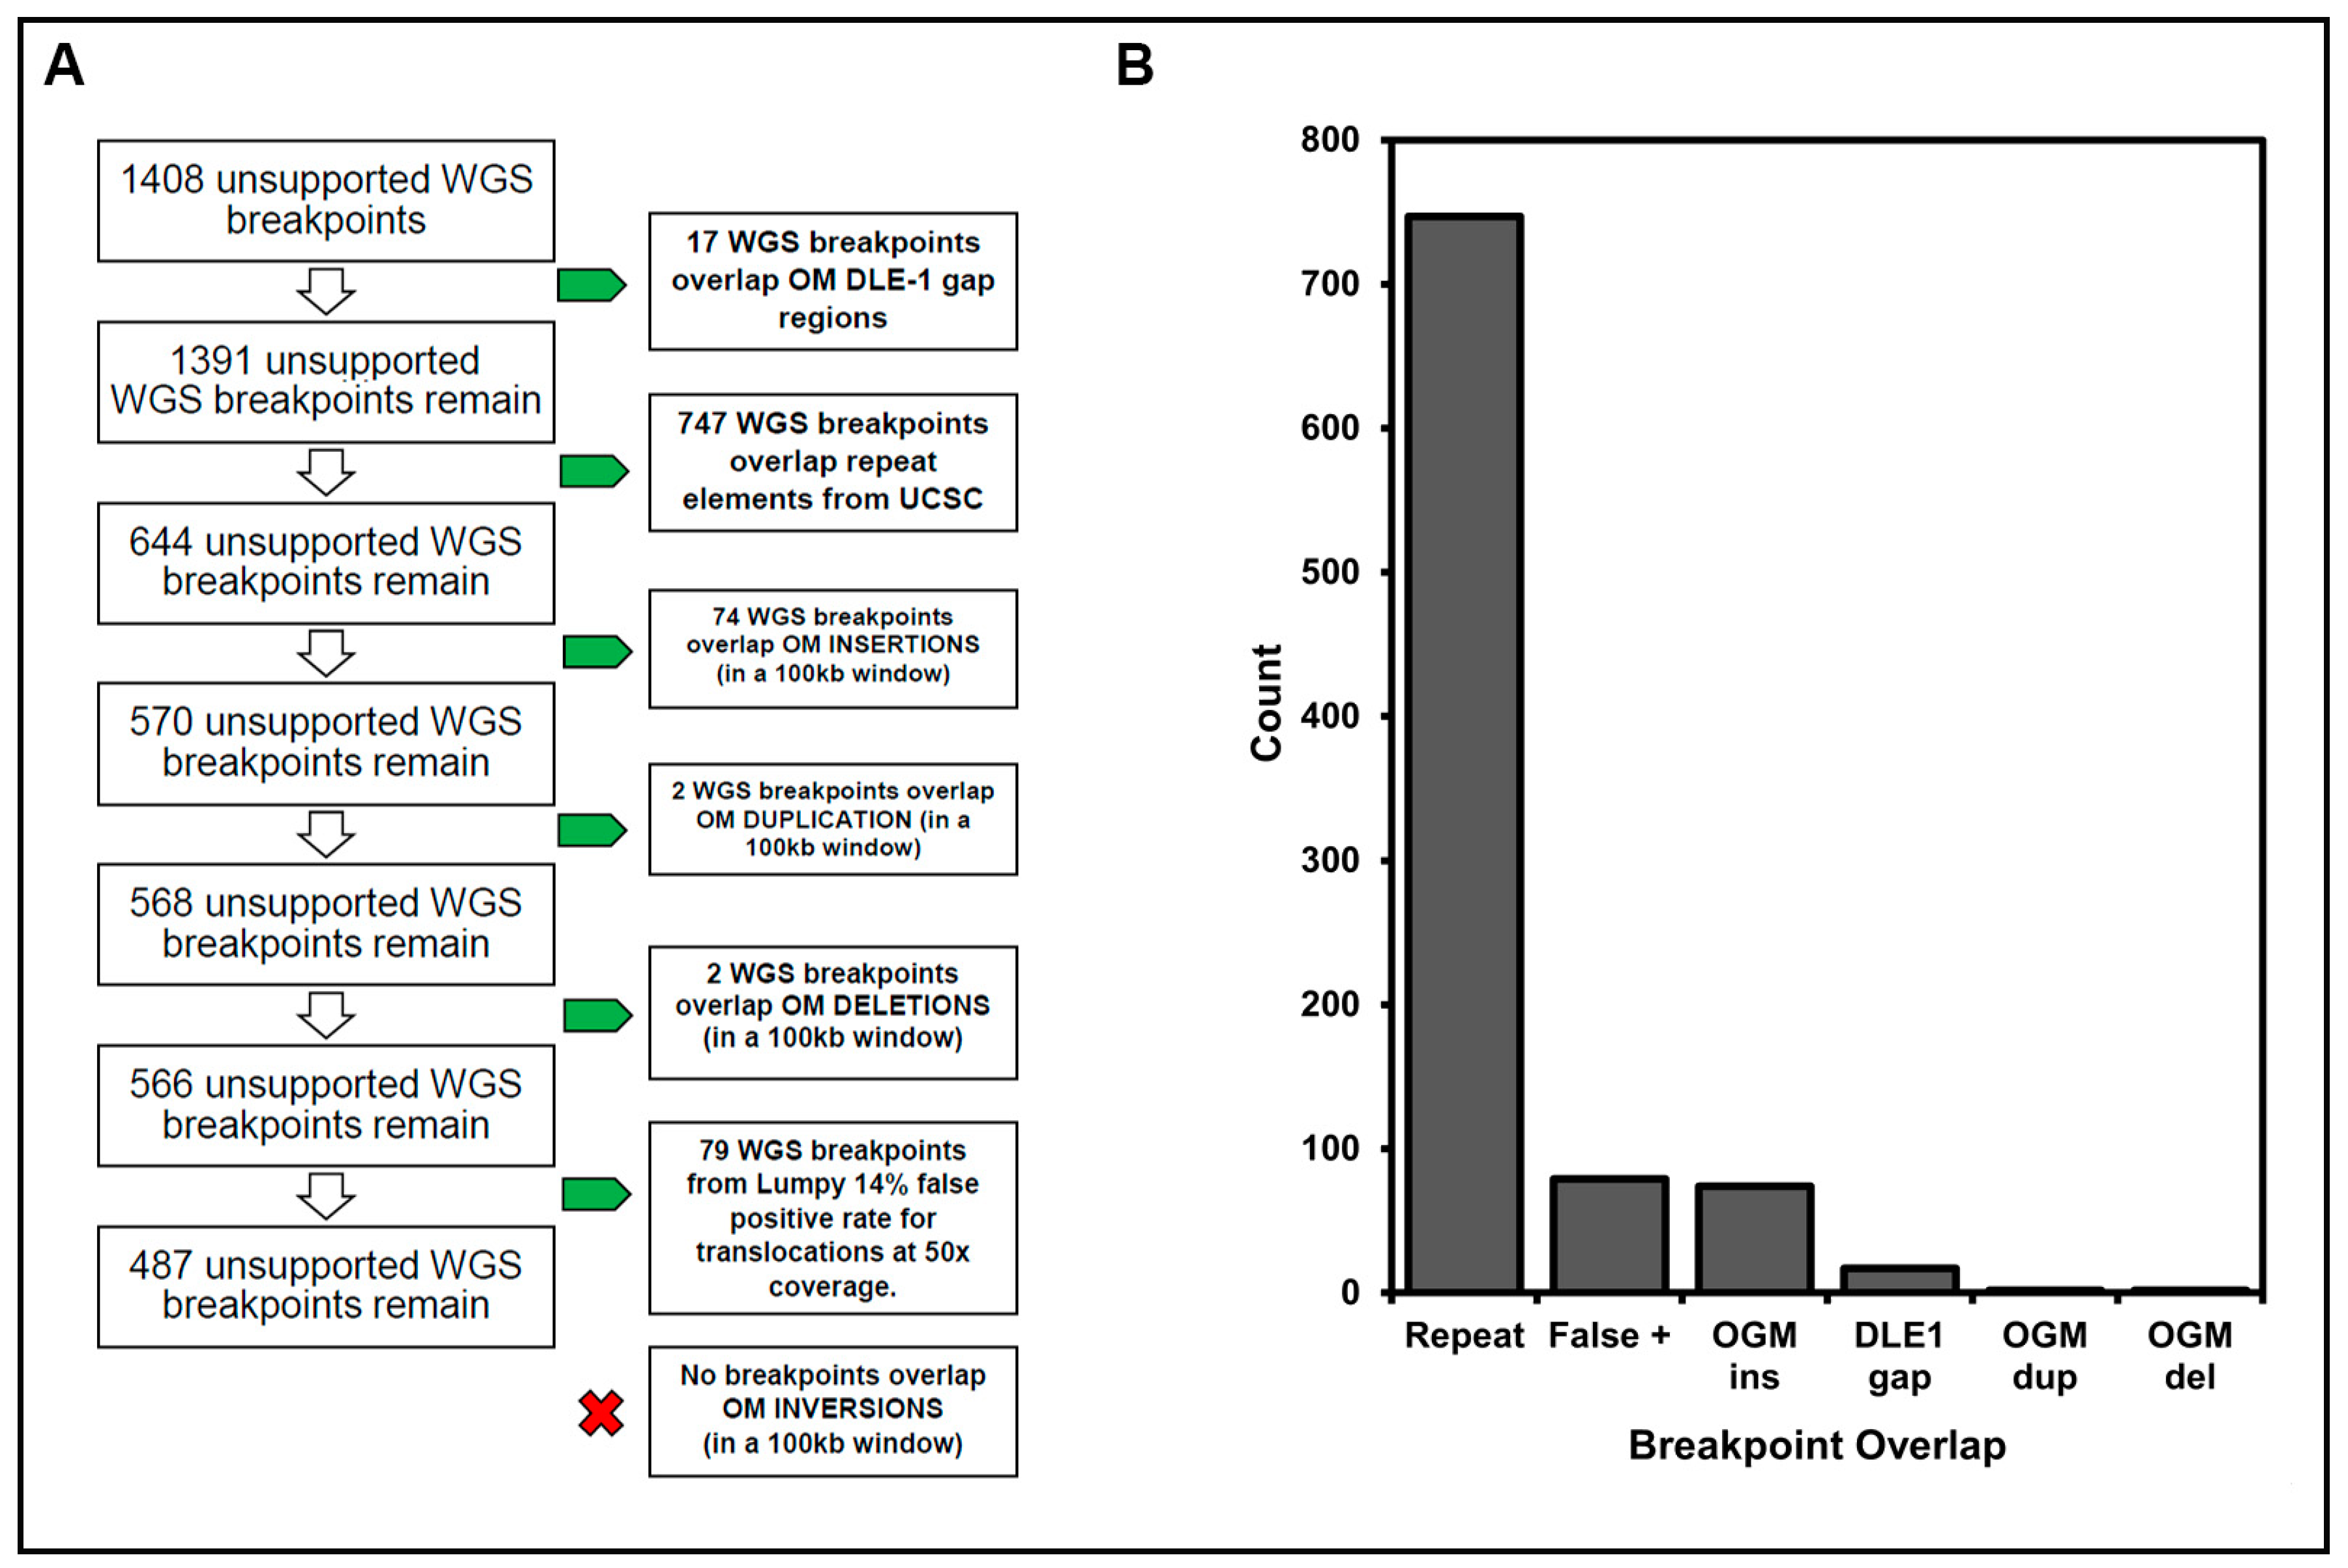
Figure 4.
Insertions misclassified as translocations: (A) A translocation identified by WGS for which one end map near the site of an insertion called by OGM is likely misclassified, particularly if that insertion is a repeated element. (B) Counts of translocations and insertions in our cohort of 29 B-ALL samples before and after reclassifying as insertions 123 WGS translocations mapped to an OGM insertion region. (C) WGS data in sample ALL-02 of a false positive translocation between chr7 and chr11, which overlaps a LINE element on chr11. WGS reads indicating the translocation t(7;11) causing a putative NRCAM:DLG2 gene fusion. The box shows that 23 reads in the WGS data support a translocation (alternate allele) and 92 support the reference allele, but an additional 637 reads are ambiguous and do not support the reference or alternate allele calls. The reference allele is depicted on the bottom. Reads aligning to the minus strand are red, and those aligning to the plus strand are purple. The unsequenced segment between read pairs is depicted by gray bars. Green reads designate overlap of mate pair reads. Chr7 is depicted by red (upstream) and blue (downstream) arrows at the breakpoint. Chr11 is depicted by grey (upstream) and yellow (downstream) arrows at the breakpoint. (D) The circos plot derived from WGS data showed additional putative translocations from the LINE element in chr11 to other chromosomes. The t(7;11) is also depicted. (E) The OGM data from chr7 at the site of the predicted fusion breakpoint. The tracks depicted (top to bottom) are as follows: cytoband, hg38 genes, reference chromosome, patient map aligning to reference, and supporting long-read molecules. The vertical blue lines represent DLE-1 labels corresponding to the patient map. No evidence of a translocation is seen in the OGM data, but an insertion is shown in the zoomed-in panel highlighted in red. The two yellow vertical lines represent additional DLE-1 labels not originally present in the reference chr7. We hypothesize that the insertion is a LINE, which accounts for the alternative reads in the WGS data. (F) The OGM circos plot depicts which translocations pass filtering. The track labels are as follows from outside to inside: chromosome number, cytoband, gene regions, SV (blue = deletion, red = insertion, pink = inversion, green = duplication), copy number, and translocations.
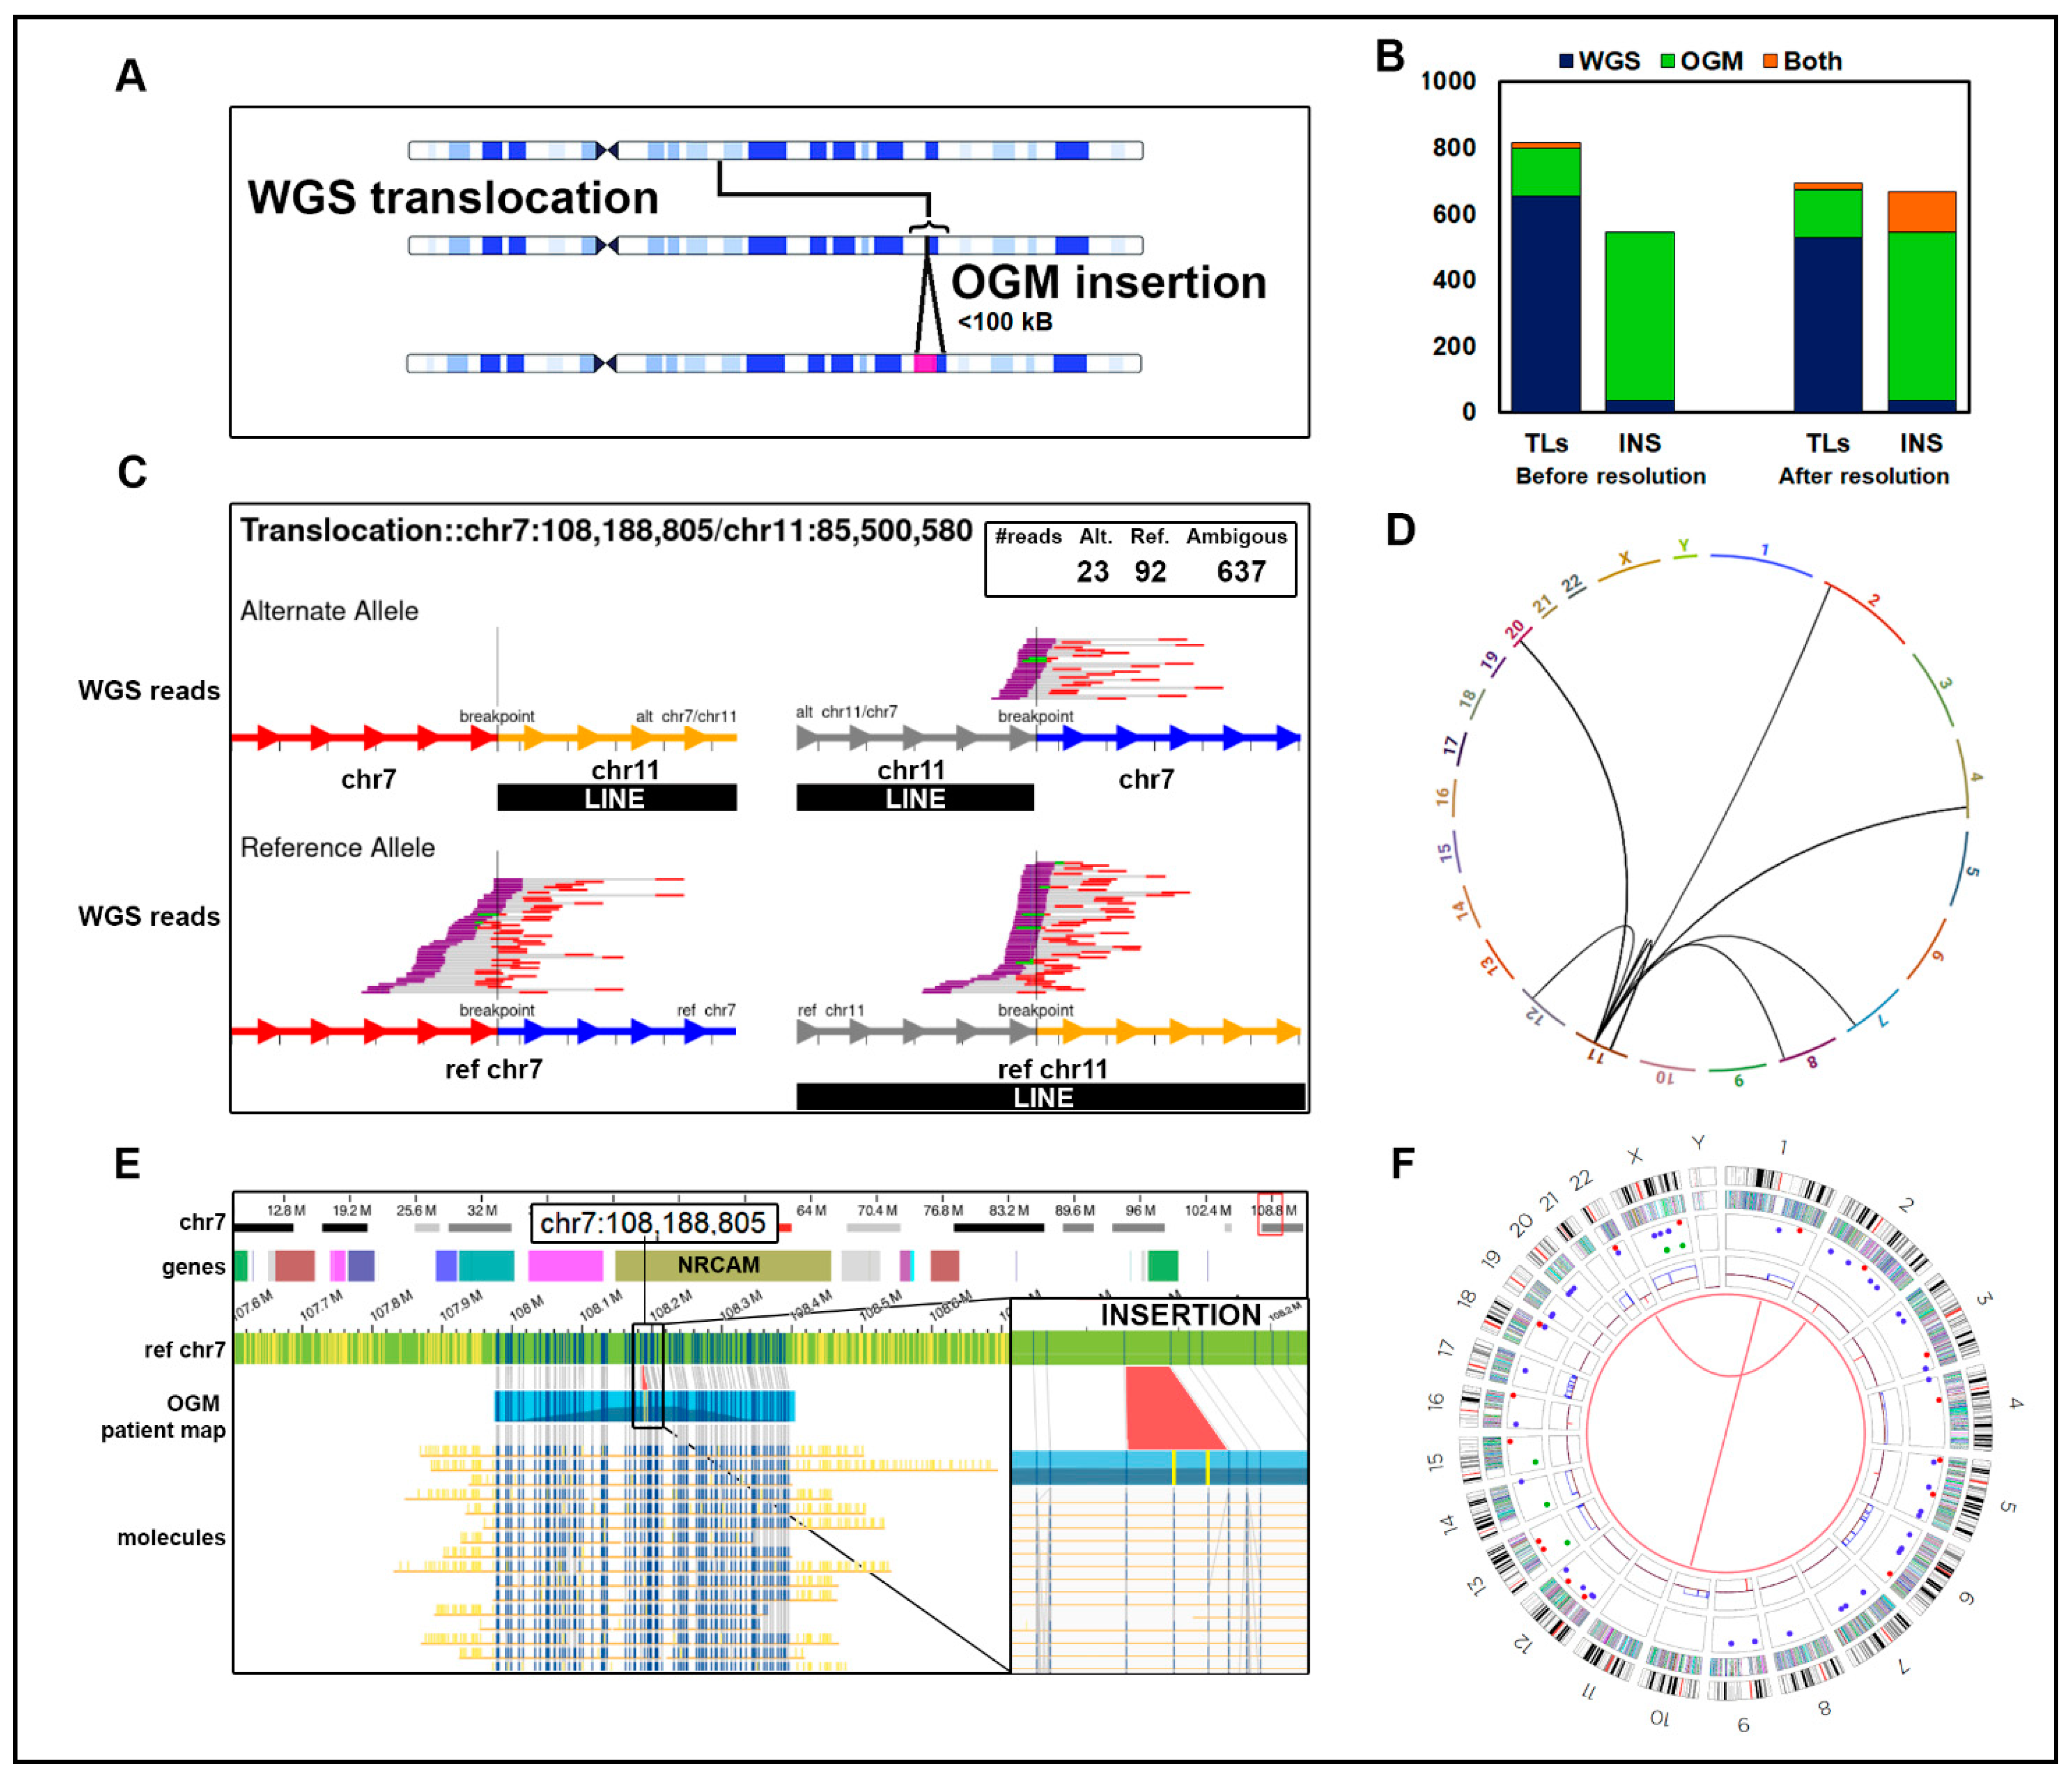
Figure 5.
Smaller SVs are missed by conventional cytogenetics but can be accurately resolved by OGM and WGS: An example of a heterozygous partial IKZF1 deletion not reported by cytogenetics but confirmed by OGM and WGS data in LUMPY/DELLY is in a Hispanic patient, W31. The first four tracks depict data from the OGM. Blue and yellow lines represent DLE-1 labeled areas on the patient OGM map, or the reference chromosomes, grey lines indicate the patient map as it aligns to the reference genome. The orange triangle depicts the region from the OGM map that was deleted compared to the reference. The bottom three tracks show the corresponding locations in WGS data and the 50% decrease in read coverage at IKZF1 indicating a heterozygous deletion.
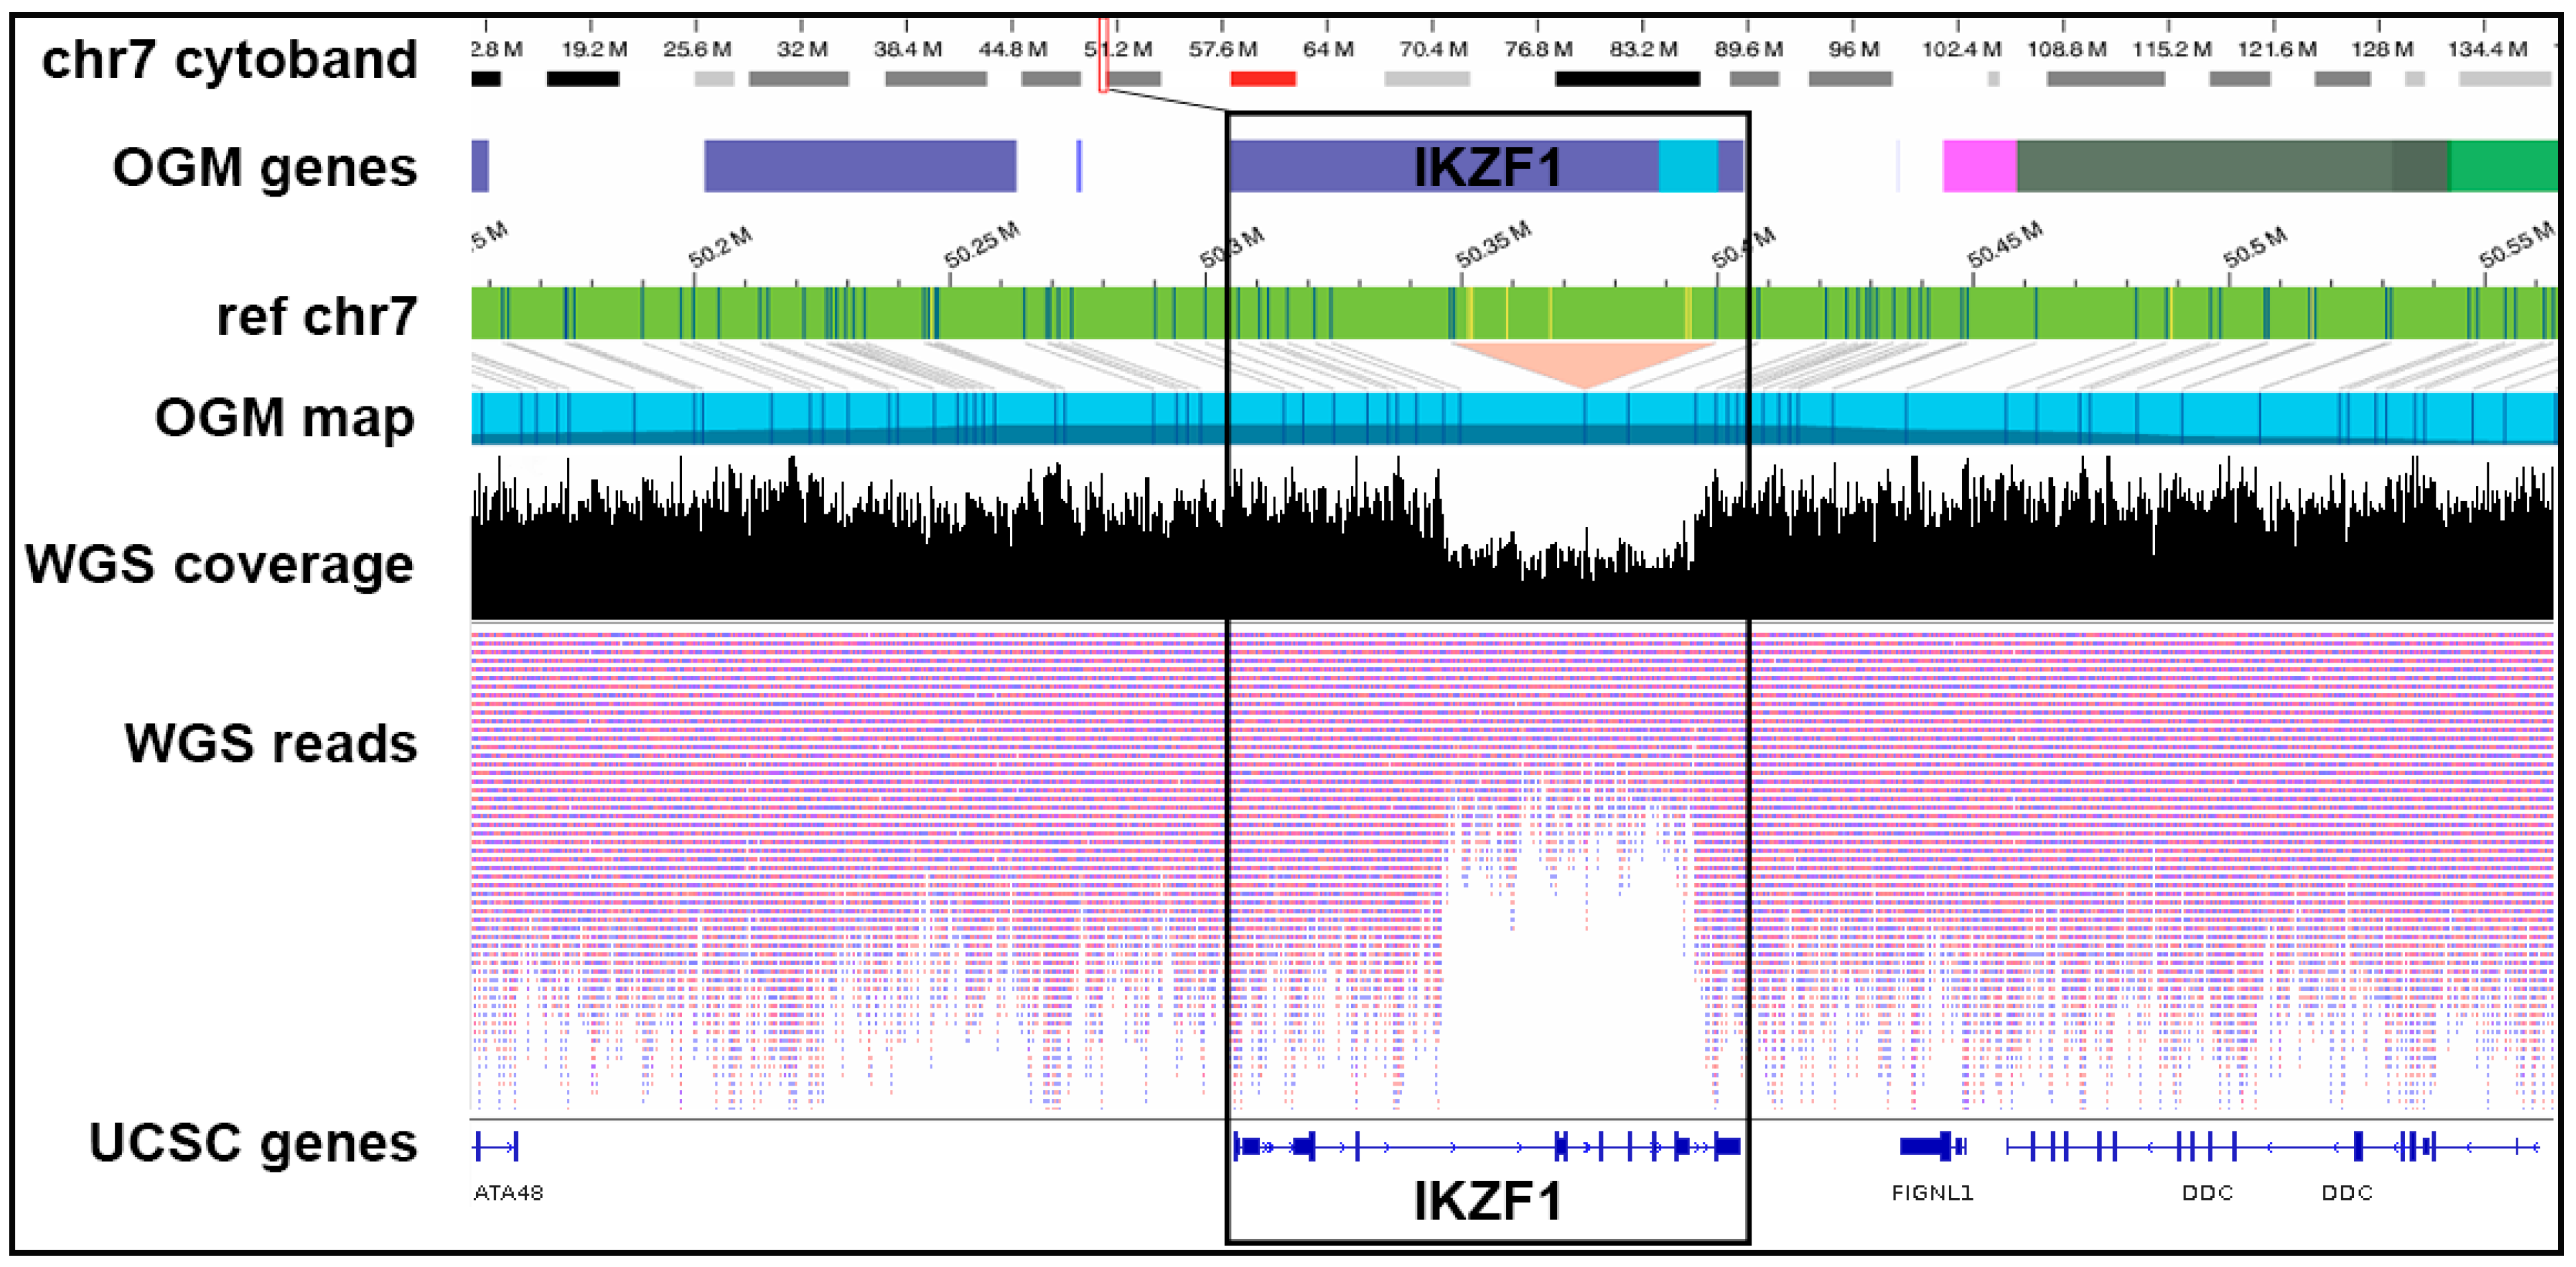
Figure 6.
OGM-derived circos plots and t(14;X) translocations with breakpoints near CRLF2 and IGH regions. (A–C) Shown are translocation visualization and circos plots from OGM analysis of three samples with IKZF1 deletions who also have t(14;X) translocations near CRLF2. Right: Track labels for circos plots are from outside to inside: chromosome number, cytoband, gene regions, SV (blue = deletion, red = insertion, pink = inversion, green = duplication), copy number, translocations. Left: OGM maps identifying translocation. Tracks are specified on the left. The CRFL2 gene region is marked with an asterisk on chrX. Blue and yellow lines represent DLE-1 labeled areas on the patient OGM map or the reference chromosomes; grey lines indicate the alignment of the patient map to the reference genome. The pink area on the de novo patient map represents an unalignable junction. (D) Normalized RNA-Seq expression values for 7 individuals containing CRLF2 rearrangements or nearby SVs (black box) versus those with wild-type CRLF2. (E) CRLF2 is upregulated in individuals with CRLF2 rearrangements or nearby SVs. MA plot showing average expression and log2 fold change FDR <0.05 and a minimum fold-change of 1.5.
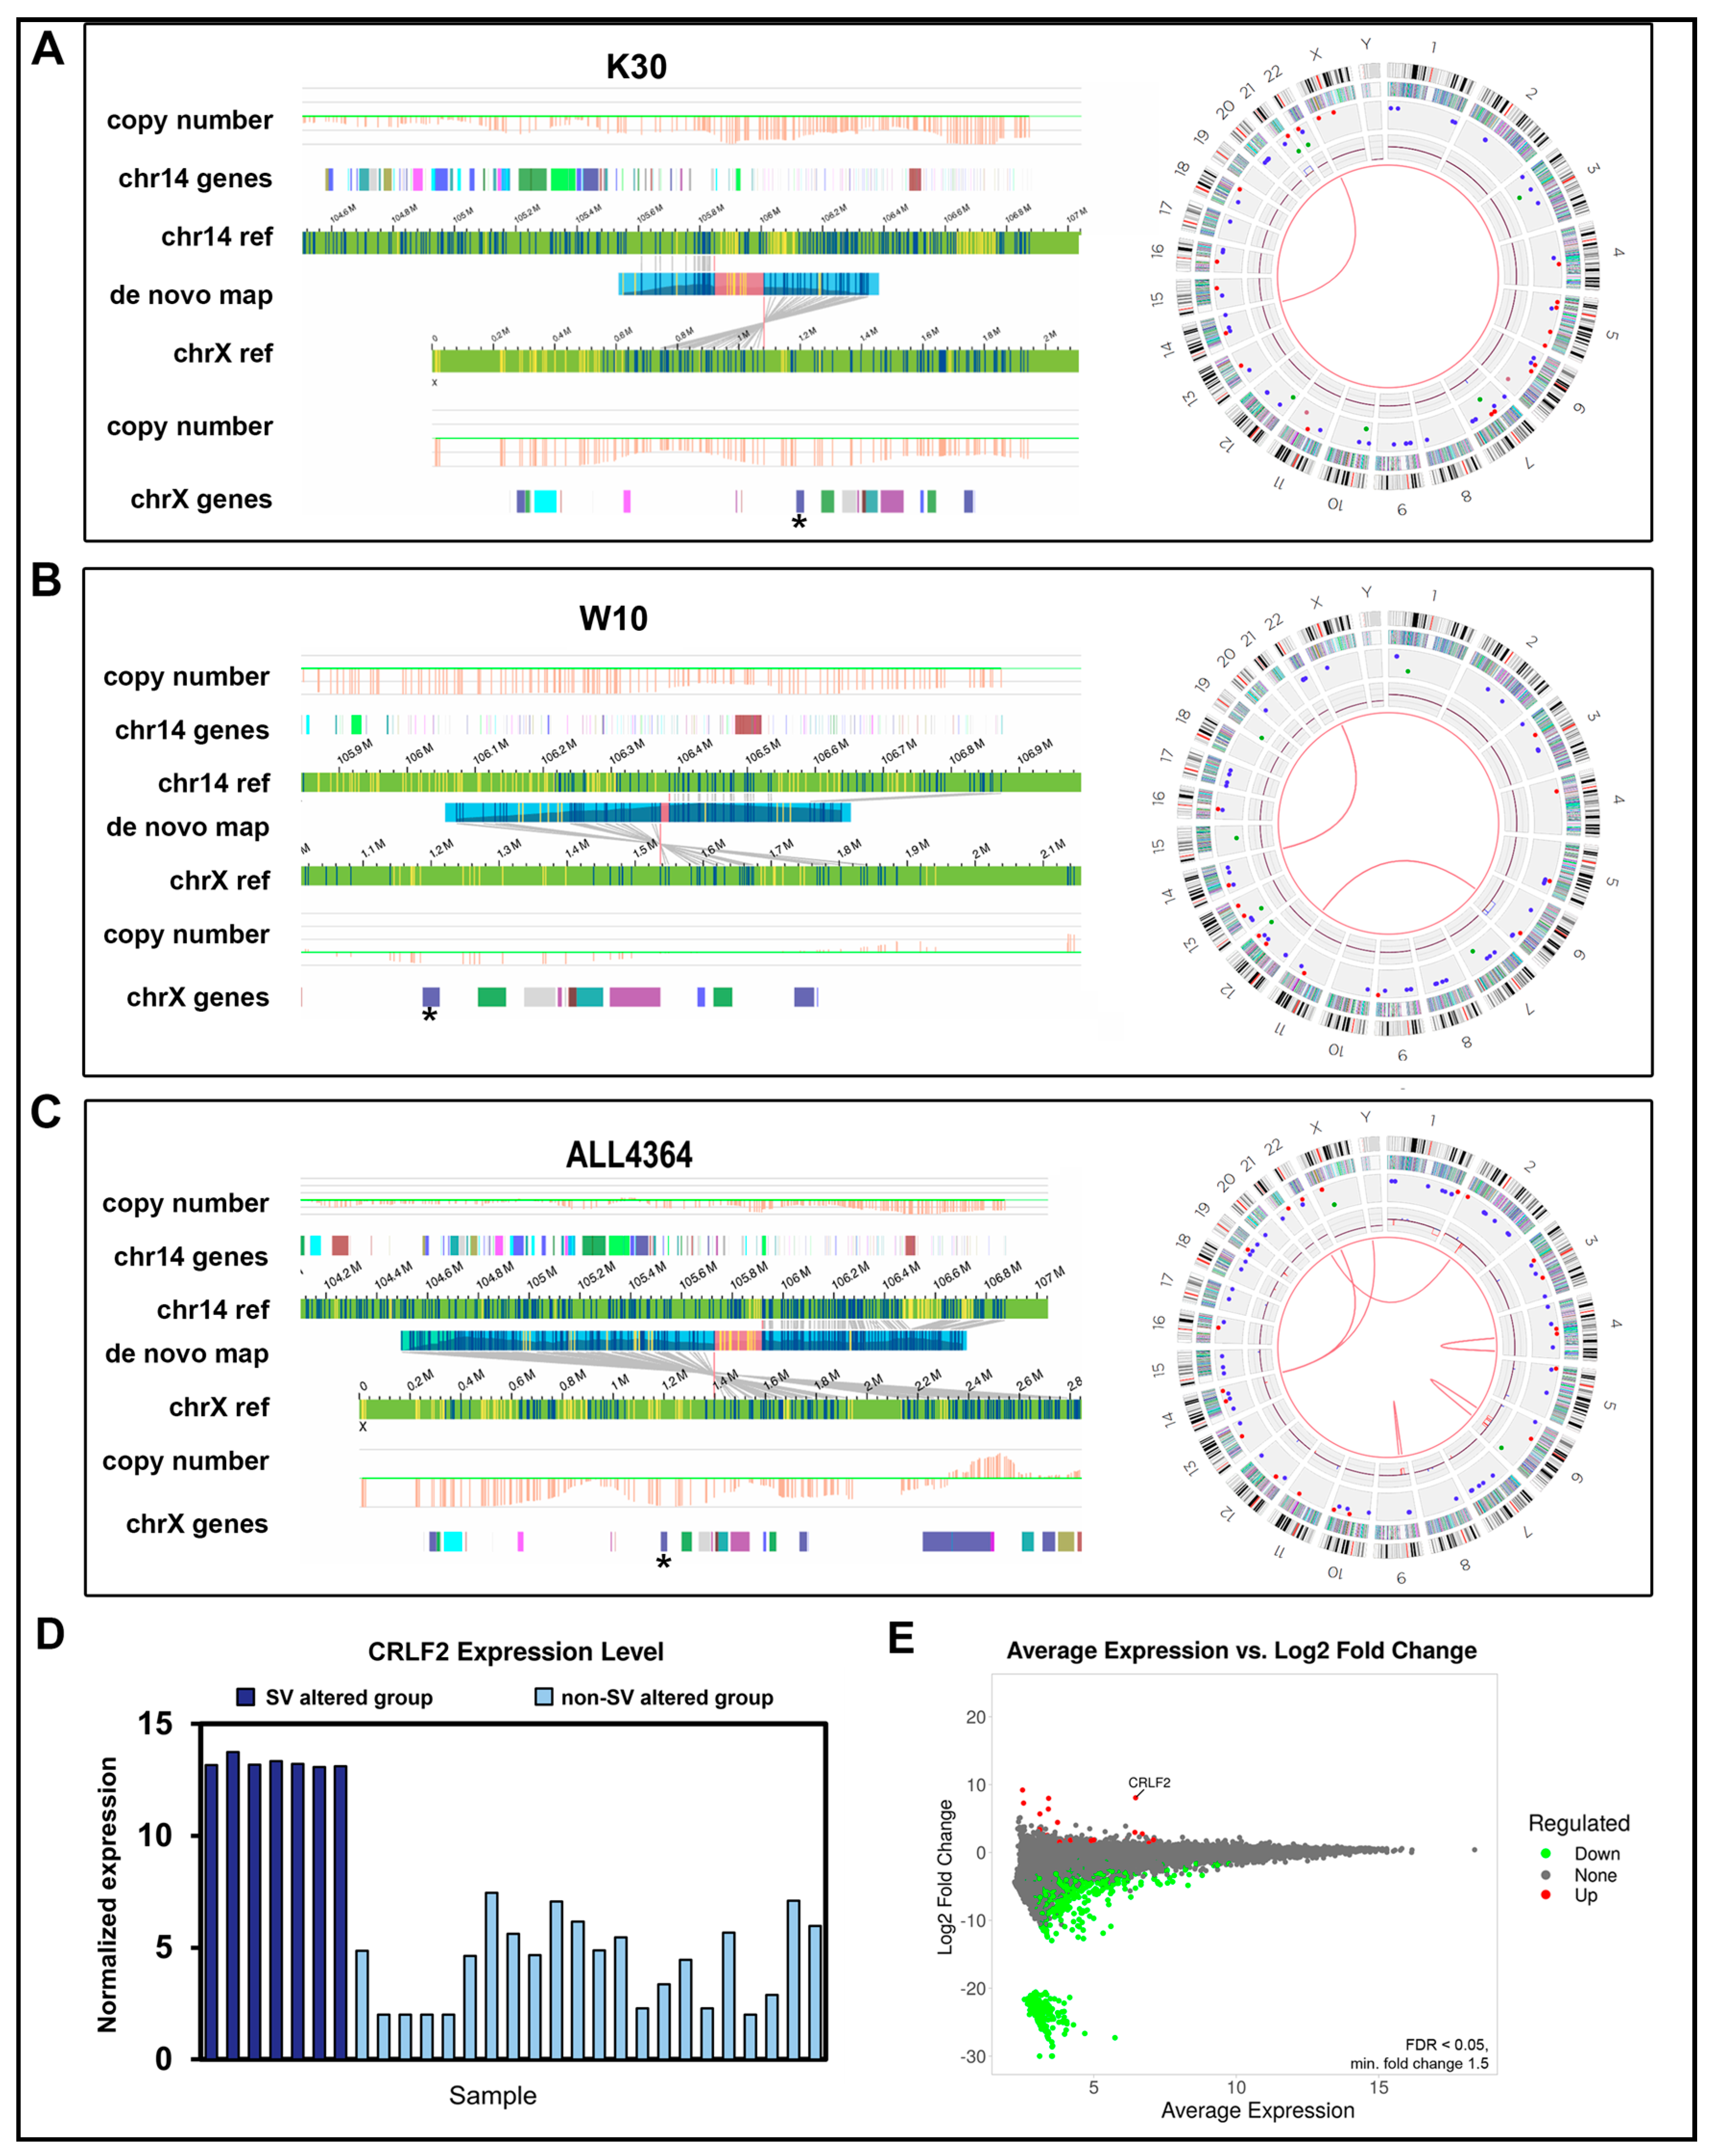
Figure 7.
A more comprehensive gene-fusion landscape in B-ALL: (A) Putative gene fusion events identified by either WGS, OGM, or both technologies. Waterfall plot depicts counts of annotated gene fusion events using OGM’s in-house annotations (green), WGS Oncofuse annotated breakpoints (blue), or both technologies (orange). WGS fusion pairs with a breakpoint in a repeat region are greyed out. Fusion pairs with evidence of expression in ≥1 sample (≥16 supporting RNA-Seq reads) are marked with an asterisk. (B) OGM circos plot from sample PAWFUU using the RVP showing a ABL1::ZMIZ1 t(9;10) translocation. Track labels are as follows from outside to inside: chromosome number, cytoband, gene regions, SV (blue = deletion, red = insertion, pink = inversion, green = duplication), copy number, translocations. (C) View of the ABL1::ZMIZ1 fusion in OGM data in the same individual. Blue and yellow lines represent DLE-1 labeled areas on the patient OGM map or the reference chromosomes; grey lines indicate the patient map as it aligns to the reference genome. (D) WGS split-read alignments indicating reads that map to two different regions of the genome, between chr9 and chr10, supporting an ABL1::ZMIZ1 fusion at intron 1 of ABL1 and exon 16 of ZMIZ1 in the same individual. The reads supporting the reference allele are depicted on the bottom panel. Reads aligning to the minus strand are red and those aligning to the plus strand are purple. The un-sequenced space between read pairs is depicted by gray bars. Green reads mean overlap of mate pair reads. (E) Gene fusion events detected by WGS, OGM, and RNA-Seq in 29 B-ALL individuals and the overlap of those fusion events detected using two methods. The 8 fusions with expression data are listed in Table 2.
A more comprehensive gene-fusion landscape in B-ALL: (A) Putative gene fusion events identified by either WGS, OGM, or both technologies. Waterfall plot depicts counts of annotated gene fusion events using OGM’s in-house annotations (green), WGS Oncofuse annotated breakpoints (blue), or both technologies (orange). WGS fusion pairs with a breakpoint in a repeat region are greyed out. Fusion pairs with evidence of expression in ≥1 sample (≥16 supporting RNA-Seq reads) are marked with an asterisk. (B) OGM circos plot from sample PAWFUU using the RVP showing a ABL1::ZMIZ1 t(9;10) translocation. Track labels are as follows from outside to inside: chromosome number, cytoband, gene regions, SV (blue = deletion, red = insertion, pink = inversion, green = duplication), copy number, translocations. (C) View of the ABL1::ZMIZ1 fusion in OGM data in the same individual. Blue and yellow lines represent DLE-1 labeled areas on the patient OGM map or the reference chromosomes; grey lines indicate the patient map as it aligns to the reference genome. (D) WGS split-read alignments indicating reads that map to two different regions of the genome, between chr9 and chr10, supporting an ABL1::ZMIZ1 fusion at intron 1 of ABL1 and exon 16 of ZMIZ1 in the same individual. The reads supporting the reference allele are depicted on the bottom panel. Reads aligning to the minus strand are red and those aligning to the plus strand are purple. The un-sequenced space between read pairs is depicted by gray bars. Green reads mean overlap of mate pair reads. (E) Gene fusion events detected by WGS, OGM, and RNA-Seq in 29 B-ALL individuals and the overlap of those fusion events detected using two methods. The 8 fusions with expression data are listed in Table 2.
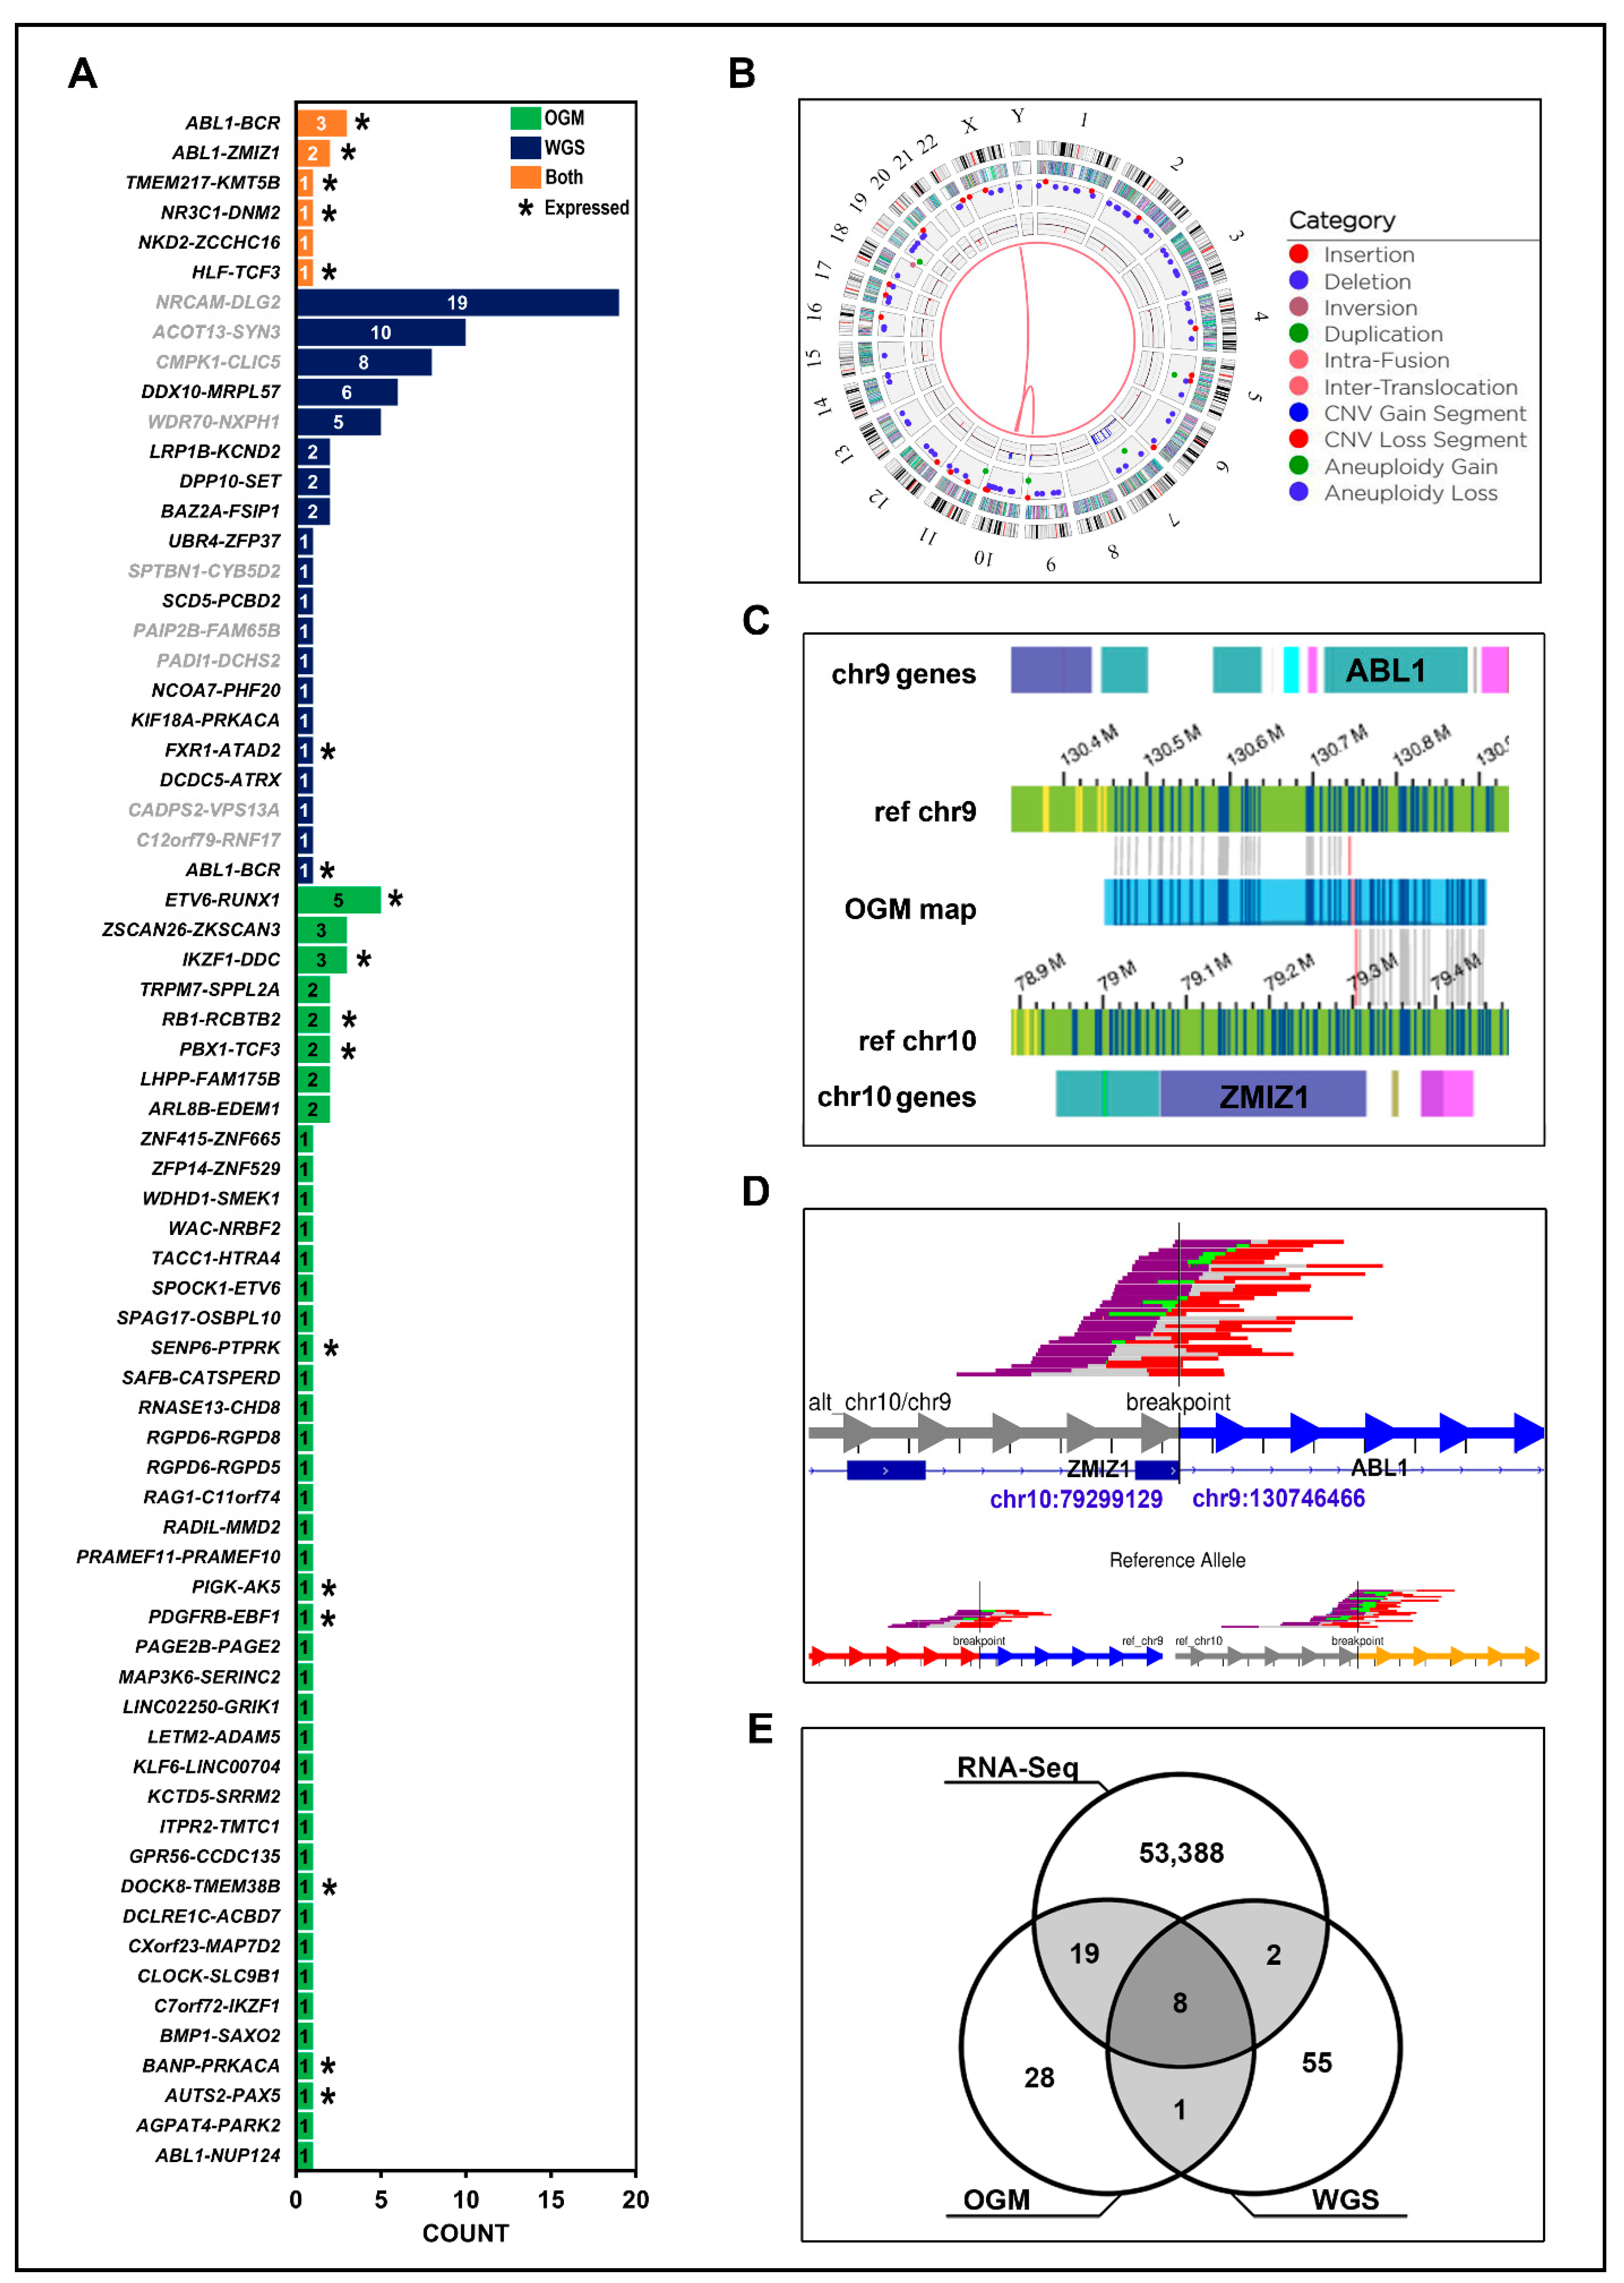
Figure 8.
OGM complex rearrangement not reported by DELLY in a Hispanic individual: W13: (A) t(7;9) inverted translocation causing a PAX5::AUTS2 fusion event. Blue and yellow lines represent DLE-1 labeled areas on the patient OGM map or the reference chromosomes; grey lines indicate the patient map as it aligns to the reference genome. (B) The same individual carries a t(7;8) translocation causing juxtaposing FGFR1 and AUTS2 but in opposite orientations and ultimately not leading to a gene fusion. Both rearrangements were detected with the OGM rare variant pipeline (RVP). The pink area on the OGM map indicates a small unalignable junction between the breakpoints. (C) Circos plot view of the t(7;8) and t(7;9) translocations. Track labels are as follows from outside to inside: chromosome number, cytoband, gene regions, SV (blue = deletion, red = insertion, pink = inversion, green = duplication), copy number, translocations.
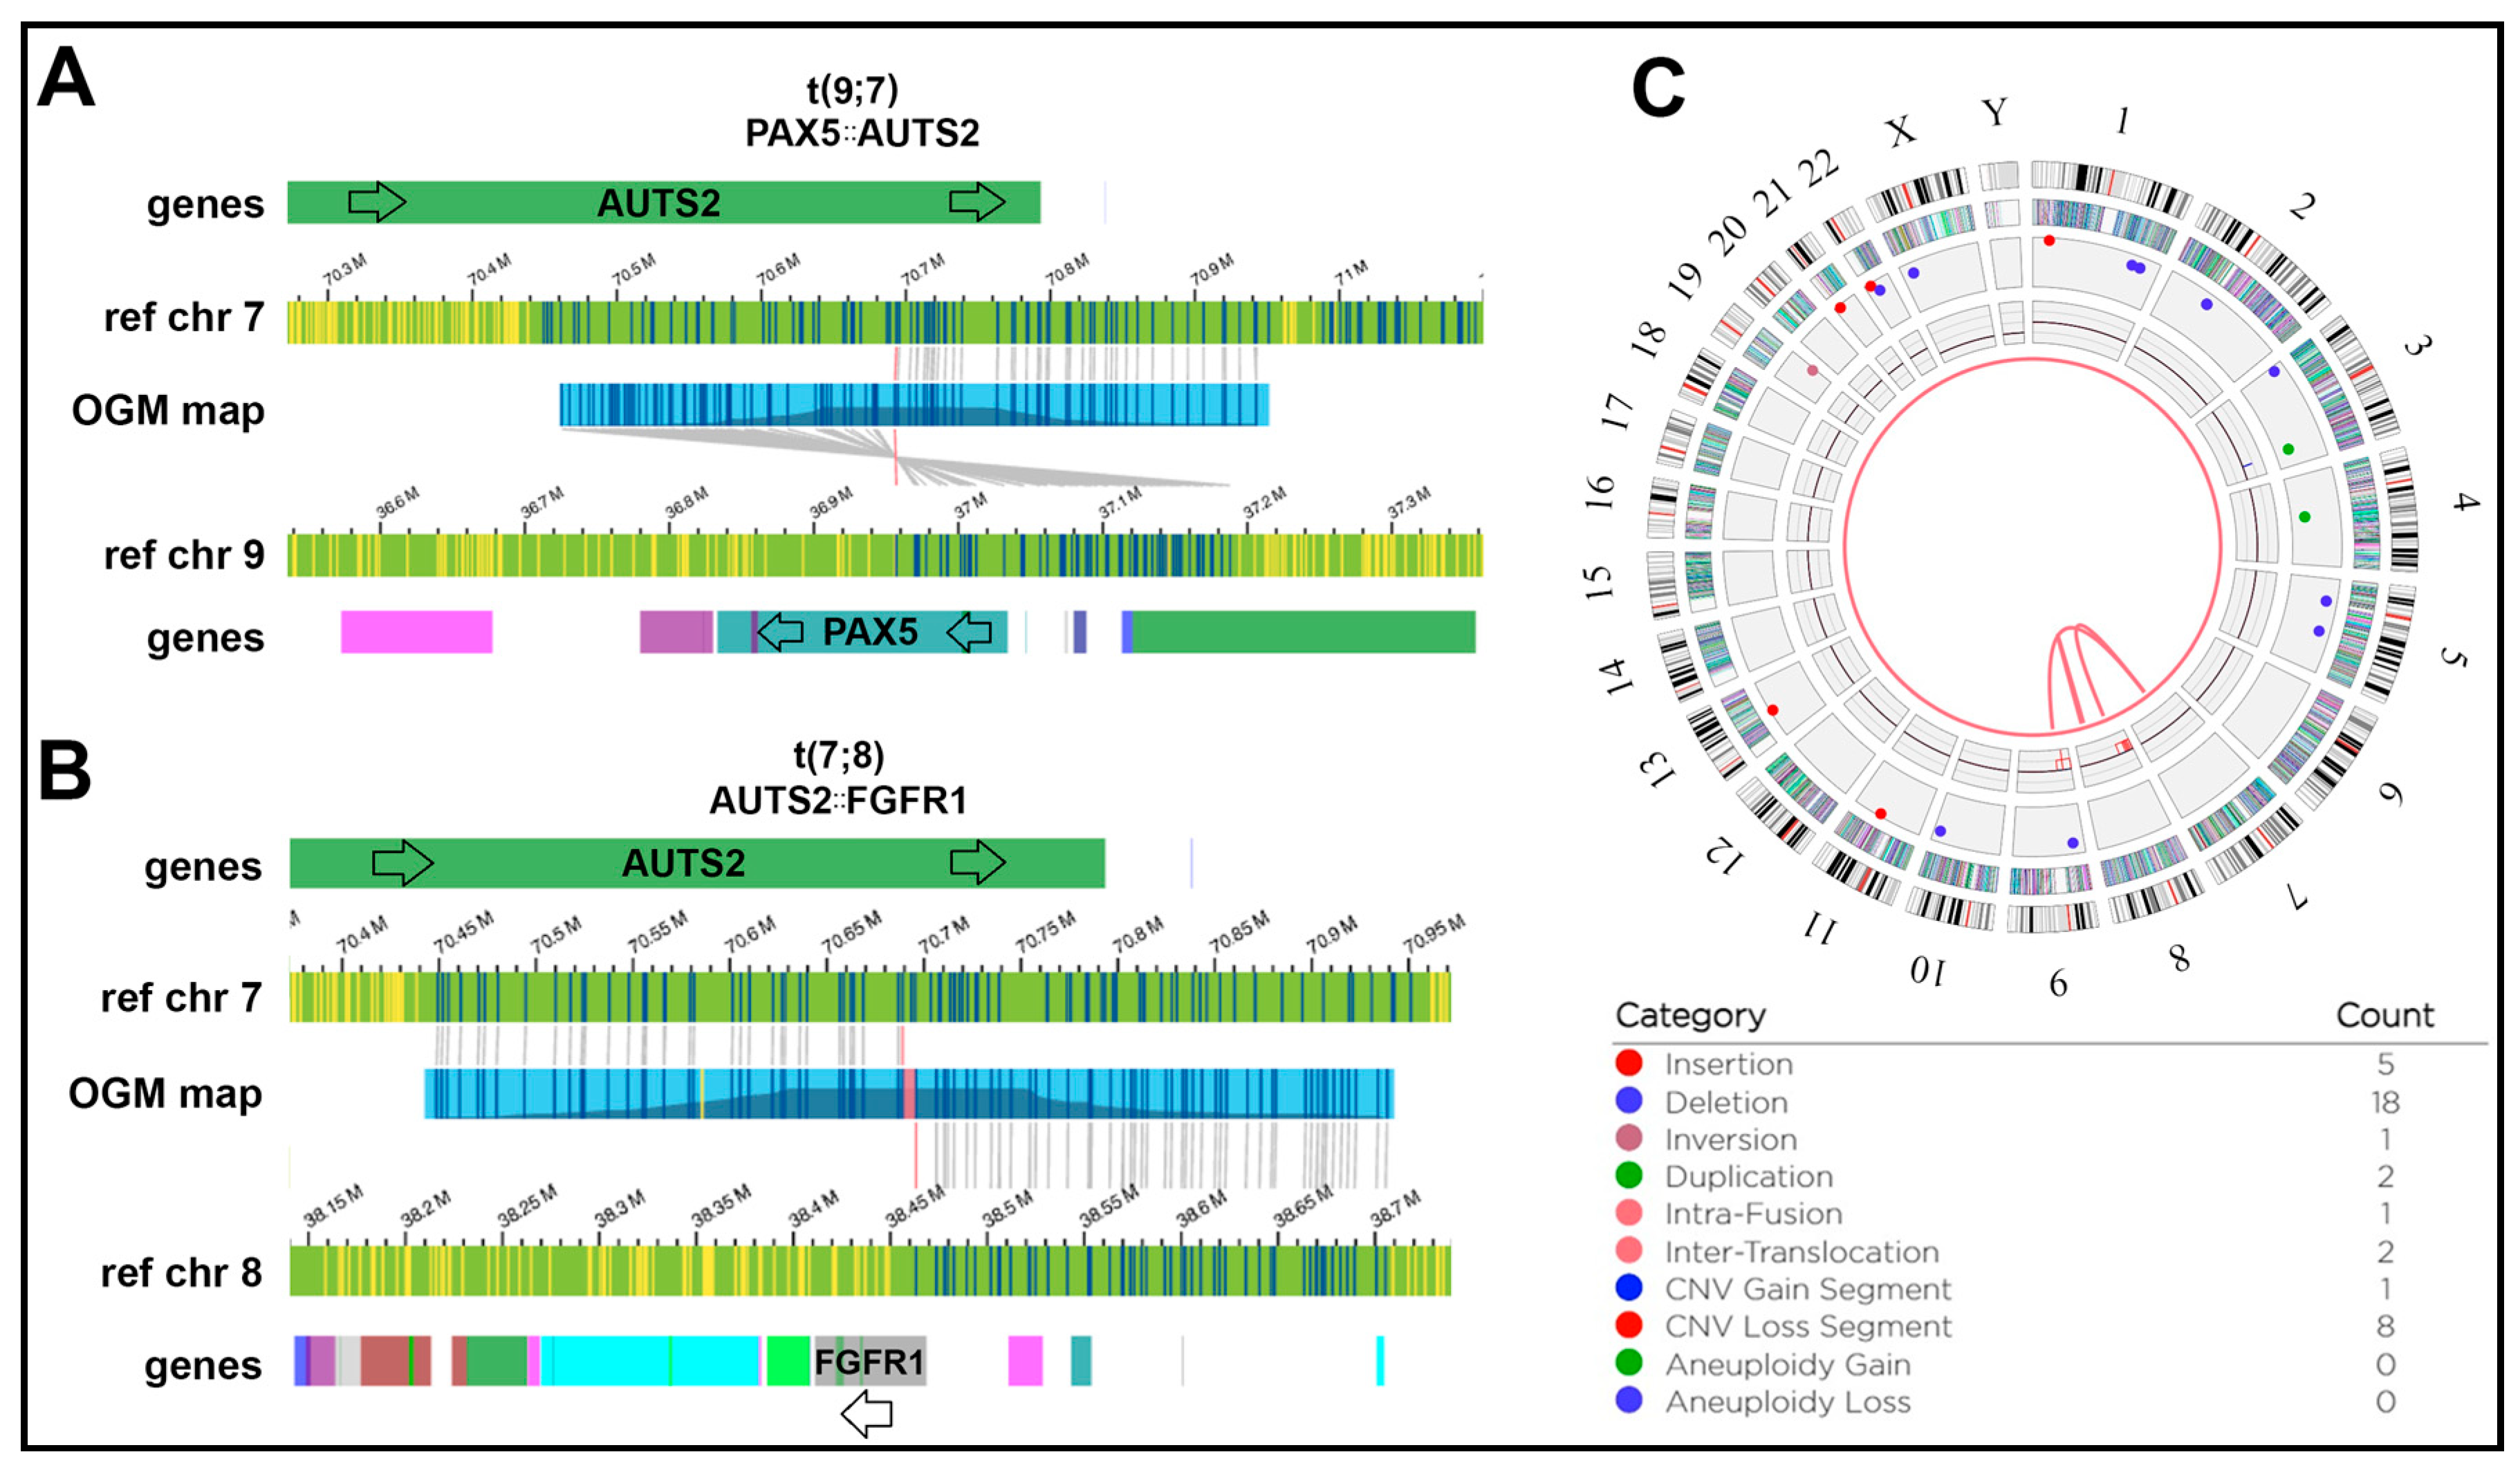
Table 1.
A comparison of known cytogenetic features to WGS and OGM calls in pediatric B-ALL samples.
Table 1.
A comparison of known cytogenetic features to WGS and OGM calls in pediatric B-ALL samples.
| Sample | Known Cytogenetics | WGS | OGM | Differences from Cytogenetics |
|---|---|---|---|---|
| W0 | IKZF1 deletion | IKZF1 deletion confirmed. | IKZF1 deletion confirmed. | Concur |
| W10 | IKZF1 deletion | IKZF1 deletion confirmed. | IKZF1 deletion confirmed. IGH::CRLF2 translocation | OGM reports IGH::CRLF2 translocation |
| W13 | IKZF1 wild type | Normal IKZF1 confirmed | Normal IKZF1 confirmed | Concur |
| W31 | IKZF1 wild type | IKZF1 deletion reported | IKZF1 deletion reported | WGS and OGM report deletion in IKZF1 (Figure 5) |
| MXP3 | BCR::ABL1 translocation, IKZF1 deletion, PAX5 deletion | IKZF1 and PAX5 deletions confirmed. BCR::ABL1 translocation confirmed | IKZF1 and PAX5 deletions confirmed. BCR::ABL1 translocation confirmed | Concur |
| ICN1 | BCR::ABL1 translocation | BCR::ABL1 translocation confirmed | BCR::ABL1 translocation confirmed | Concur |
| ALL4364 | IGH::CRLF2 | IGH::CRLF2 translocation reported but does not pass filtering | abParts::KIAA0125 translocation near but not involving CRLF2 | OGM and WGS do not report IGH::CRLF2 but OGM identifies a nearby translocation |
| PVCRK | IGH::EPOR translocation, CDKN2A, IKZF1, and JAK2 deletions | No IGH::EPOR translocation reported. CDKN2A and IKZF1 deletion confirmed. No JAK2 SV reported. | No IGH::EPOR translocation. IKZF1, PAX5, and CDKN2A deletions confirmed. No JAK2 SV reported | Additional PAX5 deletion identified by OGM. No IGH::EPOR translocations reported in WGS or OGM. No JAK2 SV reported by OGM or WGS |
| PAVDRS | IGH::EPOR, CDKN2A, IKZF1, and PAX5 deletions | No IGH::EPOR translocation. IKZF1, CDKN2A deletions confirmed. No PAX5 deletion reported | No IGH::EPOR translocation. IKZF1, CDKN2A, and PAX5 deletions confirmed. | WGS does not report the PAX5 deletion |
Table 2.
Summary of gene fusions detected by both WGS and OGM and any evidence of corresponding expression from RNA-Seq.
Table 2.
Summary of gene fusions detected by both WGS and OGM and any evidence of corresponding expression from RNA-Seq.
| Fusion | Sample | Location | OGM | WGS | RNA-Seq |
|---|---|---|---|---|---|
| TMEM217::KMT5B | ALL-19 | chr6:37,243,578 > chr11:68,174,277 | ✓ | ✓ | ✓ |
| BCR::ABL1 | G2650 | chr9:130,854,197 > chr22:23,219,813 | ✓ | ✓ | ✓ |
| NR3C1::DNM2 | G2650 | chr5:143,350,483 > chr19:10,739,595 | ✓ | ✓ | ✓ |
| BCR::ABL1 | ICN1 | chr9:130,846,798 > chr22:23,290,277 | ✓ | ✓ | ✓ |
| BCR::ABL1 | MXP3 | chr9:130,821,448 > chr22:23,290,361 | ✓ | ✓ | ✓ |
| ABL1::ZMIZ1 | PAVCYL | chr9:130,746,469 > chr10:79,299,033 | ✓ | ✓ | ✓ |
| HLF::TCF3 | ALL-07 | chr17:55,319,005 > chr19:1,619,186 | ✓ | ✓ | ✓ |
| ABL1::ZMIZ1 | PAWFUU | chr9:130,746,466 > chr10:79,299,129 | ✓ | ✓ | ✓ |
| NKD2::ZCCHC16 | ICN1 | chr5_KI270792v1alt:30755 > chrX:112,294,171 | ✓ | ✓ | ✕ |