The effects of stocking rate, residual sward height, and forage supplementation on forage production, feeding strategies, and productivity of milking dairy cows
[ad_1]
Introduction
The stocking rate (SR) is a crucial factor that influences system efficiency in grazing dairy where pastures serve as the primary feed source (McMeekan and Walshe, 1963; Baudracco et al., 2011). These systems are capable of achieving high milk outputs per hectare at low costs (Dillon et al., 2005). However, recent shifts in land competitiveness and fluctuations in international milk prices have compelled dairy farmers to enhance productivity, leading to increases in either SR or individual milk production or in both (Macdonald et al., 2017; Fariña and Chilibroste, 2019).
Dairy grazing systems have established their economic sustainability and competitiveness through effective pasture production and usage. Systems that maximize pasture utilization reap benefits in terms of productivity and profitability (Chataway et al., 2010; Ramsbottom et al., 2015), thereby maintaining resilience against market prices and climate threats (Fariña and Chilibroste, 2019). Strategies aimed at increasing the SR directly impact the amount of grass harvested (Baudracco et al., 2011), reducing the milk production costs without compromising home-grown forage production. However, the increase in productivity demands additional inputs (e.g., concentrates and silage) to meet the nutritional requirements of the cows (Baudracco et al., 2011; Macdonald et al., 2017). This heightened productivity also requires infrastructure designed to provide supplements, requiring significant investment and intensive labor (Dillon et al., 2005; Fariña and Chilibroste, 2019).
A higher SR in grazing systems typically results in lower forage allowances (FA) [in kg dry matter (DM) offered per cow], often leading to reduced post-grazing residuals, which can impact on animal performance (Ganche et al., 2013). As indicated by Merino et al. (2019), controlling the FA allows for the control of the impact of post-grazing height on animal consumption, subsequently influencing milk production. Higher FA and lower defoliation intensities have been associated with increased DM intake (DMI) and milk production in cows (Delaby and Peyraud, 2003; Menegazzi et al., 2021).
In Uruguayan dairy systems, particularly during autumn, which marks the sowing season of perennial and annual grasses, the SR may vary from 1,500 to 2,500 kg LW/ha on the grazing area. This intensifies pressure on pastures, leading to a greater defoliation intensity and immediate higher grass usage by cows (Chilibroste et al., 2003), where the accumulation of over-grazing events significantly contributes to reductions in home-grown forage production and persistence in grazing systems (Ganche et al., 2014).
The relationship between animals and plants during grazing events is so influential that mismatches can impact either the animal or the forage productivity. The effect of grazing residuals on subsequent pasture growth is temporary—for example, Chapman (2016) demonstrated that higher defoliation intensities extend the lag phase while plant energy status is rebuilt and the first re-growing leaf appears. Pastures managed with lower defoliation intensities contribute to improved forage and animal productivity responses, creating areas that are both over- and under-grazed, influencing growth and competitive relationships among plants (Hodgson and White, 2000). This heterogeneous configuration is the result of sectorized defoliation and recurrent decoupling between feeding supplies. Furthermore, low defoliation intensity might lead to reduced growth rates as more plant energy is directed into stem elongation. Dead matter, along with stem material, can shade out new tillers, thereby decreasing tiller density (McCarthy et al., 2014). However, since the timing of the maximum average growth rate depends on the relative rates of new leaf growth and senescence, the maximum forage mass (FM) target will be reached earlier.
Some farmlet studies have been conducted with grazing systems based on legumes such as Medicago sativa (Baudracco et al., 2011) or perennial grasses such as Lolium multiflorum (Fariña et al., 2011; Macdonald et al., 2017), exploring the effect of SR on systems. The plasticity of perennial pastures raises the question of whether the levels of harvest and animal performance could be affected by the application of grazing management practices that optimize forage production and quality. Notwithstanding, there is currently available information on long-term farm studies for a grazing area composed of a mixture of annual (L. multiflorum) and perennial (Dactylis glomerata) grasses with legumes (T. repens) for Uruguayan conditions (Stirling et al., 2021). There is no information available of how SR and residual sward height (RH) impact on biophysical indicators at the farm level.
The aim of this research was to evaluate the effect of SR and RH on milk, milk solids production and forage usage, along with the associated feeding strategies for crossbred Holstein–Jersey dairy cows over a farmlet study over 3 years. The cows were stocked at two different rates (SR, 1.5 and 2.0 cow per hectare) combined with two levels of post-grazing residual sward height (RH): high (HR) and low (LR) grazing annual and perennial grasses over a 3-year term.
Materials and methods
The investigation was undertaken in the dairy unit at the Centro Regional Sur research station, Agronomy College, located in Canelones, Uruguay (34°36.810 S, 56°13.088 W). The experiment involved four systems in a 3-year study (January 2017 to December 2019).
Description of the farmlet study
The study grazing areas consisted of a 4-year rotation combining annual grasses (Avena sativa with L. multiflorum and Sorghum bicolor) and three years of perennial pastures (D. glomerata with T. repens), a common characteristic of the national pasture-based dairy system. The study explored four intensification strategies to increase home-grown forage utilization and output per hectare through a twofold increase in SR and two post-grazing RH. During the first year, there was an area of 20% of third-year mixed lucerne (M. sativa) pasture to establish a stabilized rotation. A total of 24 cows were allocated to one of the four 2 × 2 factorial arrangements of treatments: two stocking rates (SR); 1.5 or 2.0 milking cows per hectare combined with two contrasting residual heights (RH): a conventional residual sward height of 6 to 7 cm was maintained all year round for low residual (LR), and a high residual (HR) suggests a grazing management approach that allows for a higher residual of 9 to 10 cm on average throughout the year. Thus, four treatments resulted from the combination of these two factors: 1.5LR, 1.5HR, 2.0LR, and 2.0HR. The grazing area (e.g., the area where cows have direct access) integrated 56 ha assigned as follows: 32 ha for 1.5LR and 1.5HR divided into 16 ha each, and 24 ha for 2.0LR and 2.0HR representing 12 ha each. This area comprised five paddocks for treatments 1.5 LR and HR and four paddocks for 2.0 LR and HR. The paddocks’ average size (3 ha) was evenly distributed across the entire area of the experimental farm to balance the four systems in terms of soil-type location, distance from the milking parlor, and pasture species.
Pasture sown and fertilizer
Each year, 50% of the grazing area (8 ha for 1.5 LR–1.5 HR and 6 ha for 2.0 LR–2.0 HR) was renewed with first year pasture (D. glomerata and T. repens) and annual grasses (L. multiflorum) in the autumn. The amounts of target seed at sowing were 18, 2.5, and 20 kg/ha for D. glomerata, T. repens, and L. multiflorum, respectively.
All systems were fertilized with nitrogen (N) after every grazing cycle (dependent on the growth rate in the grazing area) between July and November using urea (0.46 N) at a varying rate from 75 to 100 kg urea/ha per application. In autumn, 108 kg/ha of fertilizer mix (7 g/kg N and 40 g/kg P) was used for pastures and annual grasses at sowing. The perennial pasture re-fertilization rates varied depending on P Bray soil content, establishing minimum rates of 12 g/kg P for grasses and 20 g/kg P for M. sativa pastures.
Animals
Every year, in March, Holstein–Jersey dairy cows (n = 96) were randomly assigned to one of the four treatments (i.e., 1.5LR, 1.5HR, 2.0LR, and 2.0HR) of 24 cows each based on parity (2.1 ± 1.6, 2.5 ± 1.1, and 2.4 ± 1.2), body weight (BW) (520 ± 87, 548 ± 80, and 534 ± 77 kg), and body condition score (BCS) (2.9 ± 0.5, 3.7 ± 0.6, and 3.6 ± 0.4) for the years 2017, 2018, and 2019, respectively. Every year, 20% of the cows from each treatment were introduced as primiparous cows. The cows did not graze outside their grazing area at any stage of the lactation period (from March to December) and were dried off 60 days before their next expected calving date. Individual milk production was evaluated fortnightly each year until December. During the dry period, the cows were fed outside their grazing area on a natural grassland area (Allen et al., 2011) dominated by Festuca arundinacea and Stipa setigera until 25 days before calving, until the cows entered prepartum. The prepartum management consisted of offering a total mixed ration with corn silage, concentrate, and anionic salt (12, 4.0, and 0.3 kg DM/cow per day, respectively).
Grazing and feeding management
The animals grazed under rotational grazing on a new fresh strip of pasture after each milking, subdivided by electrified fences. The grazing management decision rules were based on matching the daily forage DM intake (FDMI) with the pasture growth rate (GR) while keeping the average grazing area FM at 1,800 kg DM/ha (measured through the COMPYLD method (details are provided in the section “Pasture determinations”). In addition, the phenological stage of grass in each paddock was monitored weekly to ensure adequate grazing intervals to maximize pasture growth and persistence. For this reason, the leaf growth stage was recorded on pre-grazing paddocks with three expanded leaves per tiller on D. glomerata and L. multiflorum as a pre-grazing benchmark (Donaghy and Fulkerson, 1998) and nine (for winter, spring, and summer) and 12 knots in autumn, for M. sativa. In early spring, occasional post-grazing slashing (the mechanical mowing of pasture to approximately 10 cm height) was performed when deemed necessary to maintain pasture quality and bloom control.
The energy demand of cows was determined by NRC (2001) on a weekly basis, contemplating BW, number of lactations, pregnancy, milk production, and milk fat content. As the objective was for cows to harvest directly as much grass as possible, in case the GR was higher than the cows’ demand, paddocks were mechanically harvested (grass haylage), and if the GR on the grazing platform area was lower than the cows’ demand, they were supplemented with sorghum or maize silage on the feeding yard with a mixer wagon (Mary, 2018). The amount of silage and hay that each treatment needed each year was imported outside of the grazing area. Additionally, part of the pasture haylage that treatments need was harvested within the grazing area, considered as mechanical harvest. The cows had access to one, two, or zero grazing sessions between milkings for an 8-h interval. When grazing sessions were banned due to low GR or strong rainy events, the cows stayed on a 2-ha resting paddock assigned to each treatment. The cows remained on those paddocks (between milking) with water, grass silage, or hay on bale hoops after being supplemented with silage in the feeding yard.
Concentrate was offered twice a day at the milking parlor through automatic feeders. The projected amount of concentrate delivered to the cows was the same for the four treatments (7.0, 5.0, and 3.0 kg DM/cow per day in early, mid, and late lactation, respectively), considering the requirements of a cow with a production of 6,000 L throughout its lactation. Every 15 days, the concentrate offered in the milking parlor was weighed to ensure that the amount of feed offered to the cows was correct.
Pasture determinations
The FM of each plot in each grazing area was assessed through the comparative yield method (COMPYLD) (Haydock and Shaw 1975). Every 15 days, five visual scales with three repetitions were defined in each paddock, ranging from 1 (low) to 5 (high), representing the yield scale. Before defining the scales on the terrain, the entire paddock was walked to collect representative samples of paddock yield. For each scale, a sample FM quadrant of 0.51 m × 0.30 m was placed. Five height determinations (in cm) were made using a ruler before removing the FM inside the quadrant with handled scissors at ground level. After removing the FM from each quadrant, fresh material was weighed and then dried in an oven for 48 h at 60°C to estimate dry matter content. A regression equation was developed using the dry matter yield of each scale (15 points), rating, and sward height. This calibration scale was used weekly to estimate the FM and GR in each paddock by walking through the assigned transect. At least 20 determinations of scale per paddock were registered weekly by the same trained person walking alongside the paddock transect.
Based on these observations, weekly estimates of GR, paddock FM, and average FM for each grazing area were performed. Pre- and post-grazing sward heights, after each strip of graze, were measured using a ruler to monitor the management residue on pasture, with an average of 30 measurements per strip.
The annual forage production on the grazing area was calculated as the mean of the weekly paddocks GR, which were not under grazing, multiplied by 365 days.
Forage, conserved forage, and concentrate intake
The pre- and post-grazing sward heights of each grazing daily strip were determined and converted to FM with the information provided from paddock calibration. With this information, the FDMI was estimated based on pasture disappearance, contemplating pre- and post-grazing FM multiplied by strip area and divided by the number of grazing cows.
The amount of silage offered (in kg DM/per cow per day) was registered daily using a scale mounted on a mixer wagon. The scale was calibrated weekly to ensure the accurate offering of silage based on the weekly diet formulation. If the cows left silage on the feeder, the residual amount was weighed, and the daily consumption per cow was estimated. A sample of the material left by the cows was collected to determine the DM content. This value was then multiplied by the scale value and divided by the number of cows to calculate the silage consumption per cow. In the case of haylage and hay, supply was offered on a feeding ring in the resting paddock. The weight of each bale was previously recorded on the scale, and to estimate the cow DM intake, a visual scale was created based on the total weight divided into quarters. When the cows left the resting paddock, the scale was read and the difference between the feed offered and what was left in the feeding ring, divided by the number of cows, represented the consumption per animal. The total amount of conserved forage consumed by the cows was constructed from the sum of silage, hay, and haylage.
The amount of concentrate consumed by the animals was the same as that offered. It was delivered by automatic feeders into the milking parlor during milking.
Forage direct harvest (in kg DM/ha year) was calculated as the sum of FDMI multiplied by the number of milking cows per hectare grazing in that system each year.
Animal determinations
The cow’s individual milk production was recorded fortnightly, and individual milk samples were taken during morning and evening milking on the same day. These samples were then analyzed for milk fat and milk protein content. Based on this, the milk solid production per cow was estimated. Milk at 305 days was calculated for each cow for each year as the sum of yields from calving to the last day of lactation, adjusting the lactation curve model of Wilmink (1987). The BW (in kg per cow) and BCS of all cows were recorded monthly following the morning milking. BCS was assessed by using the method of Ferguson et al. (1994), considering a scale from 1 to 5 points.
Variables at the farm scale expressed on the grazing area, such as milk and milk solids production per hectare per year, were calculated by summing the daily yields for each cow and multiplying the result by the number of milking cows per hectare on the grazing area for each year. For grazing time, the analysis was performed by integrating the proportion of days with zero, one, or two grazing turns as a percentage of the total grazing turns along the year.
Statistical analysis
The study was considered an unbalanced completely randomized block design with a factorial arrangement of two factors (SR and RH), each with two levels (1.5 and 2.0—LR and HR, respectively), considering the interaction effect between them. The paddock was considered as a repetition in space, with four repetitions for treatments 2.0 LR and 2.0 HR and five for treatments 1.5 LR and 1.5 HR. Additionally, the year was considered as a fixed effect to evaluate possible trends, and the experimental units were the groups of 24 cows. Variables related to system performance on grazing area, such as milk, milk solids, forage production and harvest, conserved forage production, forage, conserved forage, concentrate DM intake, and proportion of days with 0, 1, or 2 grazing turns were analyzed considering the effects of SR, RH, and their interaction effects as represented in Equation 1.
where µ is the mean of the variable;
1. SR is the effect of introducing 1.5 or 2.0 cows per hectare;
2. RH represents the effect of pasture residual height using 6 to 7 or 9 to 10 cm;
3. SR × RH is the interaction effect;
4. year denotes 2017, 2018, and 2019;
5. block represents the repetitions in space—four for 2.0 LR and 2.0 HR and five for 1.5 LR and 1.5 HR; and
6. ε is the experimental error.
For individual animal observations like BW, BCS, milk production, milk solids production, milk fat, and milk protein content, the cows were considered as the experimental unit. The model included SR, RH, their interaction effect (SR*RH), and year as the fixed effects. This model incorporated the group of cows (classified by parity, milk production, BW, and BCS 20 days before calving) and cows nested in year as random effects. The data were fitted with linear mixed models (lmer) using the CAR library on RStudio (1.0.153), as shown in Equation 2.
where µ is the mean of the variable;
1. SR is the effect of introducing 1.5 or 2.0 cows per hectare;
2. RH represents the effect of pasture residual height using 6 to 7 or 9 to 10 cm;
3. SR × RH is the interaction effect.
4. year denotes 2017, 2018, and 2019;
5. cow represents the ID cow nested in the year;
6. group refers to the block of cows grouped for productivity, calving date, number of lactations, BW, and BCS at calving; and
7. ε is the experimental error.
The lactcurves package (Strucken, 2021) for Rstudio (version 1.0.153) was employed to fit the data by running multiple lactation curve models and extracting the selection criteria for each model. The Wilmink function (1987) was chosen as the best fit based on the Akaike information criteria out of 32 lactation curve models. For the analysis of the lactation curves, parameters were estimated for each cow and lactation by fitting the exponential function of Wilmink (1987) for the fortnightly measurements of these variables on each cow as shown in Equation 3.
where a, b, and c are the estimated parameters that define the height of the lactation curve (a), the initial phase of post-calving inclining to peak (b), and the subsequent post-peak decline phase (c). The variable dim corresponds to days in milk for each cow. The effects of SR and RH were calculated for each parameter of the Wilmink (1987) model.
Results
Pasture growth rate and harvested forage
The results shown in Table 1 suggest that SR and RH did not have a significant impact on forage production. All treatments achieved similar levels of annual forage production, and the total amount of harvested forage (direct plus mechanical) was comparable across the different SR and RH treatments. However, the strategy employed by each system to harvest the highest amount possible of forage produced on the grazing area differed among treatments. There was an effect of SR on forage harvested directly by the animals, with SR 2.0 harvesting more forage than SR 1.5, but not on the total or mechanical harvested forage.
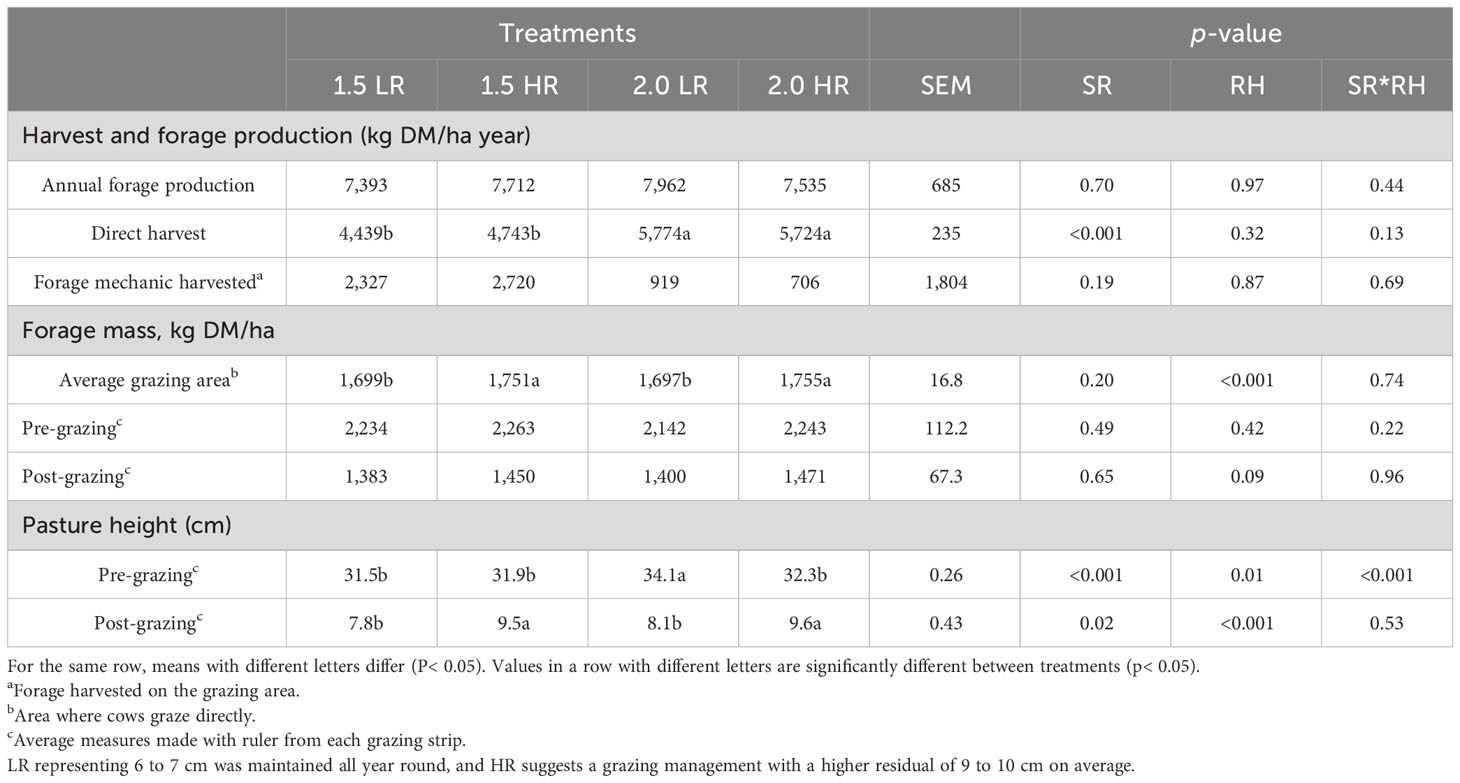
Table 1 Effects of stocking rate (1.5 and 2.0) and residual height (LR and RH) on annual forage production, average forage mass, total forage harvested on the grazing area (direct and mechanical), and pre-grazing and post-grazing sward conditions for 1.5 LR, 1.5 HR, 2.0 LR, and 2.0 HR.
The average FM on grazing area was higher for the 1.5 and 2.0 HR treatments than for the 1.5 and 2.0 LR treatments. Despite the effect of RH on the average FM on grazing area, the pre-grazing FM was not different between SR or RH. Nevertheless, a trend towards the effect of RH on post-grazing FM was observed (p = 0.09). Additionally, an interaction effect between SR and RH was observed for pre-grazing height, where 2.0 LR showed higher values than 1.5 LR, 1.5 HR, and 2.0 HR which were not different between them (Table 1). As expected, there were significant differences in the post-grazing residual height between treatments, with HR being 1.6 cm higher than LR (Table 1).
As shown in Table 2, SR influenced the levels of conserved forage and concentrates required to meet animal demands. Systems with a SR of 2.0 required a higher supply of conserved forage and concentrate, increasing by 1,121 and 1,050 kg DM/ha year, respectively, compared to those with a SR of 1.5 (Table 2).
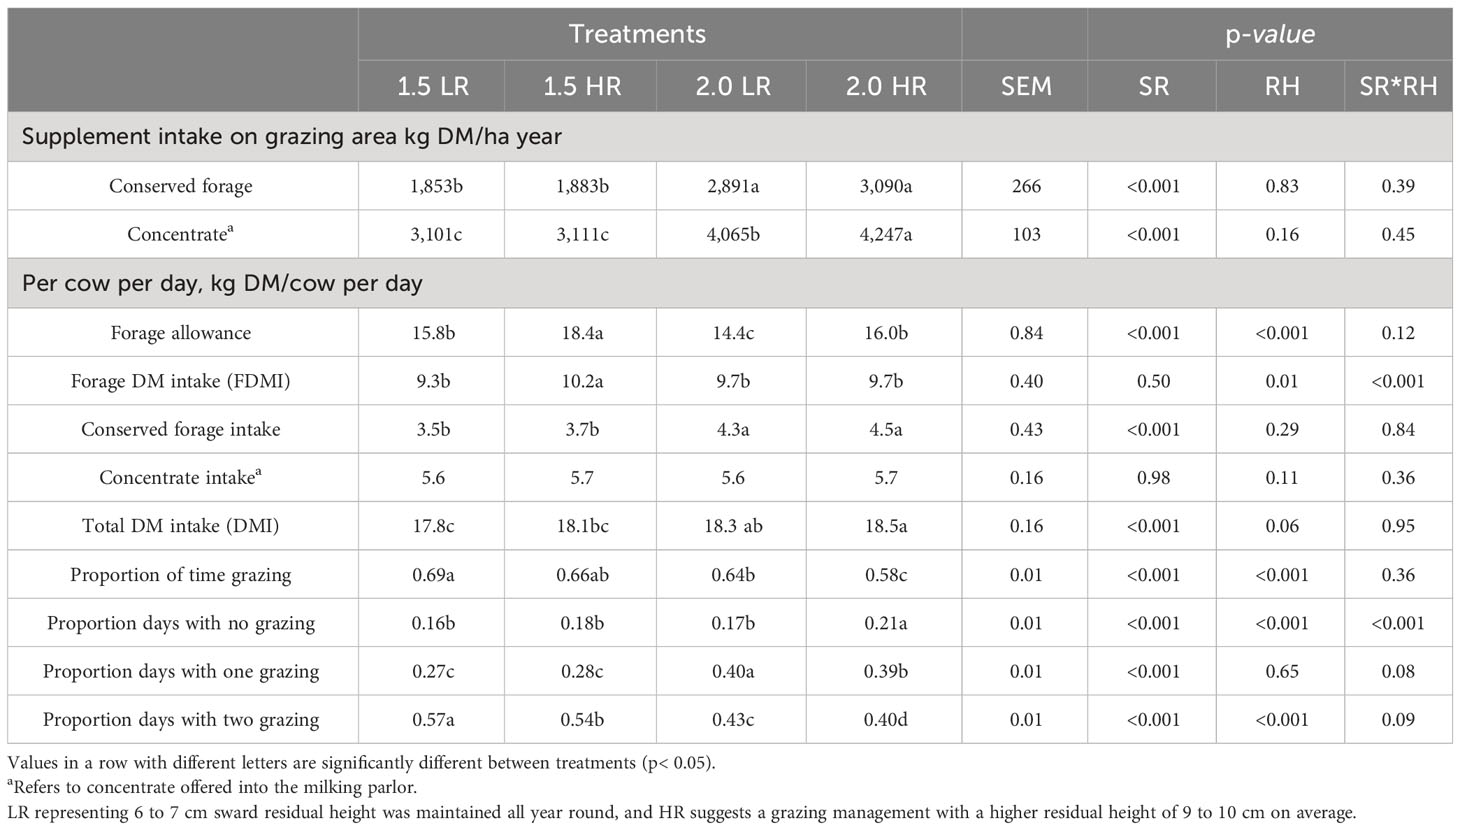
Table 2 Effects of stocking rate (1.5 and 2.0 dairy cow/ha) and pasture residual height (LR or HR) on conserved forage and concentrate intake, forage allowance, forage, conserved forage, and concentrate intake for 1.5 LR, 1.5 HR, 2.0 LR, and 2.0 HR.
A positive effect of RH (17.2 vs. 15.1 for HR and LR, respectively) and SR (17.1 vs. 15.2 for SR 1.5 and 2.0, respectively) was observed for FA (Table 2). However, for FDMI, an interaction effect between SR and RH was significant, with cows on 1.5 HR consuming 0.9 kg DM/cow per day more forage than those on 1.5 LR. Conversely, the intake of conserved forage per cow was 0.8 kg DM/day lower for 1.5 SR than for 2.0 SR, while the RH effect was not significant in the amount of conserved forage consumed per cow. Regarding the concentrate, DMI per cow per day did not differ among the four treatments, as expected, based on the experimental setup.
For the cows’ total DMI, the SR effect was significant, and there was a trend (p = 0.06) for RH effect. There were no differences between treatments for the same stocking rate, but differences were observed between 2.0 HR and 1.5 LR and HR and also 2.0 LR with 1.5 LR. As a result of how the feeding strategies were performed, the opportunities for grazing (days with either one or two grazing turns) were affected by SR. The cows in the 1.5 SR treatment had more grazing turns than those in the 2.0 SR treatment (68% vs. 61%, respectively). However, an interaction effect was reported for the proportion of time with no grazing, where higher SR levels and RH management led to longer periods with no grazing access. Furthermore, the time for one grazing turn was affected by the level of SR, with the 2.0 SR group spending 12% more time under one grazing turn than the 1.5 SR cows. Among the 2.0 SR treatments, the cows on 2.0 HR spent more time at one grazing turn compared to 2.0 LR, while there were no differences between 1.5 LR and 1.5 HR. The opportunities for two grazing sessions were affected by both SR and RH, being restricted by 14% for the 2.0 SR group in contrast to the 1.5 group, which spent 12% more time under one grazing turn than the 1.5 SR cows.
Animal response
A significant interaction effect was observed between SR and RH for milk and milk solids production per hectare per year (Table 3). Treatment 2.0 HR showed higher milk and milk solids production than 2.0 LR, and both of these treatments achieved higher production than 1.5 LR and 1.5 HR, with no significant differences among them. The individual performance in terms of milk production and milk protein content did not show significant effects of SR and RH.
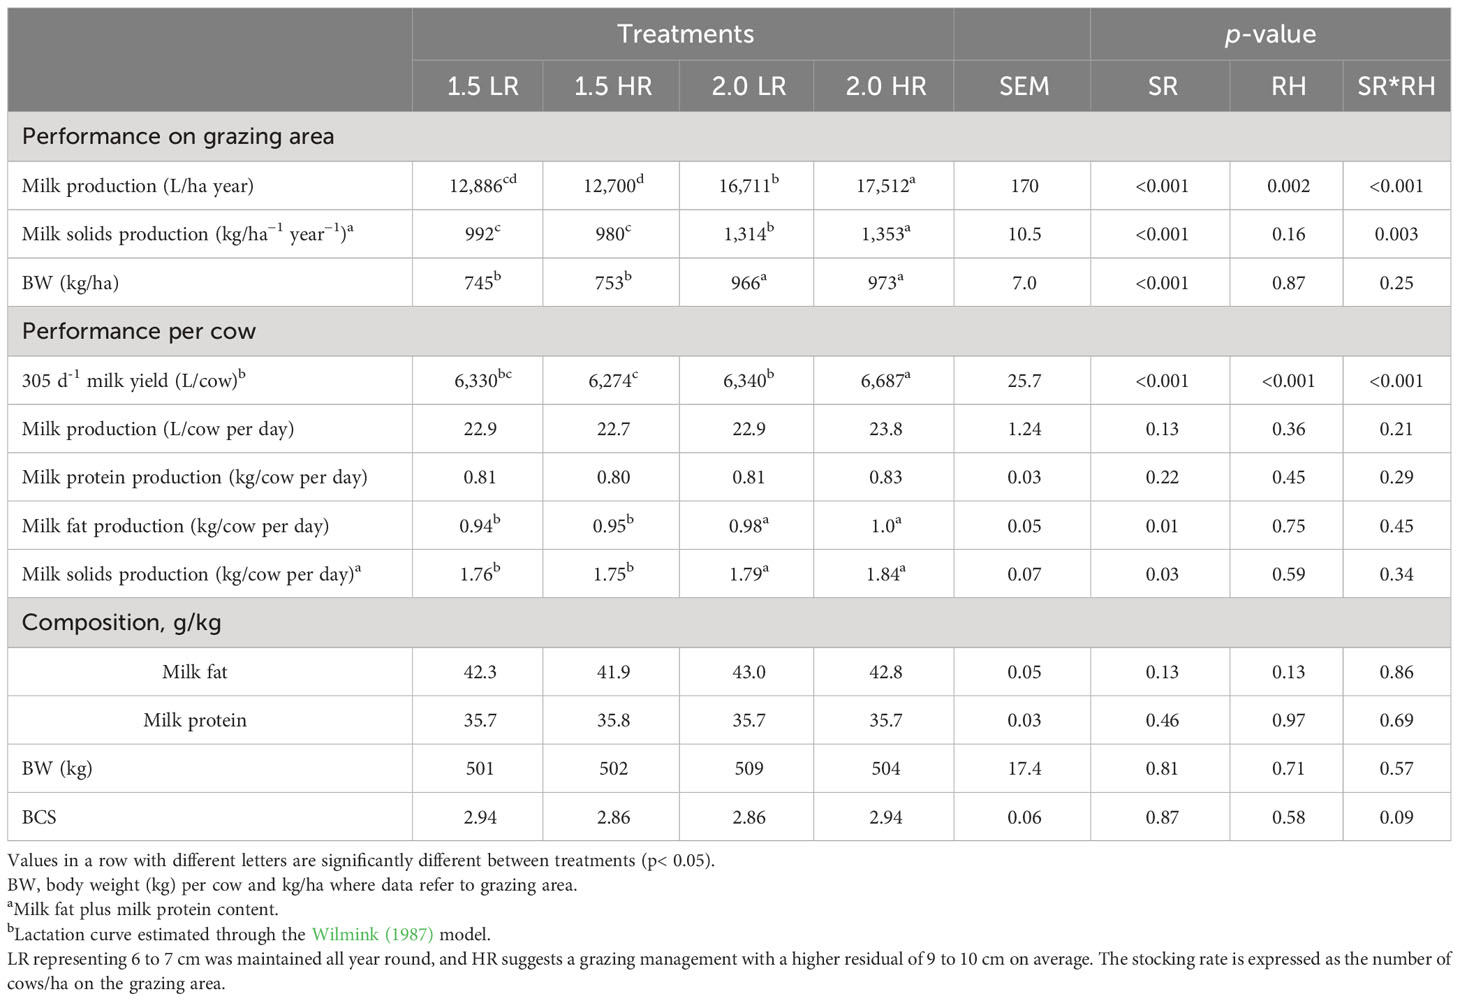
Table 3 Effects of stocking rate (1.5 and 2.0) and pasture residual height (LR or HR) on milk (kg/cow per day) and milk solids production per cow and farm scale on.
Individual milk yield at 305 days was influenced by SR and RH (Table 3, Figure 1) and their interaction effects, where the performance of 2.0 HR cows was the highest of the four treatments (Table 3). For BCS and BW, the effects of stocking rate and management were not significant; however, there was a tendency for an interaction effect between factors for BCS (p = 0.09). Concerning BW per hectare, it was affected by the level of SR, with a difference of 218 kg ha−1 year−1 between the stocking rate of 2.0 compared to 1.5 cows per hectare.
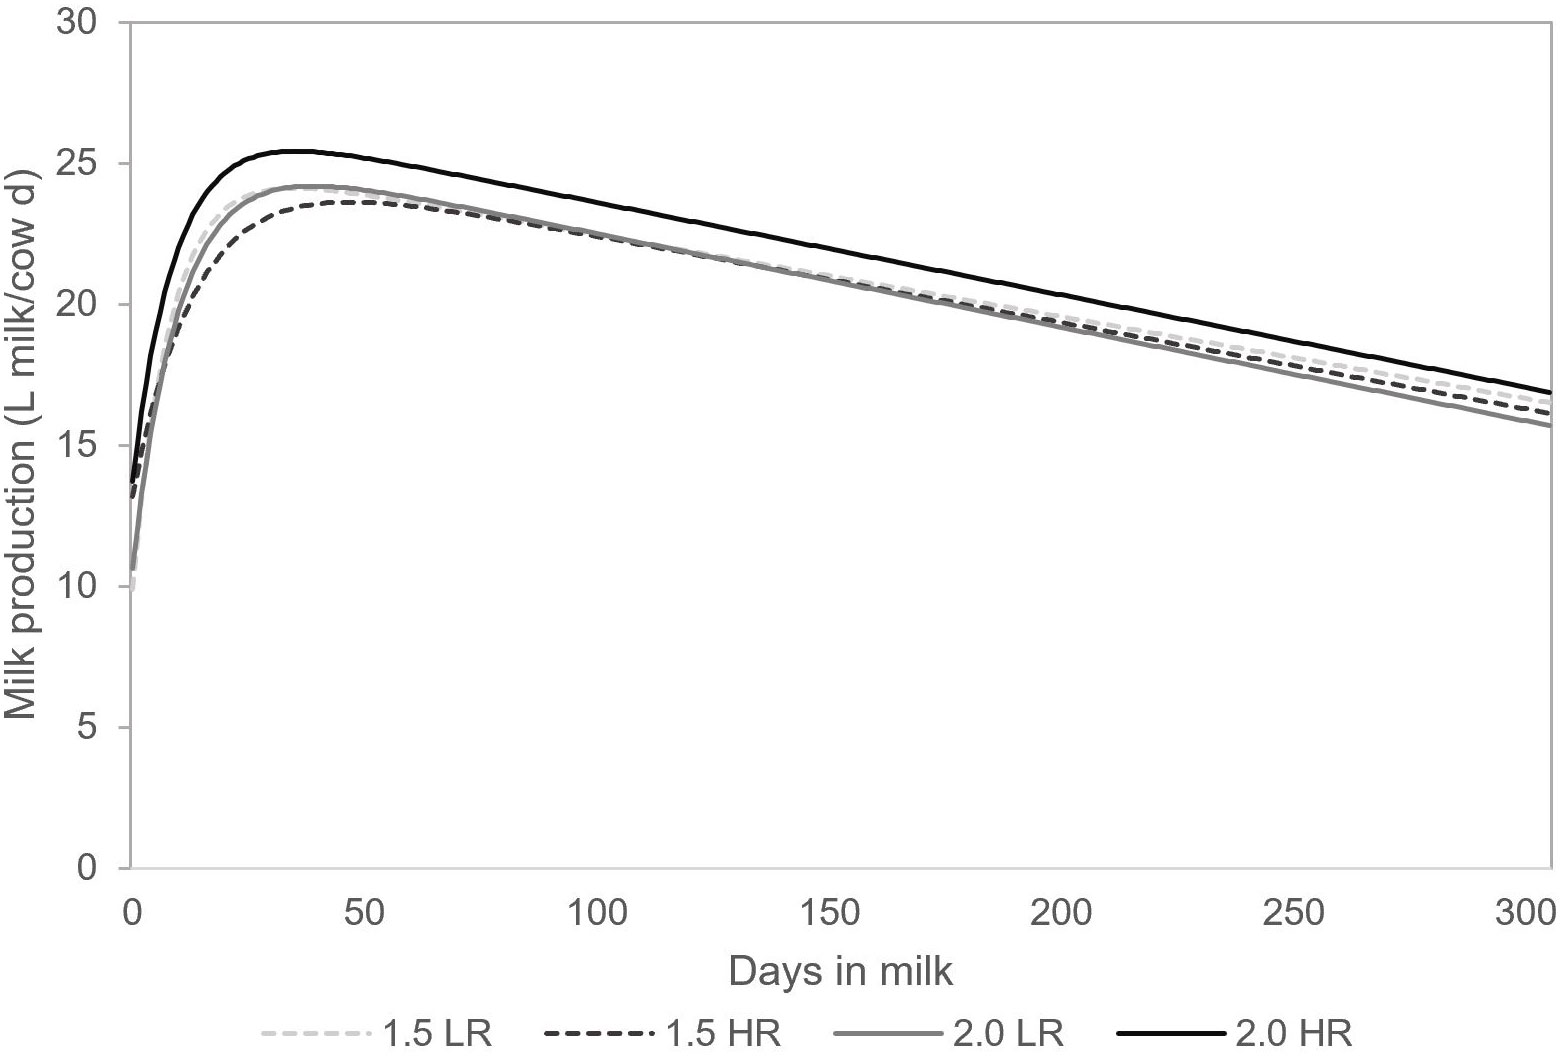
Figure 1 Mean lactation curves estimated with the exponential function of Wilmink (1987) (L milk/cow per day), high stocking rate low residual height (2.0 LR), high stocking rate high residual height (2.0 HR), middle stocking rate low residual height (1.5 LR), and middle stocking rate low residual height (1.5 HR).
The parameters of the estimated Wilmink curve fitting (Wilmink, 1987) are shown in Table 4. An effect of SR was detected on the initial phase of post-calving, inclining to peak (a) where the 2.0 cows group represented a positive difference of 1.50 L cow-1 d-1 cow d in contrast to 1.5 cows per hectare, and the subsequent post-peak decline phase (c).
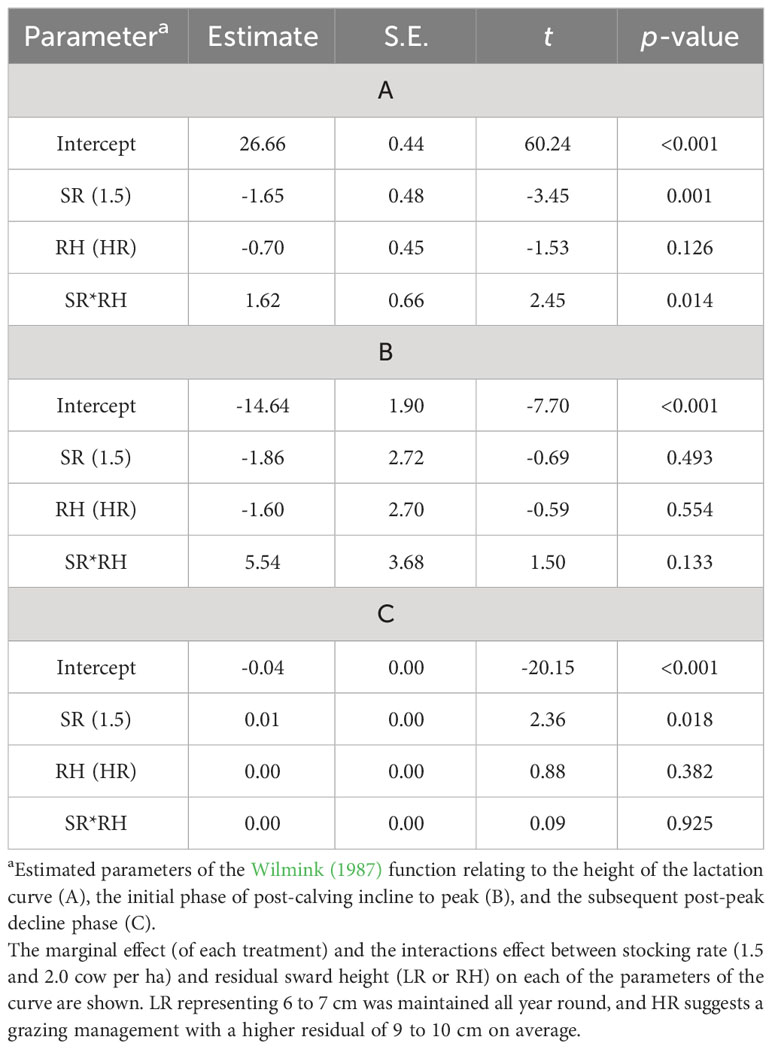
Table 4 Milk yield parameters estimated with the exponential function of Wilmink (1987).
Discussion
To the best of our knowledge, no previous research has been published on the combined effects of SR and RH on forage supplementation, forage, and milk production evaluated at the farm level for 3 years. Most references related to RH on perennial grasses have been at the paddock level and have focused on the animal–plant relationship (Mezallira et al., 2013; Chapman, 2016; Menegazzi et al., 2021). In contrast, the effect of SR on biophysical variables at the farmlet level has been reported internationally (Macdonald et al., 2008; Baudracco et al., 2011; Mc Carthy et al., 2011; Patton et al., 2016) and more recently at the national level (Stirling et al., 2021).
Pasture production
The findings of the current study are consistent with those of Baudracco et al. (2011) on M. sativa pasture and those of Stirling et al. (2021) on a similar 4-year rotation combining perennial and annual grasses. As highlighted by McMeekan and Walshe (1963), the quantity of forage directly harvested increases as SR increases, improving the grazing efficiency (Macdonald et al., 2008; Baudracco et al., 2011). In this research, lower levels of forage directly harvested were reported for 1.5 LR and 1.5 HR compared to the 2.0 LR and 2.0 HR treatments. Despite this, the levels of forage harvested by treatment reflected the possibility of different strategies to achieve high proportions of home-grown harvested forage (directly and mechanically) in the grazing area where the total amount of forage harvested in all treatments (Table 1) was significantly higher than those reported at the national level (Fariña and Chilibroste, 2019).
The Uruguayan dairy system can be defined as a pasture-based dairy system that has the flexibility to reduce or increase external inputs. Systems like 1.5 LR or 1.5 RH presented an interesting strategy to increase milk solids productivity (900 kg/ha−1 year−1) while supporting sustainable growth (Fariña and Chilibroste, 2019) based on the forage produced within its grazing area, without the need to import conserved forage from external areas (Chilibroste and Battegazzore, 2019).
The results of forage production in our study differed from those reported by Chapman (2016) who stated that a higher post-grazing height had a positive impact on forage production, affecting the length of the resting period. Other implications of working at low grazing depletion (14 cm post-grazing height) were reported by Gareli et al. (2023) on orchard grass in the spring for dairy cows, finding greater grazing frequency, shorter resting periods, and, thus, more grazing cycles than at a higher depletion rate. In our study conditions, the effect of RH resulted in a sward height difference of 1.6 cm. The proximity of the residuals between LR and HR established that the conditions were not such to achieve a difference in forage production. Moreover, the pre-grazing conditions considered the optimal leave stage benchmark (Fulkerson and Donaghy, 2001), and residuals were not restrictive to compromise regrowth in perennial grasses (Hodgson and White, 2000).
Grazing area FM average
In Uruguayan dairy grazing systems, the optimal average FM on grazing area to maximize the net forage accumulation on a multispecies rotation is still unknown. Beukes et al. (2018), working with Lolium-based pastures, reported pre-grazing values between 2,600 and 3,600 kg DM/ha and post-grazing between 1,500 and 1,700 kg DM/ha measured with a rising plate meter, representing an average FM in the grazing area of 2,350 kg DM ha. In the current study, the average FM on grazing area was lower (1,700 kg DM/ha) than the average FM stated by Beukes et al. (2018). This difference might be explained by the fact that, in our conditions, L. multiflorum (as annual species) occupied only 25% of the grazing area, while the remaining area was occupied by perennial grasses. Moreover, a different methodology, i.e., COMPYLD, was used to measure paddocks FM. The impact of aiming for a higher FM on the grazing area based on RH did not translate into increased forage productivity, as reported by Chapman (2016). The selected target FM in this study could have been a key aspect in duplicating the amount of forage harvested directly (7.65 ton of forage per hectare) with respect to commercial dairy systems, although it is still far lower compared to the most intensive dairy grazing system competitors (Fariña and Chilibroste, 2019).
This study has also shown that the pre- and post-grazing FM did not differ between treatments despite the differences on pre-grazing sward height (i.e., 2.0 LR higher than the rest). These findings further supported the observations by Menegazzi et al. (2021), who found that different residual sward heights resulted in different post-grazing heights, but no differences in the FM. This might have been influenced by the different vertical structures of the canopy that changed the density of the residual strata by the effect of grazing at different heights. In contrast, Gareli et al. (2023) observed differences in the pre- and post-grazing FM with different levels of RH (14 cm vs. 9 cm on orchard grass in spring), where a target of 40% of sward depletion was considered, while in our conditions sward depletion represented 63% and 58% for LR and HR, respectively. This sward depletion value was higher than the one reported by Mezzalira et al. (2014) to keep a high pasture DM intake rate. However, this does not limit our research, considering that dairy cows can graze at high levels (52%) when they are receiving high levels of supplement with concentrates (Dale et al., 2018).
Controlling RH is one of the most challenging issues in higher SR systems, where a greater amount of inputs is required (Macdonald et al., 2008) to achieve high forage harvest per hectare while maintaining moderate levels of forage intake per cow (Beukes et al., 2018). The effect of SR was not significant for FDMI, which aligned with the findings of Patton et al. (2016); however, our experiment reported an interaction between SR and RH for that variable. In this context, a reduction in FDMI for 2.0 HR with respect to 1.5 HR could be related to the higher amounts of conserved forage offered per cow and the more restricted access to grazing. For our conditions, there were differences in total DMI, where 1.5 LR was lower than 2.0 HR, but not different from that of 1.5 HR and 2.0 LR. This opens up an interesting scenario with the possibility of continuing to increase competitiveness and at the same time maintaining a high proportion of forage in diets. However, there was a higher FDMI for the 1.5 HR treatment, which was not observed for the 2.0 HR treatment as could be expected. However, the FDMI results from the whole feeding strategies that combined different factors in time—for example, the higher amount of conserved forage offered to the 2.0 SR in contrast to 1.5 SR cows. In general, a 50% increase in the daily herbage allowance from 20 to 30 kg DM/cow was associated with an increase in FDMI of 1.3 kg/day and a 23% decrease in the utilization efficiency of available forage (Wilkinson et al., 2020). In this study, the difference in FA between 2.0 LR and 2.0 HR was only 11%, with no repercussions on FDMI. Instead, a difference of 16% in FA positively impacted a higher FDMI for 1.5HR, in contrast to that of 1.5 LR.
In grazing systems, increases in SR lead to a decline in forage allowance per cow. As a result, cows consume less forage (Macdonald et al., 2008; Baudracco et al., 2011), requiring increased provision of conserved forage to maintain optimal animal performance. This condition implied a higher amount of supplement per cow and per hectare for 2.0 LR and 2.0 HR as these treatments needed to address animal demand in contrast to 1.5 LR and 1.5 HR. This aligns with the observations of Patton et al. (2016), who demonstrated the use of supplementary feeds to preserve individual animal performance, where SR and supplementation usually increase simultaneously (Valentine et al., 2009; Fariña and Chilibroste, 2019). For our conditions, the amount of conserved forage usage for 2.0 HR was the highest, which explained for the greater time that cows were kept on the resting paddock with no access to grazing.
In this experiment, higher levels of conserved forage supplementation were associated with cows spending longer periods in resting areas, consequently reducing their time on pasture and limiting grazing opportunities. The cows in the 2.0 SR group spent less time engaged in two grazing turns compared to those in the 1.5 SR group and had more days with only one grazing turn. The increase in SR imposed greater pressure on pasture and posed a challenge in aligning animal demand with the grazing area GR to harvest the maximum amount of forage directly by cows (Roche et al., 2017). Consequently, the intensification of these pasture-based dairy systems is not feasible without considering appropriate infrastructure to provide favorable conditions for feeding supplements, address animal welfare concerns, and ensure suitable working conditions for humans. In dairy grazing systems, supplementation is a well-known alternative to increase the amount of energy consumed by cows, which often enhances individual milk yield (Patton et al., 2016). Sufficient high-quality supplements, when provided, can mitigate the negative effects of a higher SR, with outcomes such as an increase in milk yield per cow (Fariña et al., 2011) or no significant change (Baudracco et al., 2011). The findings observed in our study mirror previous studies carried out by Macdonald et al. (2008); Baudracco et al. (2011); Fariña et al. (2011), and Patton et al. (2016), which highlighted the positive effect of SR attributed to higher pasture usage and increased concentrate intake per hectare. This presents an opportunity for the intensification of dairy grazing systems to enhance farm productivity, either through SR or individual milk production (Fariña et al., 2011). The results of the current study support previous research indicating the non-existent effect of SR on individual milk production (Baudracco et al., 2011; Patton et al., 2016). However, in other studies, individual milk production was reported to be negatively (Macdonald et al., 2008) or positively affected by SR (Fariña et al., 2011; Mc Carthy et al., 2011). For the lactation curve parameters, the values differed from those reported by Baudracco et al. (2011). They found no effect of SR at the initial phase of post-calving, inclining to peak in two similar situations of 1.6 and 2.1 cows per hectare. The variation in our results could be attributed to the lower proportion of grazing in the 2.0 SR group, potentially contributing to a diet with more concentrate and less energy expenditure at the early stages of lactation. While supplementation of grazing dairy cows may be expected to increase the milk yield especially in early lactation (Bargo et al., 2003), this effect could be reflected in the lactation curves of cows during that stage. Regarding the effect of RH, this study did demonstrate an increase in individual FDMI with no significant effect on individual milk production per day, but with a positive impact on milk production per hectare with a reduction on the defoliation intensity. These results aligned with those found by Delaby and Peyraud (2003); Ganche et al. (2014), and Menegazzi et al. (2021), although these studies were not carried out at the system level.
At lower grazing intensities, cows would enhance their milk yield (Dale et al., 2018) because the lower level of depletion, in contrast to LR, would allow them to graze on mainly the upper stratum of the sward. This upper stratum typically contains a predominance of leaves and higher nutritive value (Benvenutti et al., 2016), contributing positively to the subsequent post-peak decline phase of the Wilmink (1987) model. Although these conditions might have implications for the BCS and BW of cows, in our circumstances, these variables were not affected by SR, as reported by Baudracco et al. (2011) and Patton et al. (2016), who analyzed systems with different levels of SR with supplementation throughout the lactation period. Dale et al. (2018) likewise found no variation between the low and high defoliation intensities for BCS; however, they observed a trend in BW at the end of the period for cows that grazed at a lower defoliation.
Conclusion
This study showed that a higher SR and a higher RH had no significant effect on forage production and utilization from home-grown forage. Nevertheless, distinct strategies emerged as a combination of direct and mechanical harvest between SR levels. With an increase in SR from 1.5 to 2.0 cows per hectare, direct forage consumption by cows rose and a higher supplementation (conserved forage and concentrate) was required to maintain milk and milk solids productivity. The strategic use of additional supplements particularly in the face of restricted pasture allowance at a higher SR not only sustained the milk production per cow but also significantly increased milk production per hectare. Cows with a stocking rate of 2.0 per hectare spent less time grazing to align animal demand with GR for maximizing direct harvest. Investing in appropriate infrastructure is certainly crucial to ensuring the wellbeing of animals, optimizing labor conditions, and addressing environmental concerns. This is especially vital in light of escalating input costs and unpredictable output prices. Adopting systems that aim to harvest higher amounts of forage per hectare can contribute to the competitiveness of the Uruguayan and other dairy industries that rely on grazing systems. This underscores the importance of strategic planning, efficient resource management, and a sustainable approach to ensure the long-term viability of dairy farming in these regions.
Data availability statement
The datasets presented in this study can be found in online repositories. The names of the repository/repositories and accession number(s) can be found below: https://data.mendeley.com/datasets/hfjkkhdg94/1.
Ethics statement
The animal studies were approved by Comisión Honoraria de Experimentación Animal (CHEA). The studies were conducted in accordance with the local legislation and institutional requirements. Written informed consent was obtained from the owners for the participation of their animals in this study.
Author contributions
GO: Conceptualization, Data curation, Formal analysis, Investigation, Software, Visualization, Writing – original draft, Writing – review & editing. NB: Formal analysis, Methodology, Software, Writing – review & editing. PC: Funding acquisition, Project administration, Resources, Supervision, Validation, Writing – review & editing.
Funding
The author(s) declare financial support was received for the research, authorship, and/or publication of this article. This project was funded by the Agencia Nacional de Investigación e Innovación (ANII) and Red Tecnológica Sectorial de Lechería (RTS) (project number ANII-RTS_X_2014_1_3) who also funded post-graduate scholarship awarded to G. Ortega (POS_NAC_2018_1_151491).
Acknowledgments
We would like to thank all the staff of Centro Regional Sur who have supported this research from the beginning.
Conflict of interest
The authors declare that the research was conducted in the absence of any commercial or financial relationships that could be construed as a potential conflict of interest.
Publisher’s note
All claims expressed in this article are solely those of the authors and do not necessarily represent those of their affiliated organizations, or those of the publisher, the editors and the reviewers. Any product that may be evaluated in this article, or claim that may be made by its manufacturer, is not guaranteed or endorsed by the publisher.
References
Allen V. G., Batello C., Berretta E. J., Hodgson J., Kothmann M., Li X., et al. (2011). An international terminology forgrazing lands and grazing animals. Grass Forage Sci. 66, 2–28. doi: 10.1111/j.1365-2494.2010.00780.x2
Bargo F., Muller L. D., Kolver E. S., Delahoy J. E. (2003). Invited review: Production and digestion of supplemented dairy cows on pasture. J. Dairy Sci. 86, 1–42. doi: 10.3168/jds.S0022-0302(03)73581-4
Baudracco J., Lopez-Villalobos N., Romero L. A., Scandolo D., Maciel M., Comeron E. A., et al. (2011). Effects of stocking rate on pasture production, milk production and reproduction of supplemented crossbred Holstein-Jersey dairy cows grazing lucerne pasture. Anim. Feed Sci. Technol. 168, 131–143. doi: 10.1016/j.anifeedsci.2011.03.017
Benvenutti M. A., Pavetti D. R., Poppi D. P., Gordon I. J., Cangiano C. A. (2016). Defoliation patterns and their implications for the management of vegetative tropical pastures to control intake and diet quality by cattle. Grass Forage Sci. 71, 424–436. doi: 10.1111/gfs.12186
Beukes P. C., McCarthy S., Wims C. M., Gregorini P., Romera A. J. (2018). Regular estimates of herbage mass can improve profitability of pasture-based dairy systems. Anim. Prod. Sci. 52, 1–9. doi: 10.1071/AN17166
Chapman D. (2016). Using ecophysiology to improve farm efficiency: application in temperate dairy grazing systems. Agriculture 6, 17. doi: 10.2135/cropsci2006.01.0036
Chataway R. G., Walker R. G., Callow M. N. (2010). Development of profitable milk production systems for northern Australia: a field assessment of the productivity of five potential farming systems using farmlets. Anim. Prod. Sci. 50, 246–264. doi: 10.1071/AN09124
Chilibroste P., Battegazzore G. (2019). Proyecto Producción Competitiva. 1st ed (Montevideo, Uruguay: Conaprole).
Chilibroste P., Ibarra. D., Zibil. S., Laborde D. (2003). Proyecto Alimentación- Reproducción Conaprole 2002: Informe final. (Montevideo, Uruguay: Conaprole) 28 p.
Dale A. J., Laidlaw A. S., Gordon A., Ferris C. P. (2018). The effect of grazing intensity on the performance of high-yielding dairy cows. Grass Forage Sci. 73, 798–810. doi: 10.1111/gfs.12350
Delaby L., Peyraud J. L. (2003). The effect of two contrasting grazing managements and level of concentrate supplementation on the performance of grazing dairy cows. Anim. Res. 52, 437–460. doi: 10.1051/animres:2003030
Dillon P., Roche J. R., Shalloo L., Horan B. (2005). “Optimising financial return from grazing in temperate pastures,” in Utilization of grazed grass in temperate animal systems. Ed. Murphy J. (Cork, Ireland: International Grassland Congress).
Donaghy D. J., Fulkerson W. J. (1998). Priority for allocation of water-soluble carbohydrate reserves in Lolium perenne. Grass For. Sci. 53, 211–218. doi: 10.1071/EA00062
Fariña S., Chilibroste P. (2019). Opportunities and challenges for the growth of milk production from pasture: the case of farm systems in Uruguay. Agric. Syst. 176, 102631. doi: 10.1016/j.agsy.2019.05.001
Fariña S. R., Garcia S. C., Fulkerson W. J., Barchia I. M. (2011). Pasture-based dairy farm systems increasing milk production through stocking rate or milk yield per cow: pasture and animal response. Grass Forage Sci. 66, 316–332. doi: 10.1111/j.1365-2494.2011.00795.x
Ferguson J. D., Galligan D. T., Thornsen N. (1994). Principal descriptors of body condition score in Holstein cows. J. Dairy Sci. 77, 2695–2703. doi: 10.3168/jds.s0022-0302(94)77212-x
Fulkerson W. J., Donaghy D. J. (2001). . Plant-soluble carbohydrate reserves and senescence-key criteria for developing an effective grazing management system for ryegrass-based pastures: a review. Aust. J. Exp. Agric. 41, 261–275. doi: 10.1071/EA00062
Ganche E., Delaby L., O’Donovan M., Boland T. M., Galvin N., Kennedy E. (2013). Post-grazing sward height imposed during the first 10 weeks of lactation: Influence on early and total lactation dairy cow production, and spring and annual sward characteristics. Livest. Sci. 157, 299–311. doi: 10.1016/j.livsci.2013.08.001
Ganche E., O’Donovan M., Pey L., Boland T. M., Kennedy E. (2014). Does post-grazing sward height influence sward characteristics, seasonal herbage dry-matter production and herbage quality? Grass For. Sci. 70, 130–1143. doi: 10.1111/gfs.12113
Gareli M. S., Mendoza A., Bello N. M., Lattanzi F. A., Fariña S. R., Savian J. V. (2023). Effects of grazing management and concentrate supplementation on intake and milk production of dairy cows grazing orchardgrass. Anim. Feed Sci. 301, 115 668. doi: 10.1016/j.anifeedsci.2023.115668
Hodgson J. H., White J. (2000). New Zealand pasture and crop science (Oxford, UK: Oxford University Press).
Macdonald K. A., Penno J. W., Lancaster J. A. S., Bryant A. M., Kidd J. M., Roche J. R. (2017). Production and economic responses to intensification of pasture-based dairy production systems. J. Dairy Sci. 100, 1–18. doi: 10.3168/jds.2016-12497
Macdonald K. A., Penno J. W., Lancaster J. A. S., Roche J. R. (2008). Effect of stocking rate on pasture production, milk production, and reproduction of dairy cows in pasture-based systems. J. Dairy Sci. 91, 2151–2163. doi: 10.3168/jds.2007-0630
Mc Carthy B., Delaby L., Pierce K. M., Journot F., Horan B. (2011). Meta-analysis of the impact of stocking rate on the productivity of pasture-based milk production systems. Anim. Consortium 5, 784–794. doi: 10.1017/S1751731110002314
McCarthy S., Hirst C., Donaghy D., Gray D., Wood B. (2014). Opportunities to improve grazing management. Proc. N. Z. Grassland Assoc. 76, 75–80. doi: 10.33584/jnzg.2014.76.2971
McMeekan C. P., Walshe M. J. (1963). Interrelationships of grazing methods and stocking rate in efficiency of pasture utilization by dairy cattle. J. Agric. Sci. 61, 147–166. doi: 10.1017/S0021859600005888
Menegazzi G., Giles P. Y., Oborsky M., Fast O., Mattiauda D. A., Genro T. C. M., et al. (2021). Effect of post-grazing sward height on ingestive behavior, dry matter intake, and milk production of Holstein dairy cows. Front. Anim. Sci. 2. doi: 10.3389/fanim.2021.742685
Merino V. M., Balocchi O. A., Rivero M. J., Pulido R. G. (2019). Short-term effect of daily herbage allowance restriction on pasture condition and the performance of grazing dairy cows during autumn. Animals 10, 62. doi: 10.3390/ani10010062
Mezzalira J. C., De Faccio Carvalho P. C., Fonseca L., Bremm C., Cangiano C., Gonda H. L. (2014). Behavioural mechanisms of intake rate by heifers grazing swards of contrasting structures. Appl. Anim. Behav. Sci. 153, 1–9. doi: 10.1016/j.applanim.2013.12.014
Mezzalira J., Bremm C., Trindade J. K. D., Gonda H. L., Vieira P. C., Carvalho P. C. D. F. (2013). Ingestive behaviour from the feeding station topatch level in heterogeneous environments. J. Anim. Sci. Adv. 3, 613–623.
Patton D., Pierce K. M., Horan B. (2016). Effect of stocking rate on milk and pasture productivity and supplementary feed use for spring calving pasture fed dairy systems. J. Dairy Sci. 99, 1–12. doi: 10.3168/jds.2015-10305
Ramsbottom G., Horan B., Berry B., Roche J. R. (2015). Factors associated with the financial performance of spring-calving, pasture-based dairy farms. J. Dairy Sci. 98, 3526–3540. doi: 10.3168/jds.2014-8516
Roche J. R., Berry D. P., Bryant A. M., Burke C. R., Butler S. T., Dillon P. G., et al. (2017). A 100-Year Review: A century of change in temperate grazing dairy systems. J. Dairy Sci. 100, 10189–10233. doi: 10.3168/jds.2017-13182
Stirling S., Fariña S., Pacheco D., Vibart R. (2021). Whole-farm modelling of grazing dairy systems in Uruguay. Agric. Syst. 193, 103227. doi: 10.1016/j.agsy.2021.103227
Strucken E. M. (2021). Lactcurves: Lactation Curve Parameter Estimation. R package version 1.1.0. Proc. Assoc. Advmt. Anim. Breed. Genet. 23, 139–142.
Valentine S., Lewis P., Cowan R. T., DeFaveri J. (2009). The effects of high stocking rates on milk production from dryland and irrigated Mediterranean pastures. Anim. Prod. Sci. 49, 100–111. doi: 10.1071/EA07071
Wilkinson J. M., Lee M. R. F., Rivero M. J., Chamberlain A. T. (2020). Some challenges and opportunities for grazing dairy cows on temperate pastures. Grass Forage Sci. 75, 1–17. doi: 10.1111/gfs.12458
[ad_2]