Vaccines | Free Full-Text | The Stability and Efficency of CPB Cells Were Acclimated for Virus Proliferation
Figure 1.
The cells state of CPB p100–p300 cells. (a) The cells growth state of CPB p100–p300 cells. (b) The interval time through a generation of p100–p104, p105–p300 and p131–p150 cells needed 4–5 d, 6–12 d, 4–6 d, 3–4 d, respectively.
Figure 1.
The cells state of CPB p100–p300 cells. (a) The cells growth state of CPB p100–p300 cells. (b) The interval time through a generation of p100–p104, p105–p300 and p131–p150 cells needed 4–5 d, 6–12 d, 4–6 d, 3–4 d, respectively.
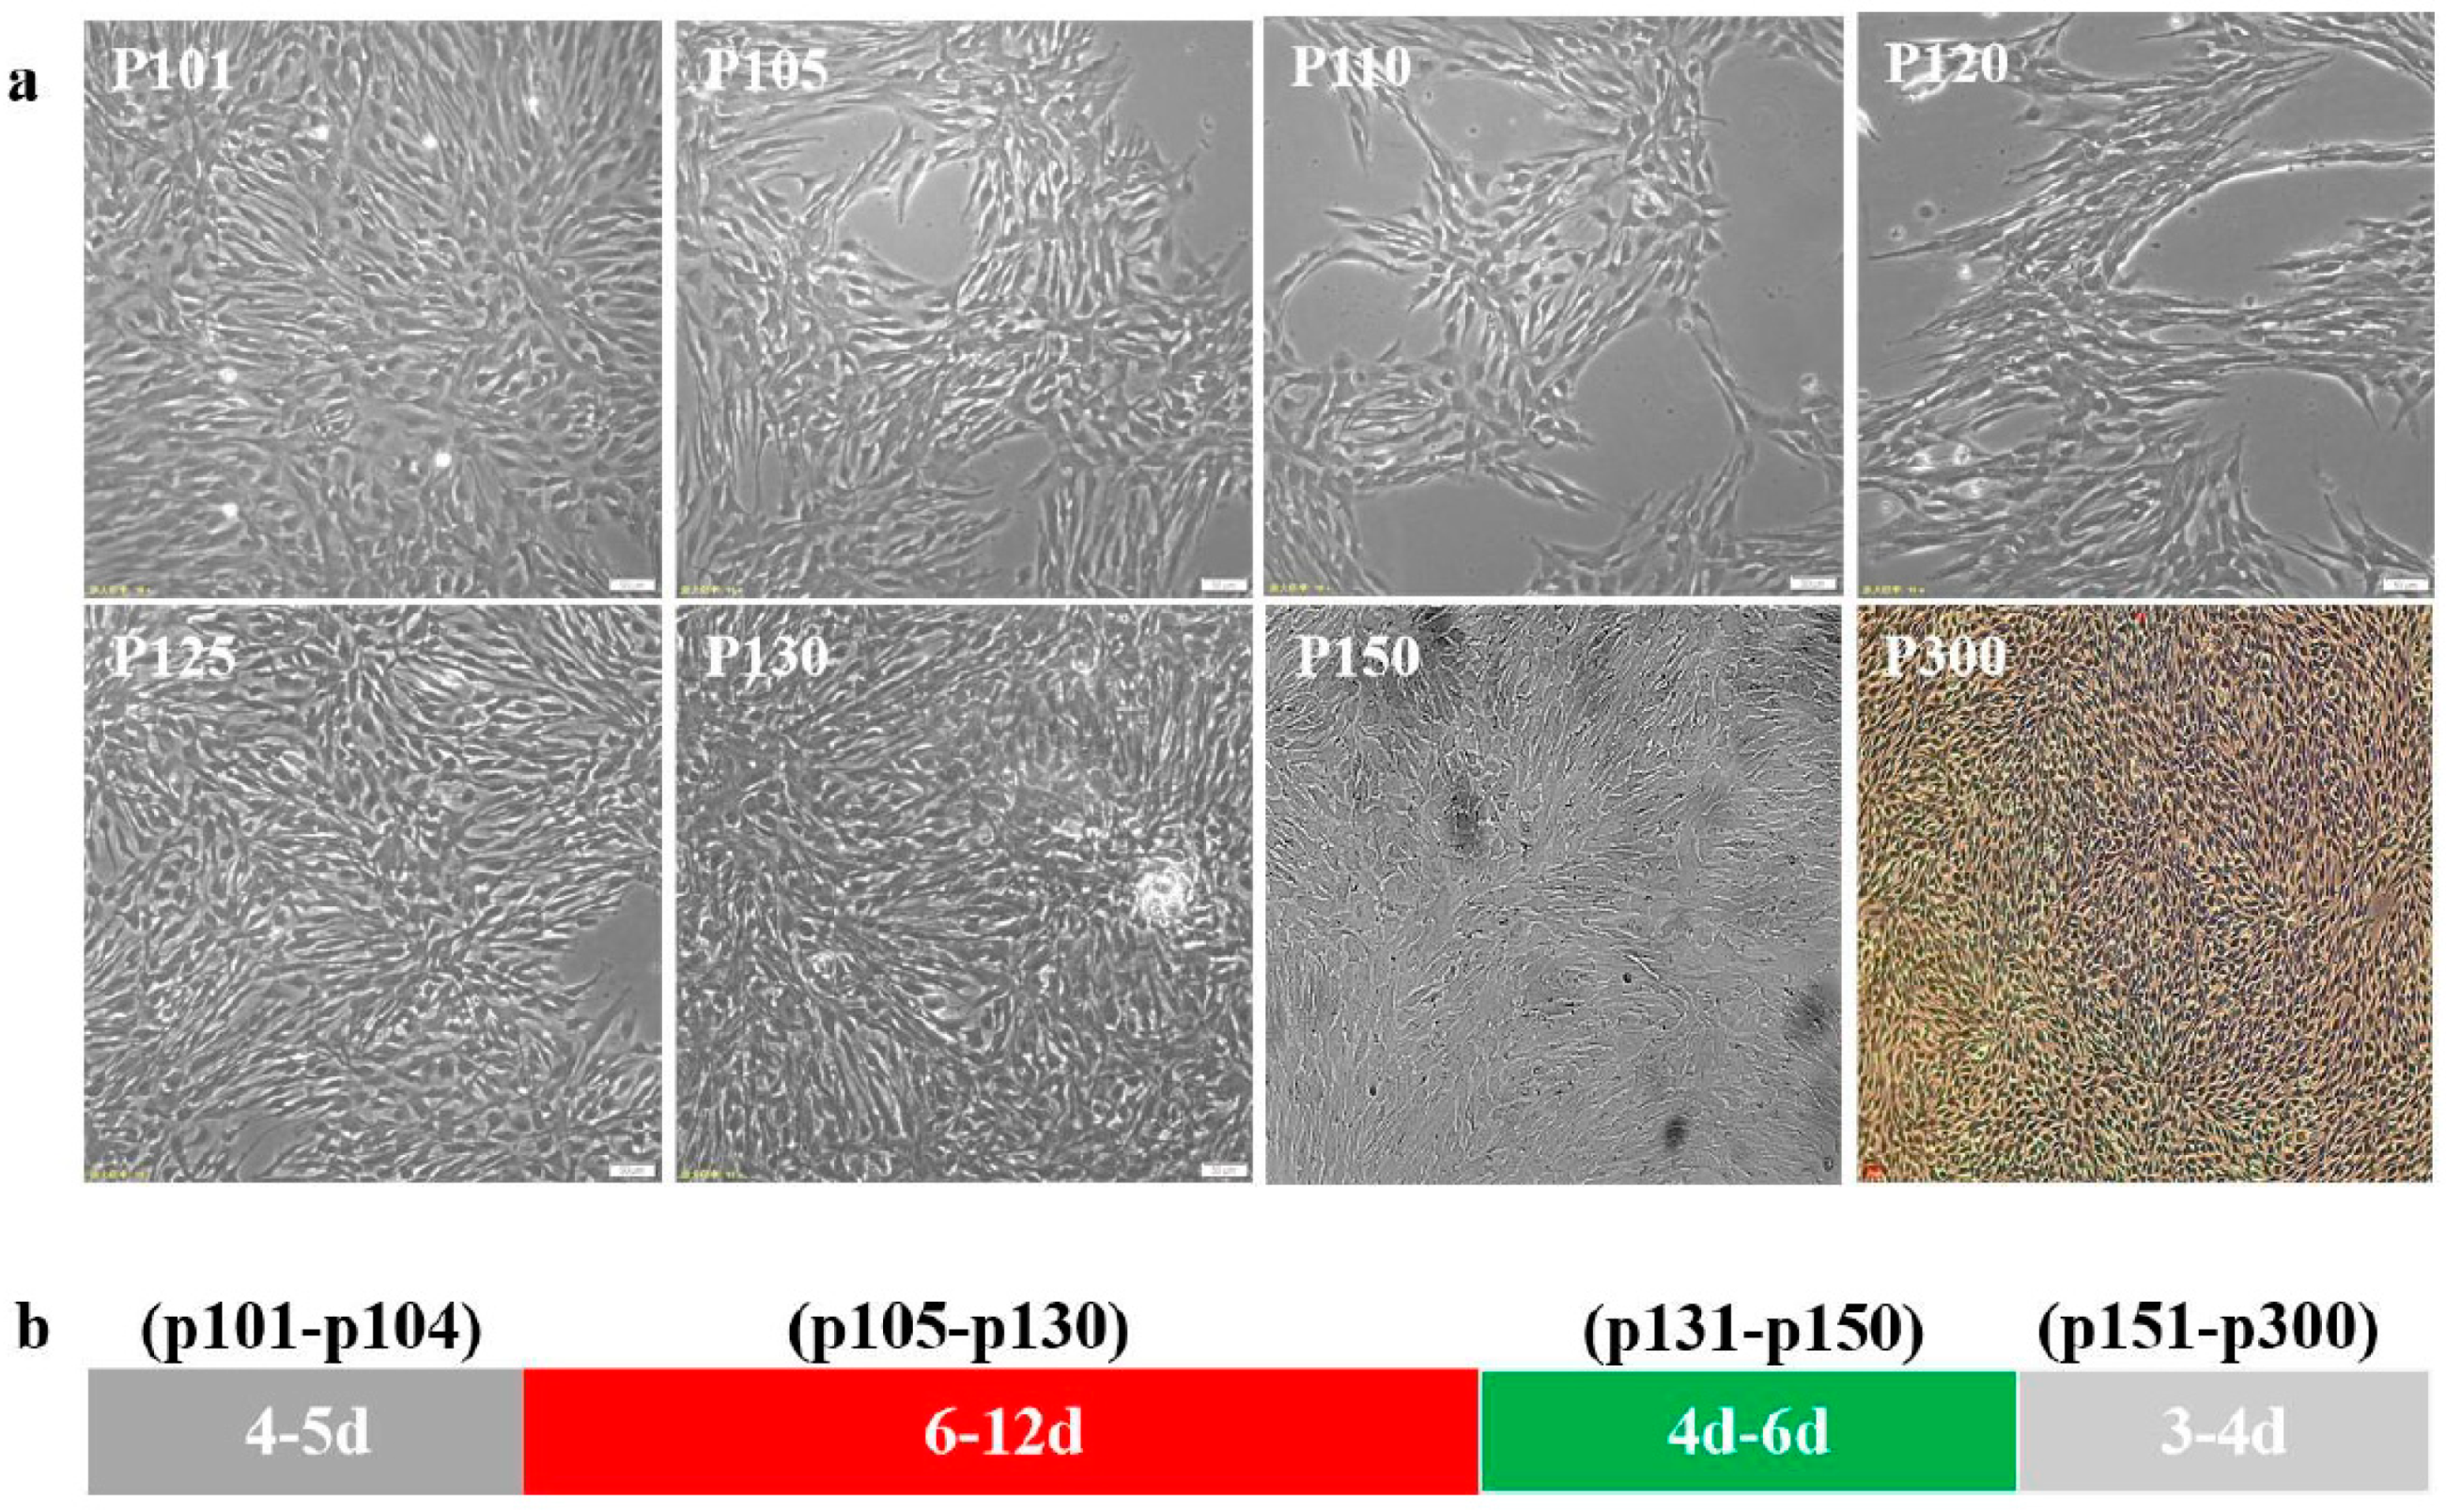
Figure 2.
The cell morphological features of CPB p100, p150 and p300 cells. (a) The cell diameter of CPB p100, p150, and p300 cells. (b) The indirect immunofluorescence assay with cytoketatin 19 antibody of CPB p100, p150, and p300 cells showed that CPB p100, p150, and p300 cells appeared green fluoresce.
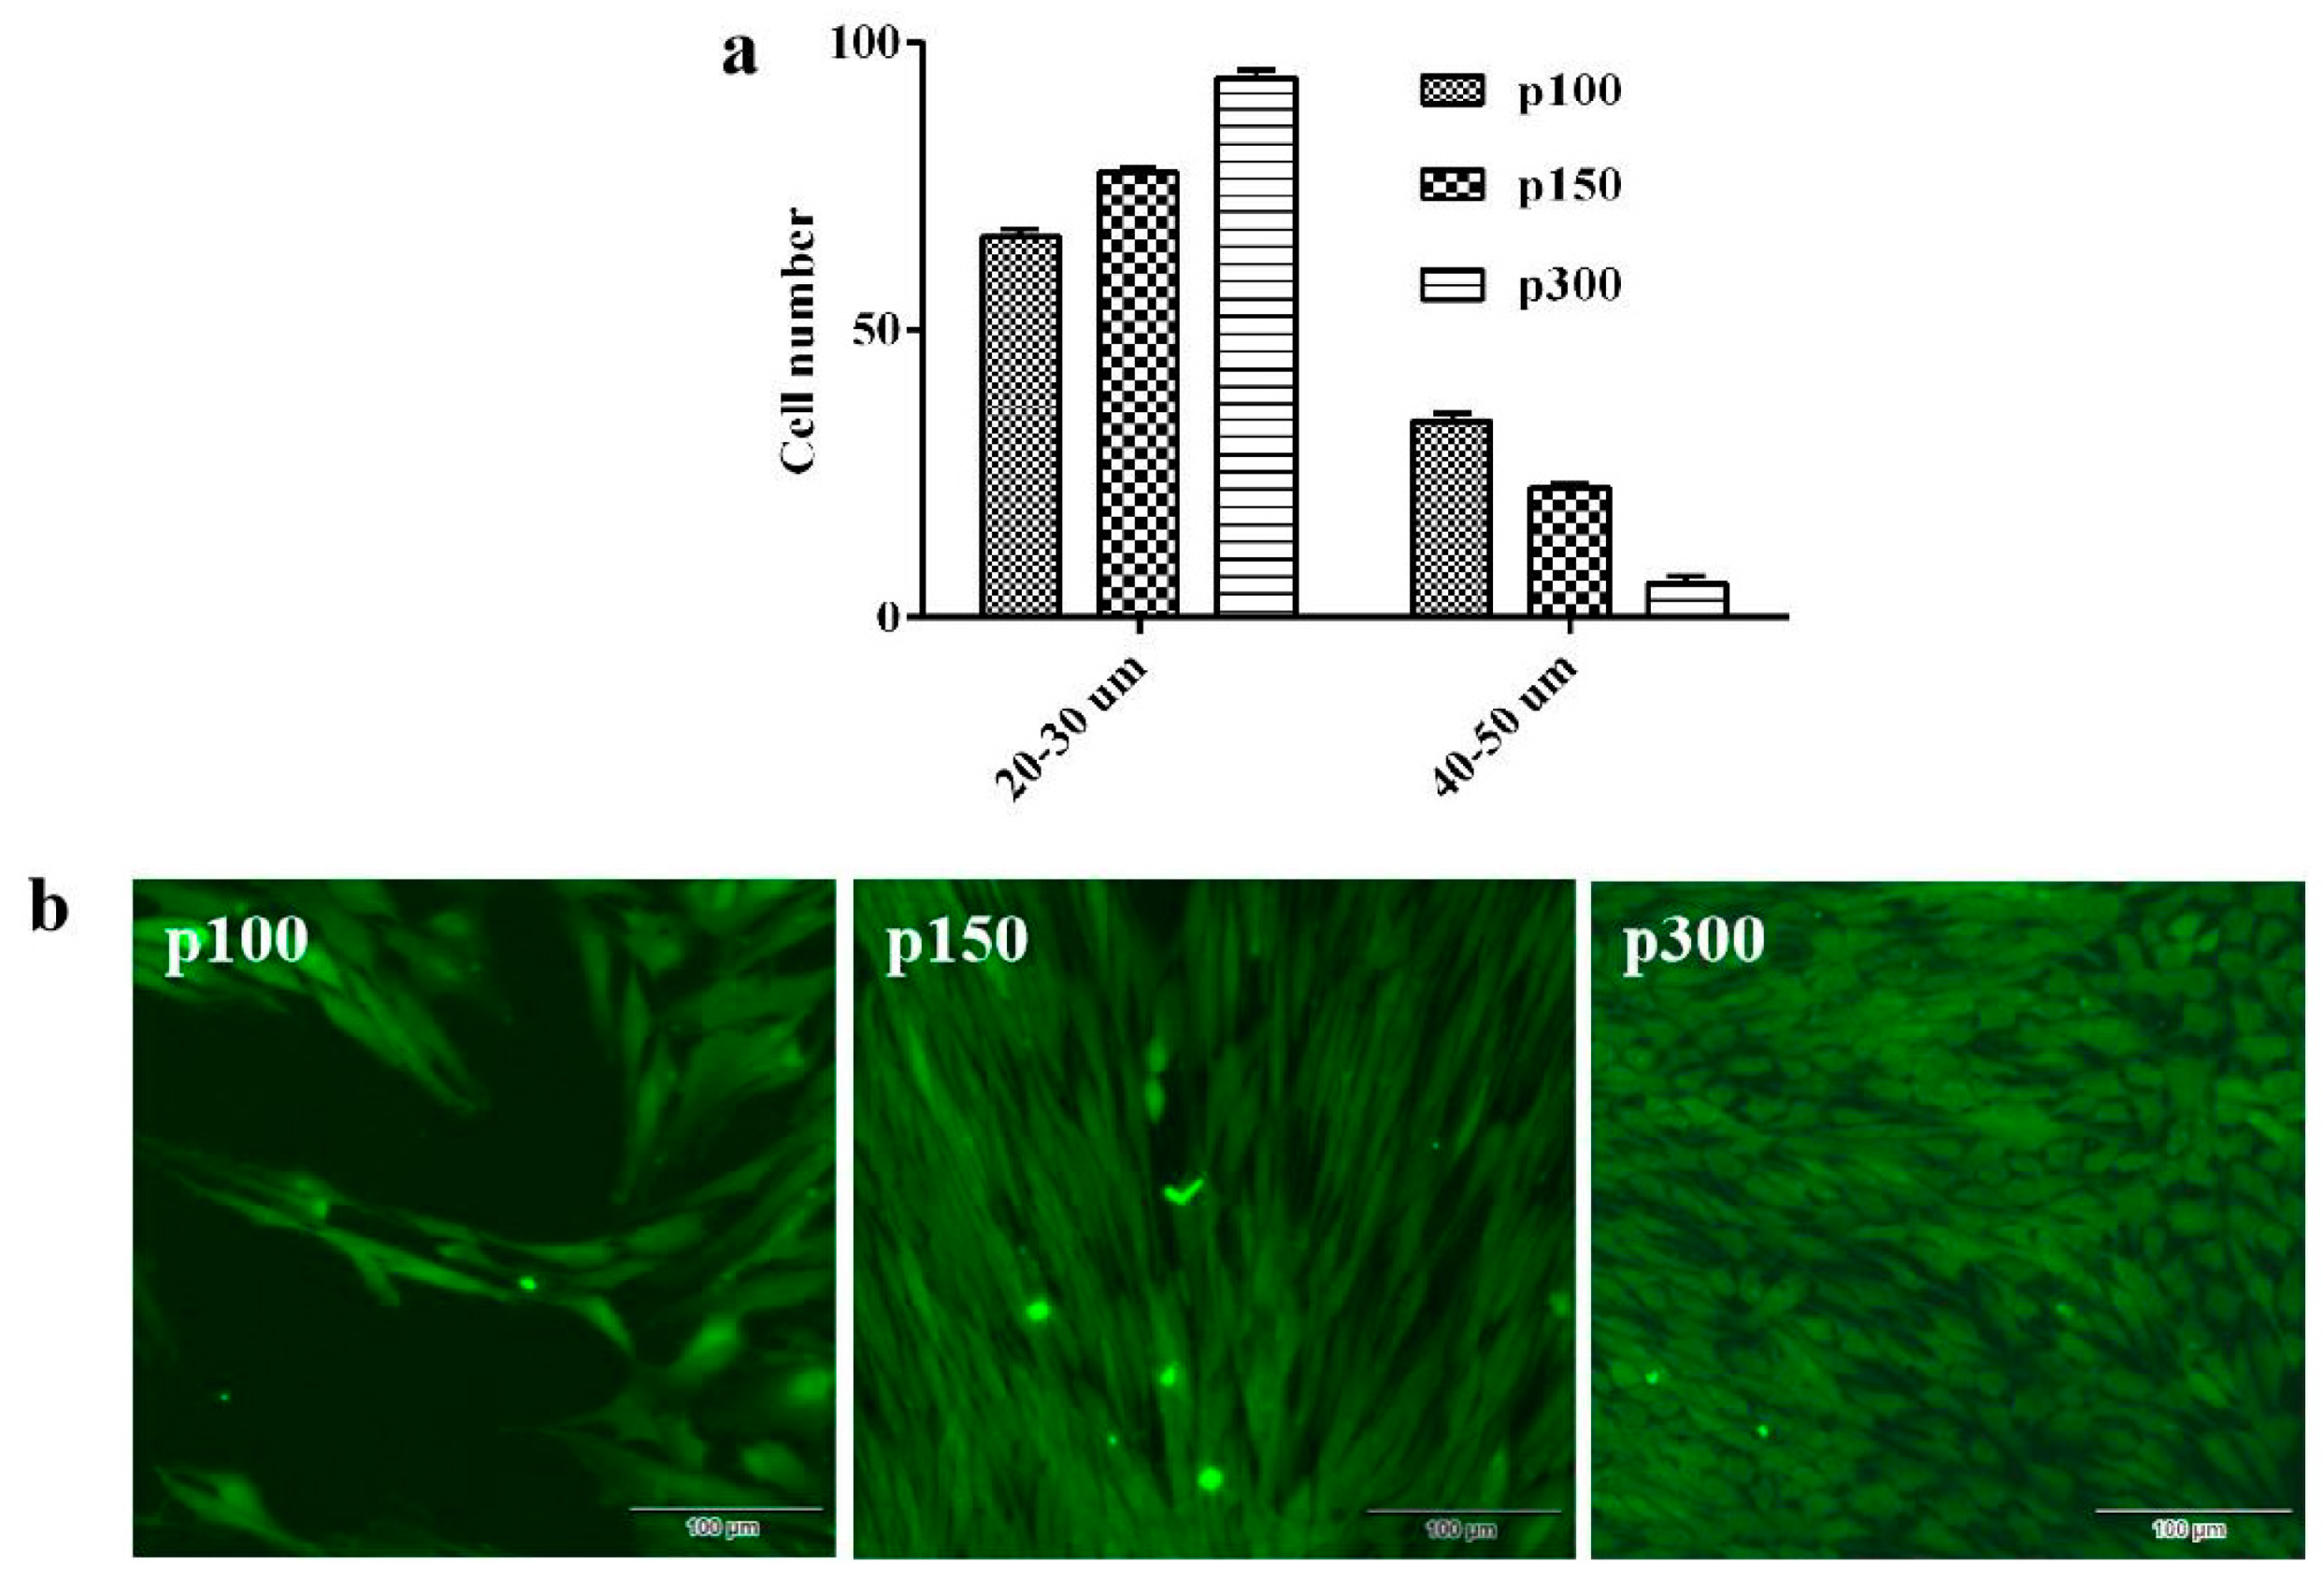
Figure 3.
The growth characteristics of CPB p100, p150, and p300 cells. (a) The digestion time of CPB p100, p150, and p300 cells required 4–5 min, 3–4 min, and 2–3 min, respectively. (b) The growth curve of CPB p100, p150, and p300 cells.
Figure 3.
The growth characteristics of CPB p100, p150, and p300 cells. (a) The digestion time of CPB p100, p150, and p300 cells required 4–5 min, 3–4 min, and 2–3 min, respectively. (b) The growth curve of CPB p100, p150, and p300 cells.
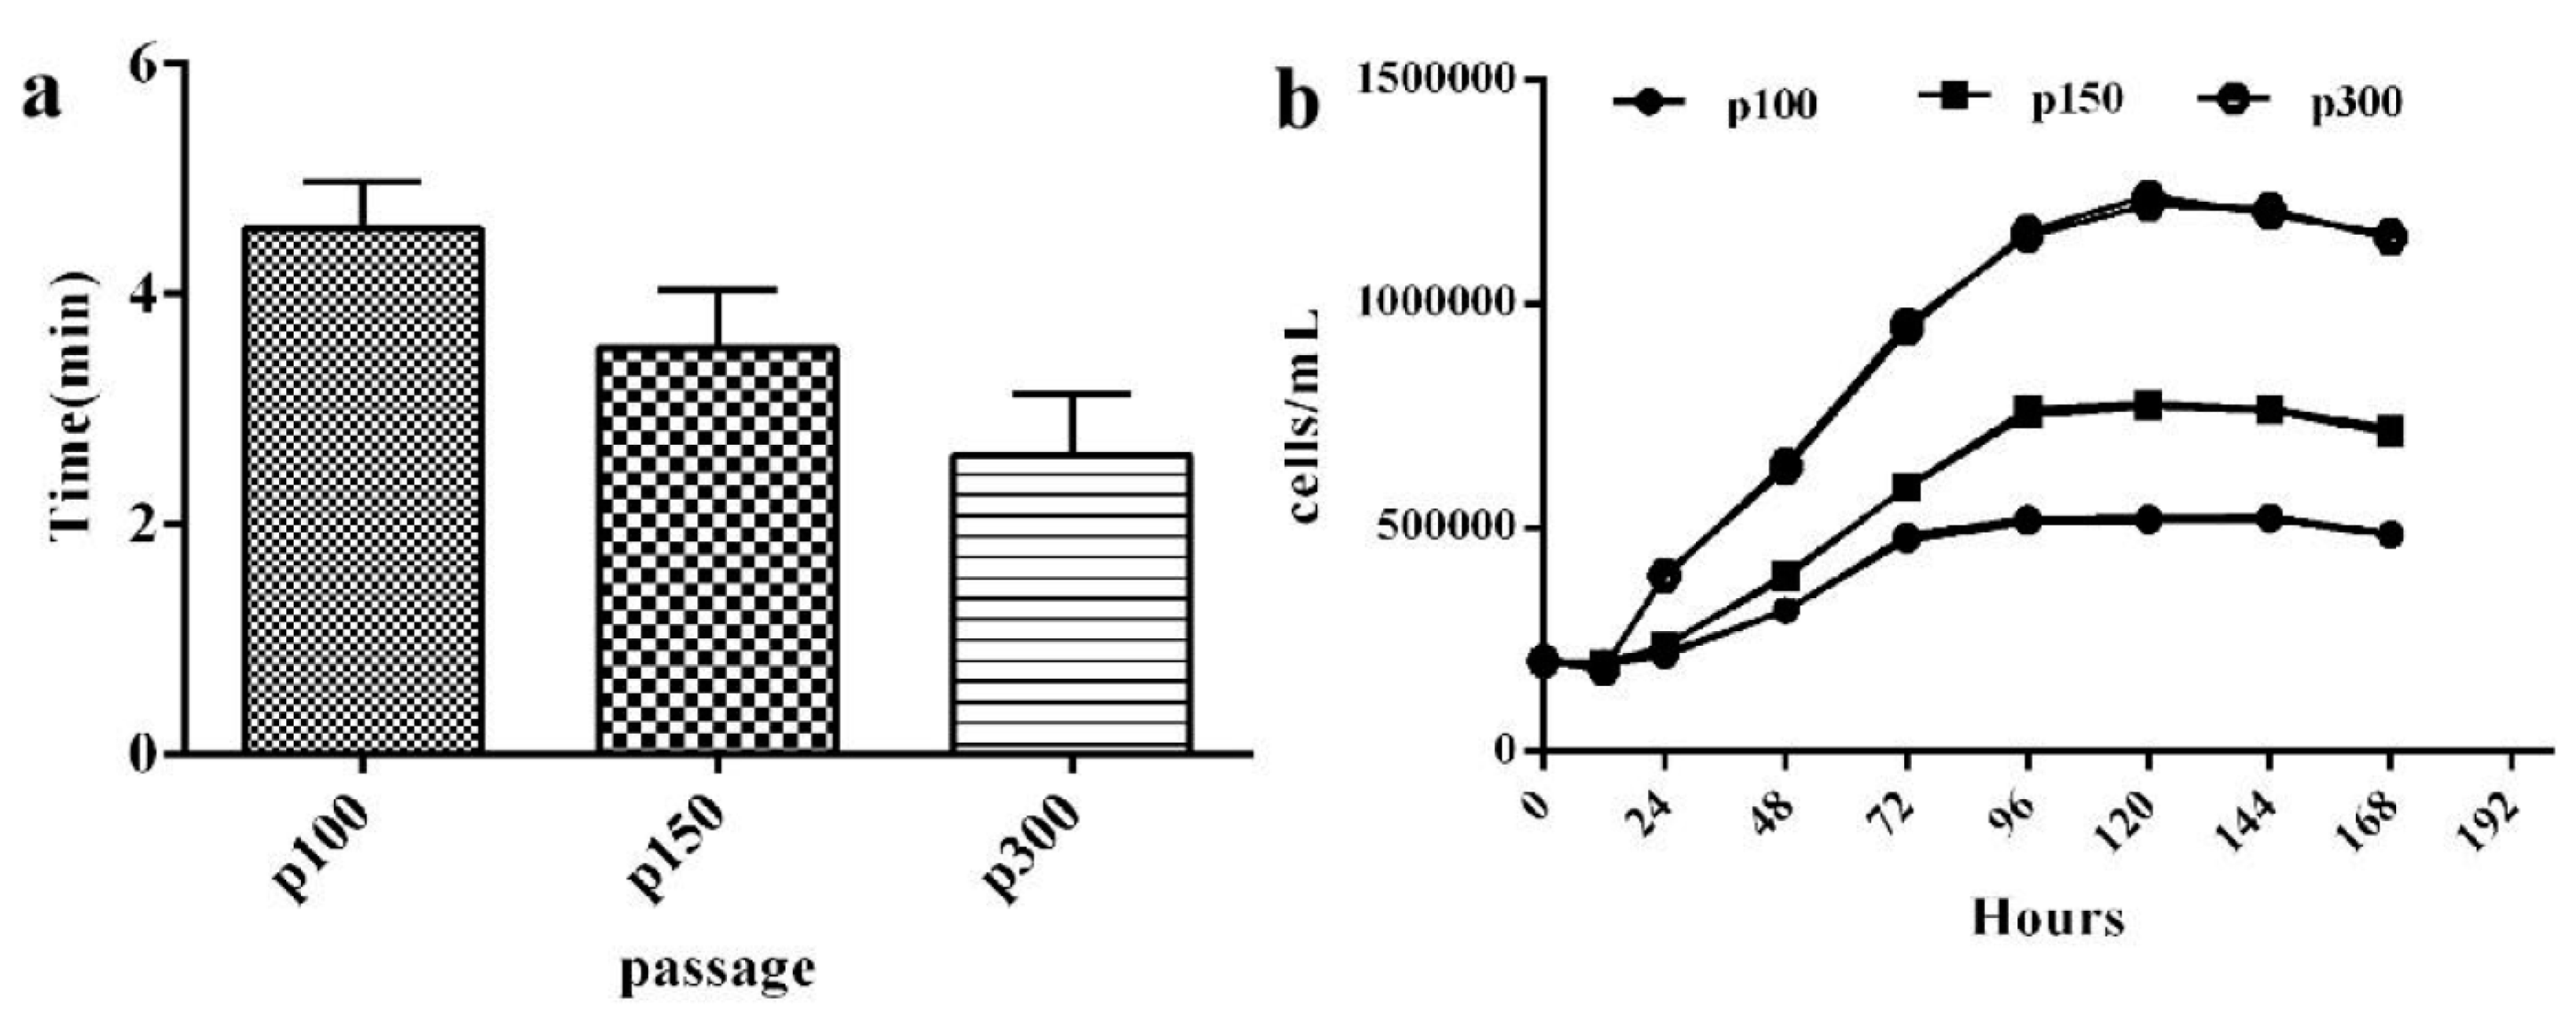
Figure 4.
The transfection efficiency of CPB p100 and p300 cells. (a) The expression green fluorescent protein in CPB p100 and p300 cells, respectively. (b) The transfection efficiency of CPB p100 and p300 cells. “*” represented the significant difference.
Figure 4.
The transfection efficiency of CPB p100 and p300 cells. (a) The expression green fluorescent protein in CPB p100 and p300 cells, respectively. (b) The transfection efficiency of CPB p100 and p300 cells. “*” represented the significant difference.
Figure 5.
The ISKNV, SCRV ,and LMBV cytopathic effect of different time points in CPB p300 cells. (a) The ISKNV cytopathic effect of different time points in CPB p300 cells. (b) The SCRV cytopathic effect of different time points in CPB p300 cells. (c) The LMBV cytopathic effect of different time points in CPB p300 cells.
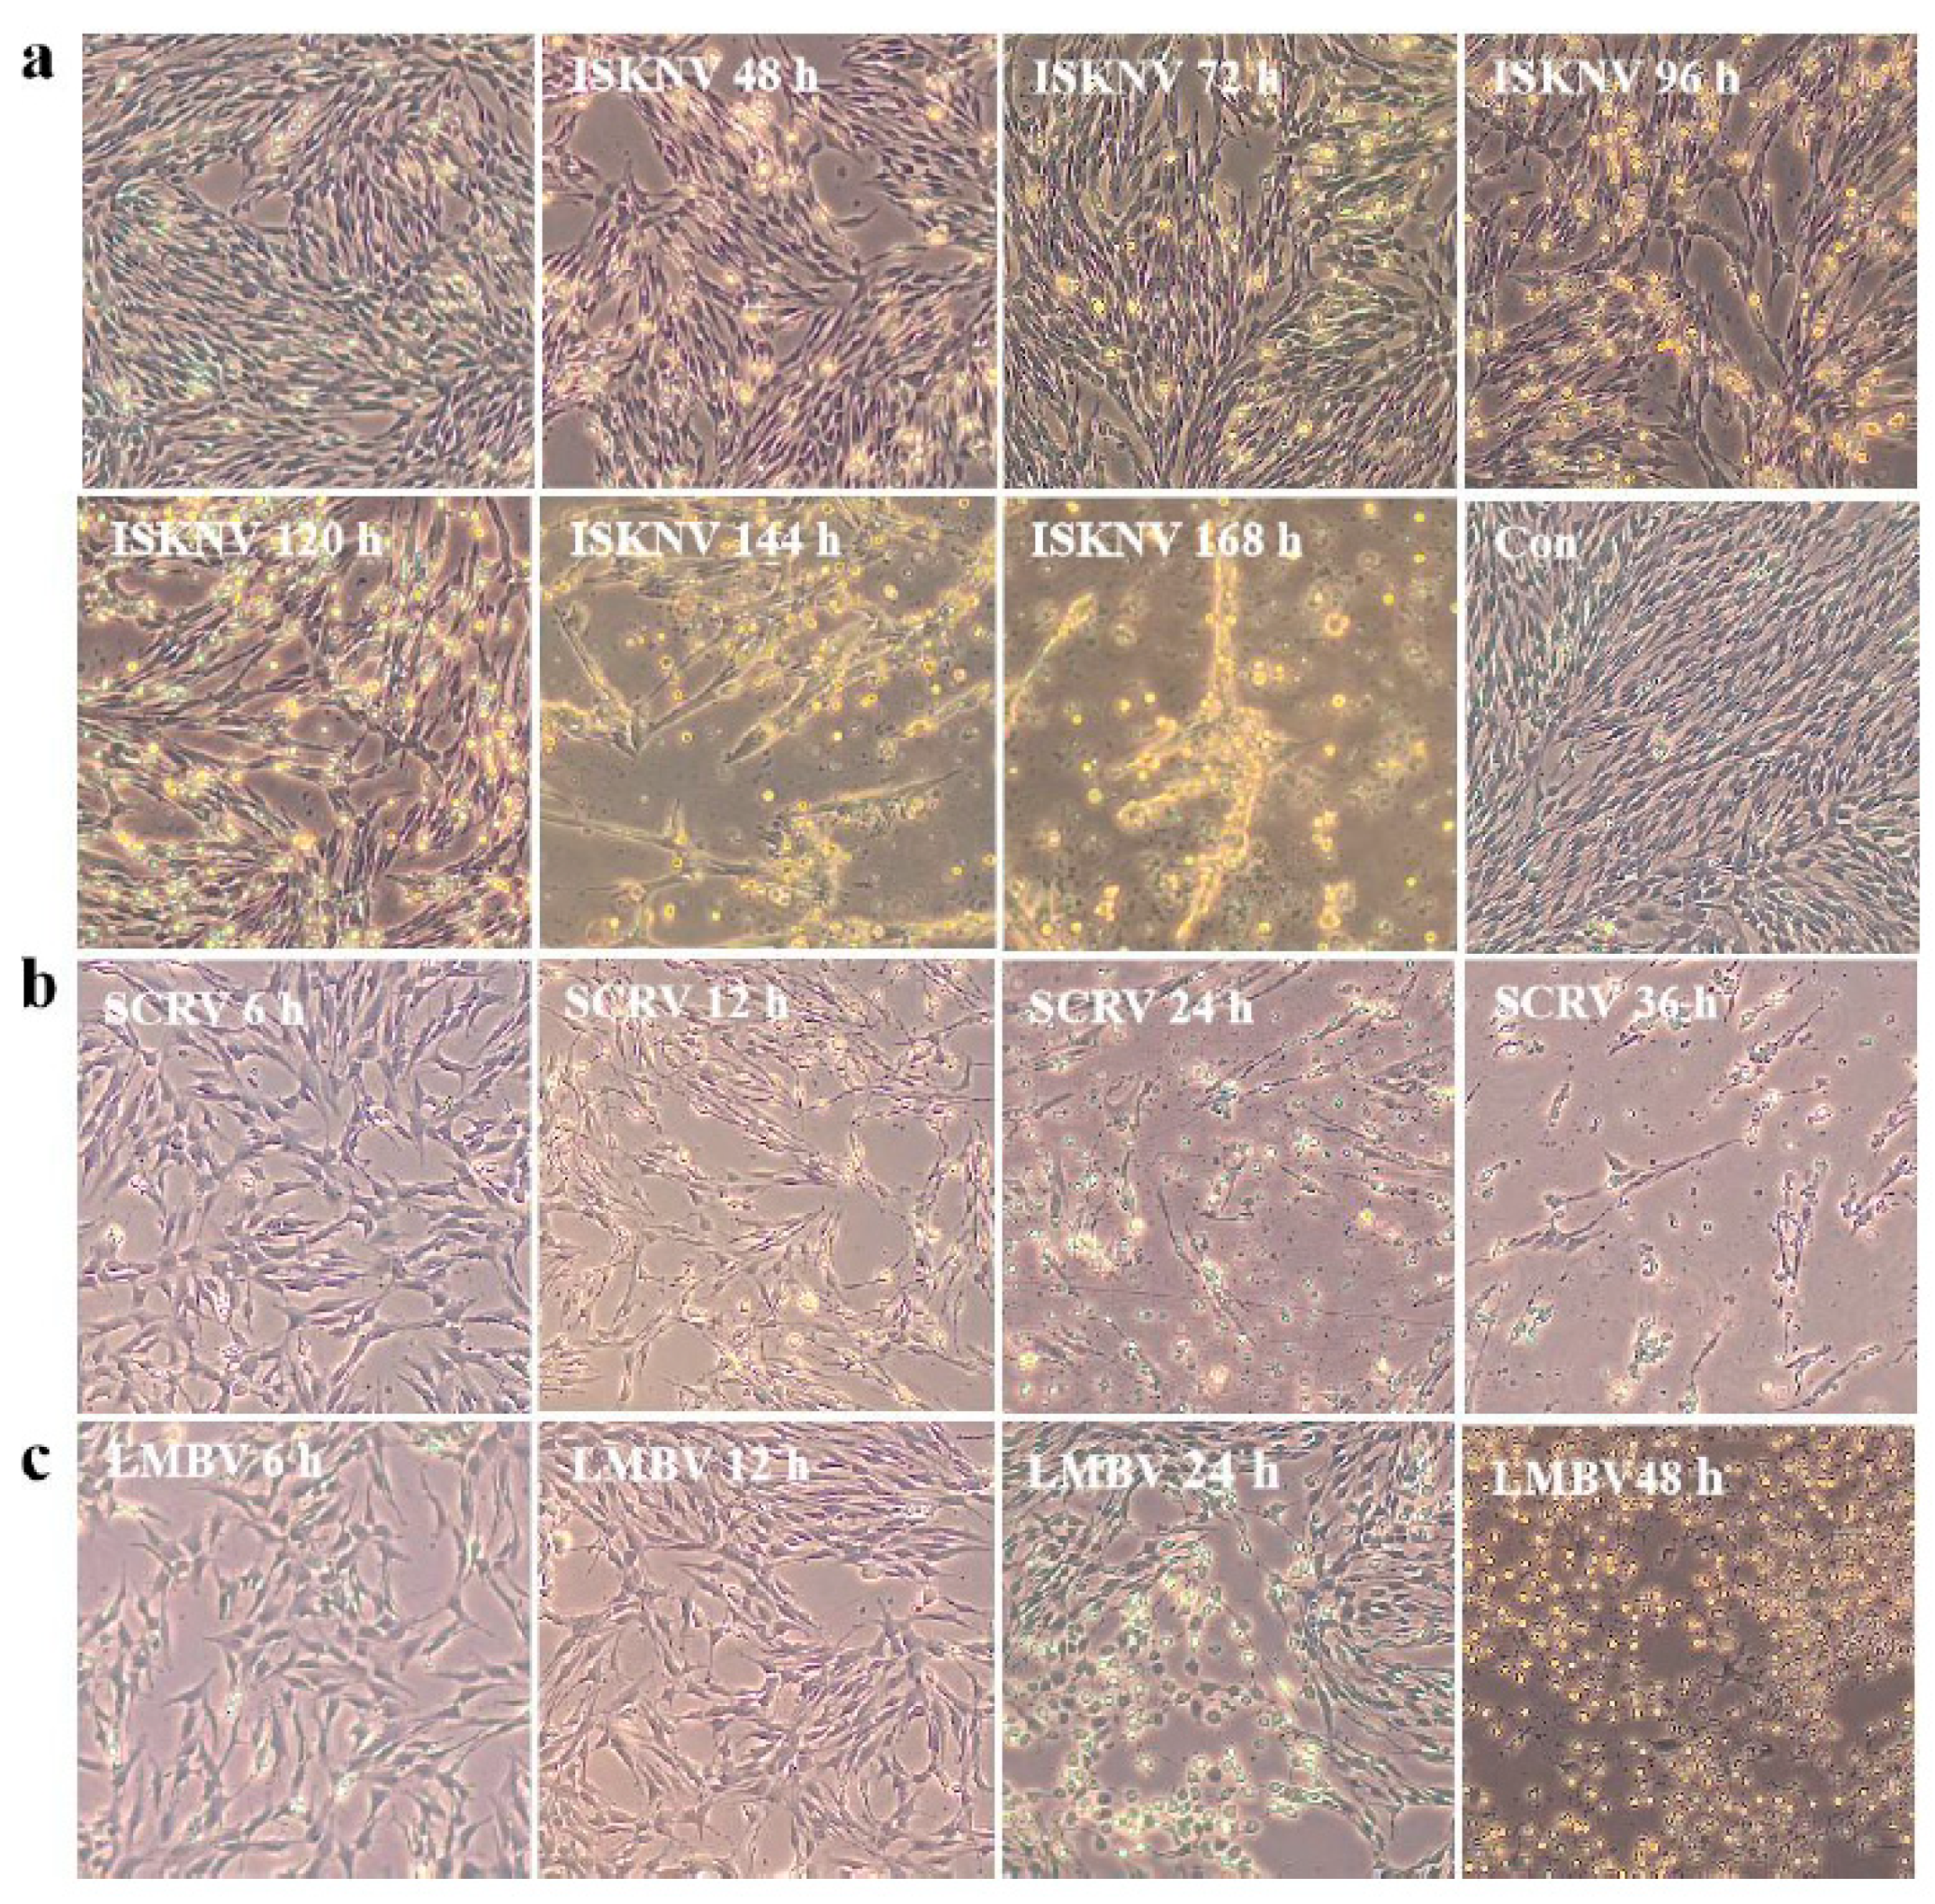
Figure 6.
The optimal incubation time, cell density, and incubation viruses dose of ISKNV, SCRV, and LMBV multiplication in CPB p300 cells, respectively. (a) The optimization of ISKNV, SCRV, and LMBV incubation time was 0 h, 48 h, and 0 h, respectively. (b) The optimization of cell densityin ISKNV, SCRV, and LMBV multiplication was 0.6 × 10⁵ cells/cm2, 0.8 × 10⁵ cells/cm2 and 0.7 × 10⁵ cells/cm2. (c) The optimization viruses dose of ISKNV, SCRV, and ISKNV incubation was MOI = 0.1, MOI = 0.001, and MOI = 0.05, respectively.
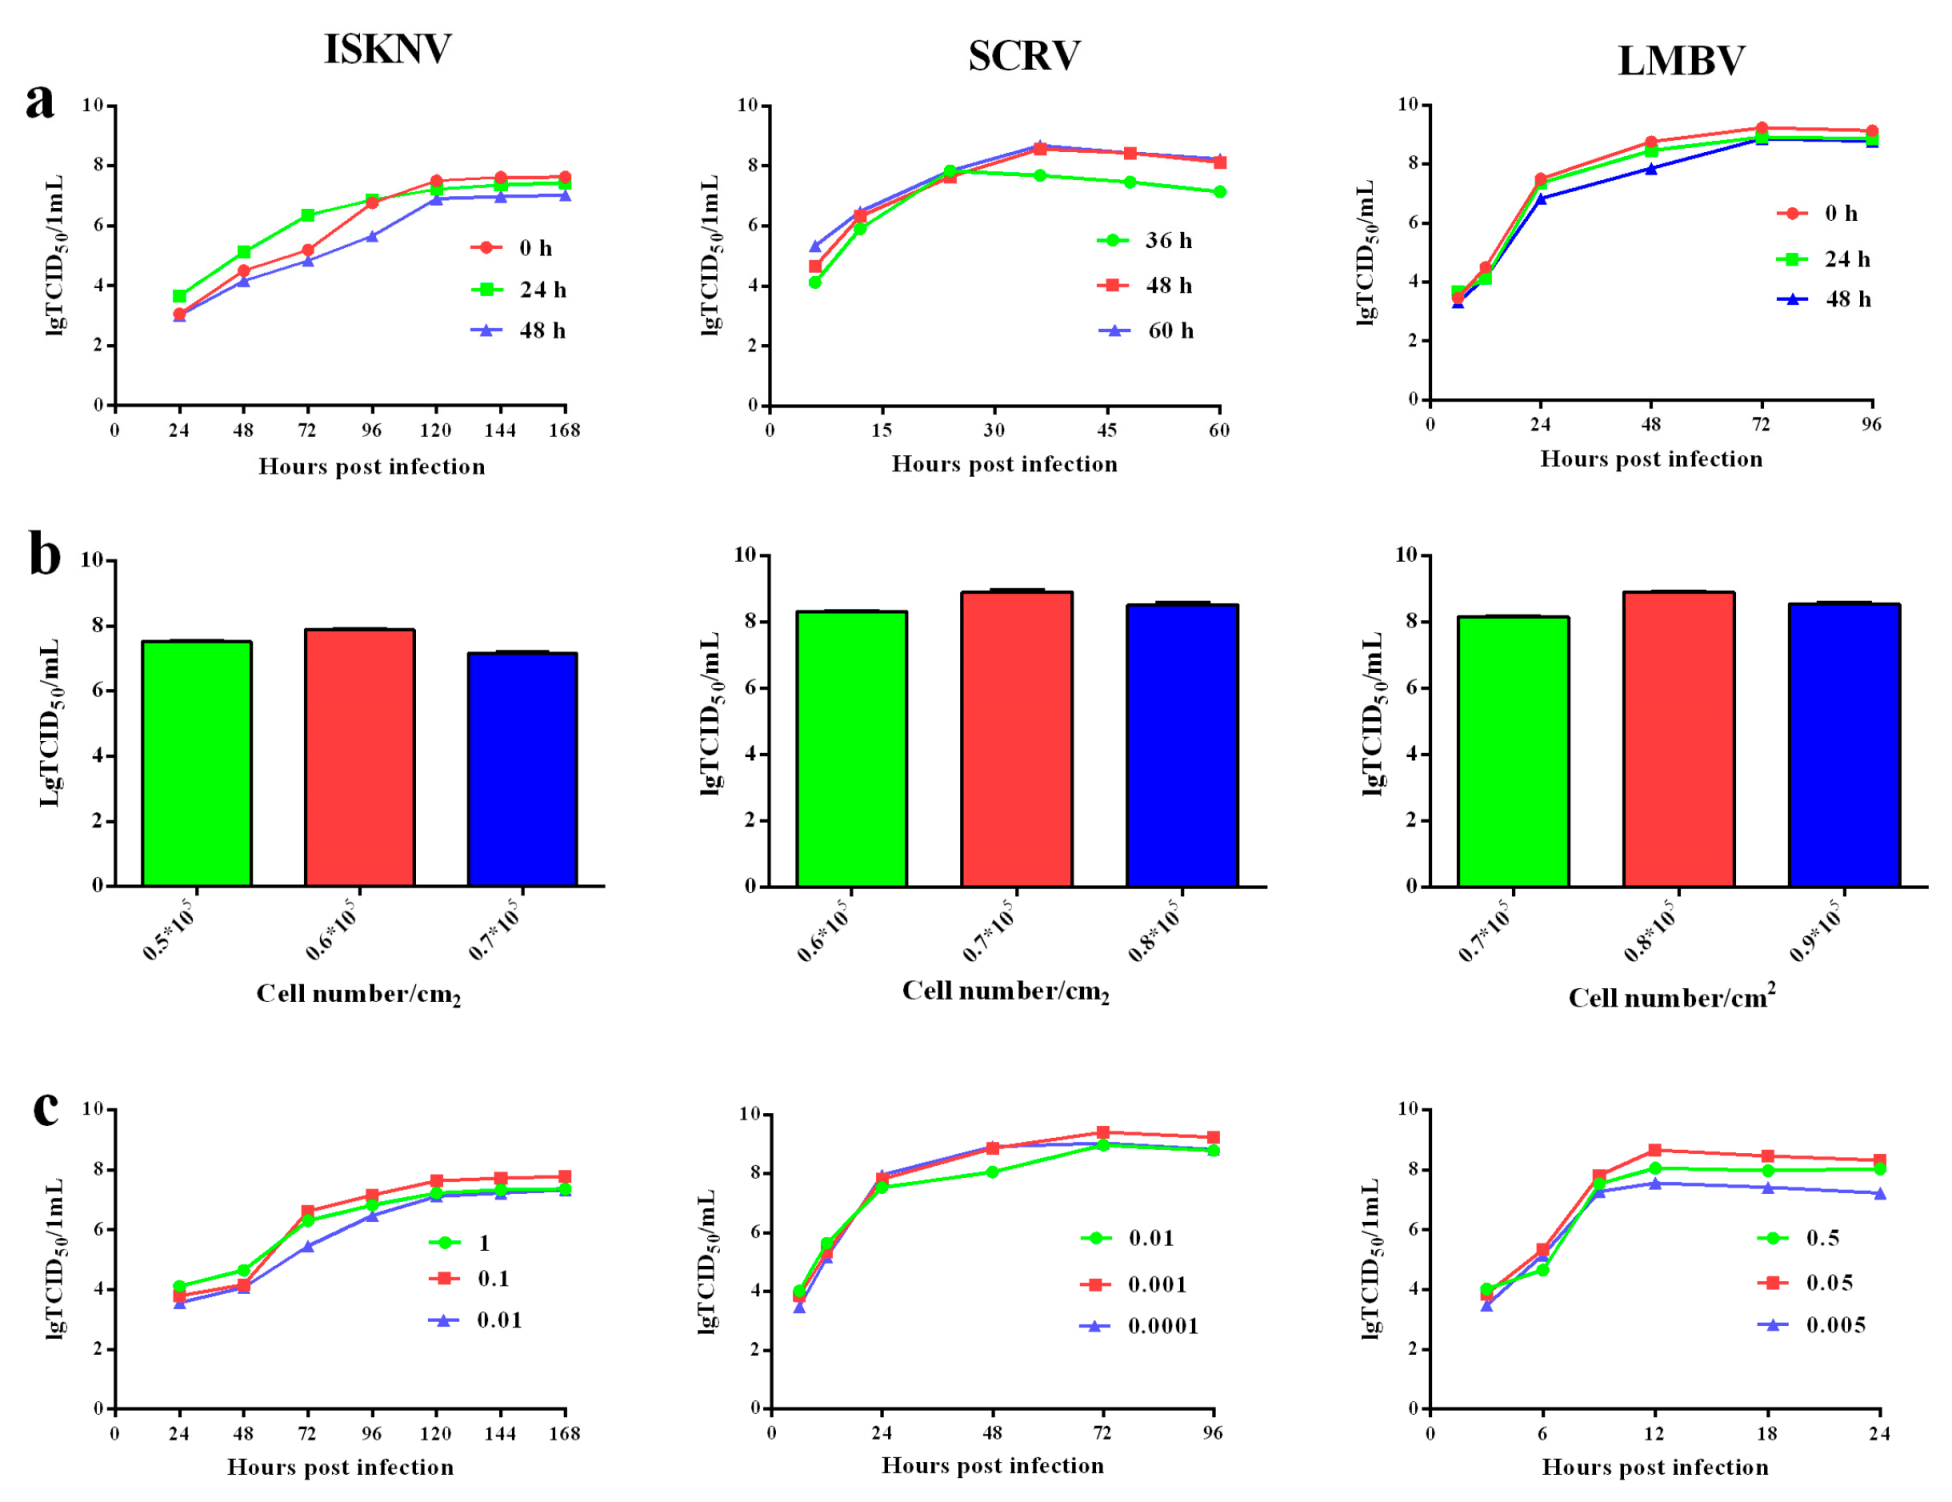
Figure 7.
The economic and time cost of virus multiplication. (a) The economics and time of the production of 15 mL ISKNV, SCRV, and LMBV in CPB p100 and p300 cells. (b) The TCID50/mLof ISKNV, SCRV and LMBV in CPB p100 and p300 cells.
Figure 7.
The economic and time cost of virus multiplication. (a) The economics and time of the production of 15 mL ISKNV, SCRV, and LMBV in CPB p100 and p300 cells. (b) The TCID50/mLof ISKNV, SCRV and LMBV in CPB p100 and p300 cells.
Table 1.
The cell doubling and multiplication of CPB p100, P150, and p300 cells.
Table 1.
The cell doubling and multiplication of CPB p100, P150, and p300 cells.
| T | 0 h | 24 h | 48 h | 72 h | 96 h | 120 h | 144 h | 168 h | Doubling | Multiplication |
|---|---|---|---|---|---|---|---|---|---|---|
| p100 | 2 × 10⁵ | 2.17 × 10⁵ | 3.15 × 10⁵ | 4.77 × 10⁵ | 5.16 × 10⁵ | 5.19 × 10⁵ | 5.20 × 10⁵ | 4.85 × 10⁵ | 60 h | 2.616 |
| p150 | 2 × 10⁵ | 2.36 × 10⁵ | 3.90 × 10⁵ | 5.89 × 10⁵ | 7.58 × 10⁵ | 7.74 × 10⁵ | 7.63 × 10⁵ | 7.16 × 10⁵ | 48 h | 3.61 |
| p300 | 2 × 10⁵ | 3.92 × 10⁵ | 6.36 × 10⁵ | 9.48 × 10⁵ | 1.16 × 10⁶ | 1.23 × 10⁶ | 1.20 × 10⁶ | 1.15 × 10⁶ | 24 h | 6.2 |
Table 2.
The TCID50/y and TCID50/d of CPB p100 and p300 cells, respectively.
Table 2.
The TCID50/y and TCID50/d of CPB p100 and p300 cells, respectively.
| Viruses | p100(TCID50/y) | p300(TCID50/y) | p100(TCID50/d) | p300(TCID50/d) |
|---|---|---|---|---|
| ISKNV | (2.25 ± 0.15) × 107 | (4.0 ± 0.15) × 107 | (2.52 ± 0.35) × 107 | (4.73 ± 0.22) × 107 |
| SCRV | (1.17 ± 0.16) × 108 | (2.24 ± 0.25) × 109 | (2.01 ± 0.35) × 108 | (4.84 ± 0.51) × 109 |
| LMBV | (2.00 ± 0.15) × 108 | (2.64 ± 0.36) × 109 | (3.77 ± 0.32) × 108 | (5.43 ± 0.35) × 109 |