A Fuzzy-AHP Multi-Criteria Decision-Making Approach for a Sustainable Supply Chain of Rice Farming Stakeholders in Edu-Patigi LGA, Kwara State, Nigeria
[ad_1]
1. Introduction
While rice is a crucial component of Nigerians’ diet, countries like India, Vietnam, Pakistan, and Thailand are the leading rice producers and exporters [1]. Rice is the third most produced crop worldwide and is citizens’ main source of energy in eight African countries, nine in North and South America, and seventeen in Asia and the Pacific [2]. According to [3], it is estimated that by 2035, the global population will require up to 560 million tons of rice. Nigeria has set out to achieve self-sufficiency in rice and increased its self-sufficiency ratio from 33% in 2009 to 50% in 2020 [4]. This could increase further given that the country has an additional 4.9 ha of land that could be devoted to rice [5]. The competitive performance of the Nigerian rice sector could also improve if there were more industrial mills and a supply of high-quality rice; this could yield an extra million tons of rice per year that could be competitive in terms of cost and quality [6]. However, rice production is low due to on-going use of traditional farming methods, the lack of irrigation, an inconsistent climate, poor access to credit facilities, and failure to adopt new technology [7].
While Nigeria is a rice producer, it is projected that by 2030, it will be one of the largest importers of this cereal [1] and that, between 2019 and 2028, sub-Saharan Africa (SSA) as a whole will rely on rice imports, with the global price per ton of milled rice expected to rise from USD 447 in 2018 to USD 470 by 2028 [8]. Africa has the potential to increase the supply of rice and become self-sufficient by increasing production. In pursuit of this objective [9], a policy framework, the Coalition for African Rice Development (CARD), was launched at the fourth Tokyo International Conference on African Development. It aimed to double domestic rice production in SSA countries between 2008 and 2018.
As one of the 23 African countries involved in the CARD policy framework, Nigeria has adopted various initiatives to increase rice productivity to promote food security and consumption of locally produced rice [10,11]. The Presidential Rice Initiative, which was launched in 2002, aimed to increase production and processing of rice through the provision of farm inputs and a variety of rice cultivars for rice farmers at subsidized rates. The Growth Enhancement Scheme is an e-wallet initiative that was introduced in 2011. A database of 15 million registered Nigerian farmers was developed to notify them via text messages of agro inputs and loans provided by the government. Other initiatives include the National Rice Development Strategy of 2009, the Rice Intervention Fund of 2011, the Agricultural Transformation Agenda of 2011, and the recent Anchor Borrowers Program set up in conjunction with the Central Bank of Nigeria. The program, which aims to improve the livelihoods of smallholder rice farmers, will provide inputs for those who supply produce to Anchor at harvest and receive payment directly from it. However, despite these interventions, rice demand in Nigeria outstrips supply [11]; furthermore, it does not meet international market standards.
Against this background, this paper measures the decision-making activities of small-scale rice farmers as stakeholders in the rice value chain in Edu/Patigi local government area against the sustainability dimensions set out in the Sustainable Rice Platform (SRP). The paper is structured as follows. Section 2 reviews the relevant literature on sustainability, supply chain management (SCM), and food security; Section 3 presents the methodology employed and discusses the criteria for sustainable practices in line with the quantitative data analysis and the Fuzzy-Analytic Hierarchy Process (F-AHP) multi-criteria decision-making (MCDM) approach; Section 4 presents and discusses the results; and Section 5 offers conclusions.
2. Literature Review
2.1. Food Security
The concept of food security, which is described using the four pillars of access, availability, utilization, and stability, was first introduced as a policy paper during the World Food Conference in 1974. The paper defined food security as “the availability at all times of adequate world food supplies of basic foodstuffs, particularly to avoid acute food shortages in the event of widespread crop failure, natural or other disasters, to sustain a steady expansion of food consumption in countries with low levels of per capita intake and offset fluctuations in production and prices” [12]. This definition has evolved over time. The Food and Agricultural Organization stated that the aim of food security should be that “people at all times have both physical and economic access to the basic food they need”. It emphasized that “food security should have three specific aims, namely ensuring production of adequate food supplies, maximizing the stability in the flow of supplies; and securing access to available supplies on the part of those who need them” [13]. This definition was proposed against the background of the considerable difficulties encountered by developing countries in importing food, causing economic instability at the global level [14].
The World Bank defined food security as “access by all people at all times to enough food for an active, healthy life” [15], while the Rome Declaration adopted during the World Food Summit in 1996 resolved as follows: “We will implement policies aimed at eradicating poverty and inequality and improving physical and economic access by all, at all times, to sufficient, nutritionally adequate food and its effective utilization” [16]. In 2001, the definition was updated as follows: “Food security exists when all people at all times, have physical, social and economic access to sufficient, safe and nutritious food which meets their dietary need and food preferences for an active and healthy life” [17]. Efforts have also been made to list the four pillars of food security in order of importance; for example, the Integrated Food Security Phase Classification states that food must first be available so that households can access it, after which it is utilized, which will eventually create a stable system [18]. This hierarchical approach [19] was based on the view that the availability of food does not guarantee access, and access does not automatically lead to effective utilization.
Authors such as [14] note that, more recently, proposals were made to the High-Level Panel on Food Security and Nutrition (HLPE) that agency and sustainability should be included in describing food security. The concept of agency as a pillar of food security builds on the work of Sen who described it as “what a person is free to do and achieve in pursuit of whatever goals or values he or she regards as important” [20]. It aims to promote equality for marginalized groups such as women, the youth, and small-scale producers. To this end, ref. [14] viewed agency as more focused on the food systems of the indigenous people; it is described as the ability of an individual, community, or group to possess and exert some level of control over their own situation and take responsibility for participating in the food system, thereby legalizing and institutionalizing frameworks that ensure an equal right to food and access to resources for production [21]. Sustainability as a pillar of food security is described as “food system practices that contribute to long-term regeneration of natural, social and economic systems, ensuring the food needs of the present generations are met without compromising food needs of future generations” [21].
2.2. Sustainable Supply Chain Management
Increasing attention has been paid in recent times to the concept of Sustainable Supply Chain Management (SSCM), which integrates sustainable development and SCM [22]. In SCM, sustainability relates to risk and adverse effects triggered by an array of activities alongside the supply chain. The authors of ref. [23] argued that SSCM could be used as a tool to improve business performance to the benefit of business and society at large. The authors of ref. [24] asserted that businesses can achieve a competitive advantage by developing sustainable supply chain (SSC) strategies. Such strategies are implemented by both internal management and by a supply chain’s external operations through the application of environmental management systems, and the identification, evaluation, and selection of sustainable suppliers [25]. The authors of ref. [24] identified factors such as creating a stakeholder-friendly environment, supporting activities that enhance social responsibility, and promoting economic inclusiveness as sustainable practices that could enhance a business’s performance.
Supply chain management plays a critical role in global economies, calling for an understanding of the interdependencies among supply chain partners [26]. It enables the identification and management of value-added activities across the supply chain and involves various components such as the operational strategy, outsourcing strategy, channel strategy, customer service strategy, and asset network [27,28]. Supply chains are made up of series of actors, agents, or sub-chains which, although individual entities, are interconnected through resources and the information required for effective performance of the chain [29]. A supply chain refers to all the activities linked to the transformation of raw materials through to production of goods for end-users. The process should aim to maintain sustainability in the activities engaged in by all stakeholders in order to achieve an enduring competitive advantage [30] and add value to the end user [31]. The need for enterprises to achieve sustainability and improve supply chain performance prompted the development of an SSC, which incorporates economic, social, and environmental dimensions.
According to the Council of Supply Chain Management Professionals, SCM links functions or processes by coordinating all the activities required to meet customer demand across a value chain [32,33]. Such activities include sourcing, procurement, conversion, and logistics-related matters which will require management and cooperation amongst stakeholders. The authors of ref. [24] proposed four indicators for an SSC, namely time, cost, efficiency, and effectiveness. Time evaluates the time taken for each stakeholder to perform value-adding activities; cost refers to the cost of implementing such activities in relation to profit; efficiency relates to efficient use of available resources; and effectiveness is the extent to which the supply chain’s set objectives are achieved. There is need for effective, efficient flow of information and material resources or nodes across the agents to avoid disruptions that can be caused by factors such as an environmental disaster or equipment failure [29], thereby enabling sustainability across the supply chain.
According to ref. [34], SSCM is “the strategic and systemic coordination of all the business functions, policies and procedures of a particular company, and across businesses within the supply chain, with the goal of improving the long-term performance of the whole supply chain and the companies that are involved in all its levels”. It includes the activities of other businesses that impact the achievement of the supply chain’s long-term goals. This calls for alignment among the businesses in question in terms of sustainable practices. The authors of ref. [35] reviewed the literature on an SSC and defined it as managing the flow of materials, information, and capital as well as engagement among several stakeholders within the supply chain while adopting the triple bottom line (TBL). The objective is to meet all stakeholders’ requirements while improving margins as well as building tenacity and fortitude over time. The pillars of sustainability developed by John Elkington (2004) describe the economic, environmental, and social values of investment that should accrue separately from a firm’s financial bottom line [36,37].
2.3. Triple Bottom Line
The TBL is based on the view that development should meet the needs of the present and future generations [36]. It has been applied in different sectors; for instance, ref. [38] examined the impact of the TBL on the organizational sustainability of Industry 4.0 in the manufacturing sector towards creating sustainable value. The authors of ref. [39] explored decision making in relation to the TBL for reverse logistics in India’s electronics sector. The authors of ref. [40] examined the adoption of the TBL to drive sustainability among buyers and suppliers with the aim of promoting SSCM. The authors of ref. [38] analyzed several articles to identify the TBL’s significance for value creation for Industry 4.0 and the Internet of Things. The authors of ref. [27] identified the adoption of the TBL in the sustainable decision-making activities of the supply chain of photovoltaic energy in the energy sector across seven countries. The authors of ref. [41] adopted decision-making factors (DMFs) to improve packaging methods, drive flexible monitoring, and evaluate the strategies adopted to reduce losses in the lamb supply chain. The authors of ref. [40] emphasized the importance of buyer organizations in driving sustainable practices by their suppliers. This is important because suppliers and buyers must ensure sustainability along the value chain. The author of ref. [41] stated that the TBL approach relates to people’s expectations, as its functionality is dependent on society. This scholar also identified a linkage between the TBL and SCM because economic, social, and environmental dimensions can only be understood by studying the whole supply chain. In the TBL, the environmental dimension focuses on reducing any form of pollution, efficient energy usage, waste reduction, and the principle of use and reuse, renewal, redesign, and regeneration of natural resources. The social dimension involves organizations ensuring the well-being of their employees, workplace diversity, and good working conditions, building and retaining human capital, and promoting justice and a good quality of life for workers through labor standards.
The economic dimension focuses on return on investment, improved sales, access to and management of financial resources, profitability, financial resilience and business stability, and balancing costs and revenue in the process of production and distribution towards long-term business capability [40,41]. This study applied the TBL to develop SCM that does not compromise the needs of future generations.
The authors of ref. [24] described SSCM as effective and efficient management of a business’s available resources through the integration of the TBL of economic, environmental, and social variables across its entire supply chain to enhance long-term profitability, resilience, and competitiveness. The research in ref. [38] concurs and defines a sustainable business as one that aligns with the scope of the TBL. The research in ref. [35] states that sustainable practices should focus on societal development, the interrelated environmental impact, and global economic issues. As shown in Figure 1, this research incorporates this view in examining the decision-making activities of small-scale rice farmers as stakeholders throughout the rice value chain. It identifies how actors or stakeholders across the rice value chain make sustainability-related decisions for sourcing input, efficient use of resources, and management of suppliers.
3. Methodology
3.1. Study Site
The study site was the Edu and Patigi local government area of Kwara state. Kwara State is one of the 36 states in Nigeria with a population of about 2.5 million (est. 4.10 million in 2019) [42]. It is one of the six north-central states in Nigeria and is situated 306 km from the coastal city of Lagos and 500 km from Abuja, the federal capital, with a total landmass of 32,500 square kilometers. The state is made up of 16 local government areas. Rice, which is the focus of this study, is cultivated in all the local government areas in the state; however, this study focuses on Edu and Patigi local governments where about 90% is produced [42].
3.2. Data Collection Method
Data were drawn from responses to a structured questionnaire administered to small-scale farmers who are members of the Rice Farmers Association of Nigeria (RIFAN) within the Edu-Patigi local government area of Kwara state. These farmers fall under the jurisdiction of the Kwara State Ministry of Agriculture, Agricultural Development Project Extension (ADP); the association is recognized by the government and it consults the government on policies regarding rice fields, cultivation, warehousing, and exports. Five RIFAN members’ responses about the 21 questionnaire items that focused on stakeholders’ decision-making activities were used for the study. A 6-point Likert rating scale was adopted, ranging from 1 (strongly disagree) to 6 (strongly agree).
3.3. Multi-Criteria Decision Making
Decisions such as the selection of suppliers and workers, selection of inputs such as rice seedlings and fertilizers, the choice of methods, equipment and machinery, and processing and storage methods, as well as decisions on loans are germane decisions farmers must take as they impact overall output and its competitiveness on the international market. For instance, ref. [41] examined the importance of decision making, especially in the farm-to-consumer supply chain, by adopting decision-making factors in an e-commerce model, with a focus on ensuring adherence to the hazard analysis critical control point (HACCP) for reducing losses in packaging lamb. The research in [34] proposed the adoption of MCDM and fuzzy logic to address such decisions. This brings into consideration the TBL dimension as the essential variable that influences the decision-making activities of stakeholders across the rice value chain.
Multi-criteria decision making is a tool used to select the right solutions to problems [43]. The authors of refs. [44,45] described it as an approach that can be adopted to make choices and prioritize options among various alternatives based on specified inter- and intra-attributes. The option with the highest level of alignment with the specified criteria is chosen. The authors of ref. [44] traced the emergence of MCDM to the work of Von Neuman and Morgenstern, who introduced utility theory in 1944 as a basis for decision-making science. This evolved into goal programming, which resulted in the establishment of the school of MCDM and the development of user-friendly decision-making tools.
MCDM is applied in this research to understand the decision making and alignment of stakeholders across the rice value chain about sustainable practices such as the choice of partners, inputs and resources, and even production. Smallholder farmers need to decide which technology to adopt and the resource management techniques required to improve their productivity [46]. Several attributes were considered. The criteria were based on sustainable practices of the TBL, including are social, economic, and environmental factors. These were further defined based on sustainable practices’ inter- and intra-attributes. Decisions such as the selection of suppliers and workers, as well as inputs such as rice seedlings and fertilizers, the choice of methods, equipment and machinery, processing and storage methods, and decisions on loans, are germane decisions farmers must make as they impact the overall output and its competitiveness on the international market. The research in ref. [34] proposed the adoption of MCDM and fuzzy logic to address such decisions. This brings into consideration the TBL dimension as the essential criterion that influences the decision making of stakeholders across the rice value chain.
The research in ref. [47] notes that MCDM offers several methods which can be misused by decision-makers. The problems include computational ones resulting from the availability of multiple options, or inadequately capturing the uncertainties associated with each attribute. The fuzzy method was introduced to address these problems. It allows such attributes or data associated with uncertainties to be presented in a fuzzy approach that enables human thought to be adapted to linguistic values. Sets of non-statistical data obtained by soliciting the views of participants that may be filled with uncertainties are interpreted using fuzzy logic and values are assigned to the dataset that reflect degrees of truth ranging from 0 to 1. A membership function is generated for each linguistic value which identifies and displays its degree of membership in an interval of zero to one; this is further adopted for the fuzzy Analytical Hierarchy Process (F-AHP) ref. [45]. F-AHP is an innovative aspect of the AHP model developed by Satty which has been deployed in the MCDM model in various fields of research. By using the If–Then rule, it maps the input–output linguistic variable [34]. This is shown in Table 1, which illustrates the assessment of triangular fuzzy numbers, while Table 2 presents the triangular fuzzy scale.
A fuzzy set, as illustrated by [34] as
is a set of ordered pairs, where X is a subset of the real numbers 𝓡, and μA (x) is called the membership function, which assigns to each object “x” a grade of membership ranging from zero to one.
Triangular Fuzzy Numbers (TFNs)
According to [34], a TFN as shown in Figure 2 is illustrated by a triplet (p′, q′, r′) where p′, q′, and r′ represent the lower, middle, and upper values of support of a fuzzy number.
Equation (2)
With −∞ < p′; ≤ q′ ≤ r′ ≤ ∞
3.4. Fuzzy Analytical Hierarchy Process (AHP)
Fuzzy logic is an associate of Boolean logic that adopts the use of partial truth, which mathematically describes and resolves vague judgements when ambiguity or uncertainty is identified in the process of individuals making decisions [47]. The concept, which was developed by L.A. Zadeh in 1965, uses human reasoning to generate linguistic variables and membership functions that capture vague entities or those with some level of uncertainty [34,47]. The F-AHP assists the calculation of the level of importance of identified criteria and sub-criteria (see Table 3 for its application in this study).
The research in ref. [48] states that F-AHP simplifies identified problems hierarchically and uses an eigenvector concept to prioritize the ranking for the sub-criteria using a pairwise comparison matrix. It is used to evaluate and prioritize complex decision-making problems. An extension of the traditional AHP method, it allows for the inclusion of imprecise or uncertain data in the decision-making process. The general guidelines on how to apply F-AHP are as follows:
-
Define the problem: Clearly define the problem you want to solve and identify the criteria and sub-criteria that will be used to evaluate the alternatives.
-
Create a pairwise comparison matrix: Create a matrix that compares each criterion and sub-criterion with every other criterion and sub-criterion. Use a scale to rate the relative importance of each pair.
-
Calculate the priority vectors: Use the pairwise comparison matrix to calculate the priority vectors for each criterion and sub-criterion.
-
Calculate the consistency ratio: Check the consistency of the pairwise comparison matrix by calculating the consistency ratio. A consistency ratio of less than 0.1 is considered acceptable.
-
Calculate the fuzzy weights: Use the priority vectors and the triangular fuzzy numbers to calculate the fuzzy weights for each criterion and sub-criterion.
3.5. Selection Criteria
Figure 3 is the Sustainable Rice Performance (SRP) indicator that shows the criteria that were adopted from the performance indicators recommended by the SRP [49] and further categorized based on TBL.
3.5.1. Social Criteria
The social dimension of sustainability has been measured using various criteria that impact the activities of organizations and society [34]. This research categorized the social criteria into three nodes, namely Consumer need (SOC-1), with child node quality assurance and storage system; Social development (SOC-2), with child nodes job creation, skills acquisition, and safe working conditions; and Regulatory (SOC-3), with child nodes government intervention and tax payment. These are shown in Table 4.
3.5.2. Economic Criteria
Economic criteria are high on the rice farmers’ agenda. They are categorized into the three nodes shown in Table 5, namely Sustainable sourcing (ECO-1), with child nodes supplier diversity, transparency, and quality input; Sustainable Supply Chain Practices (ECO-2), with child nodes loan repayment, adoption of new technology, and financial decisions; and Livelihood (ECO-3), with child node profitability.
3.5.3. Environmental Criteria
This dimension of sustainability is critical in that environmental issues are in themselves drivers of SSCM with a focus on the total life cycle of the grain, the inputs used, and reusability [50]. The criteria ensure that the practices adopted reduce unintentional negative effects on the environment during production, delivery, and through to the end-user or final consumer [49]. Table 6 shows that the nodes for these criteria are Natural resources (ENV-1), with child nodes water usage, land usage, and weed management; (ENV-2), with child node processing method; and (ENV-3), with child nodes power usage, grain wastage, and seed selection.
The criteria adopted in this study are in line with the overall sustainable development goals and applicable to the area of study. The criteria obtained from the questionnaire were converted to scores in order to reflect the rice farmers’ decisions.
4. Results
5. Discussion
Table 4 displays the results from the social dimension. With the acceptance weight of >0.1, a safe working environment and job creation weigh 0.323 and 0.247, respectively. This connotes that RIFAN members prioritize safe working conditions, especially in terms of attacks by Fulani herdsmen. Manual processing methods require more labor, leading to increased labor demand and job creation within the community. The storage system weighs 0.129. The RIFAN members indicated that such a system is not available within the region; as such, there are no silos to promote food security. With skills acquisition weighing 0.115, this implies RIFAN members’ willingness to improve their skills if afforded the opportunity.
Tax payment, quality assurance, and government intervention weigh <0.1; this is an indication that they are not prioritized decisions among the respondents and there are no platforms to enable tax payment and quality assurance. Quality assurance should be a means of checking produce for color, stones, and brokenness. A sound quality assurance platform will give rice produced in the region a competitive edge in the international market. Government intervention weighs 0.057, which implies that no policies guide the activities of the RIFAN members and other stakeholders across the rice value chain.
The results for the economic dimension are presented in Table 5. Considering the acceptable weight of >0.1, supplier diversity and adoption of new technology weigh 0.349 and 0.21, respectively. This implies that the rice farmers have diverse suppliers of input. It may not be beneficial, as the suppliers are not regulated. This criterion is linked to quality input, which weighs 0.129. Drawing on ref. [10], a structure was developed for effective sourcing of seedlings and fertilizers that would improve productivity and ensure traceability within the rice supply chain. The weight for adoption of new technology implies the rice farmers’ willingness to adopt new technology to enhance productivity and profitability. Profitability ranked third, with a weight of 0.129. The RIFAN members indicated that they make sufficient profit to employ more people. This criterion is linked to the job creation criterion of the social dimension with a weight of 0.247. Job creation is a social development sub-dimension of the social dimension of sustainability. Although the cost incurred in hiring labor negatively impacts profitability, the farmers continue to do so due to the manual production and processing methods used. According to ref. [49], profitability estimates the profit made from the rice produced. The farmers should be taught to keep records of sales and expenditure with the aim of improving profitability.
Decisions on finances ranked fourth; this criterion connotes that high costs are incurred for input, labor, equipment, and transport. It also includes the decision on obtaining loans and credit. This weighs 0.108, which implies that it is germane to the rice farmers’ productivity. The authors of ref. [49] described productivity based on grain yield and labor productivity. Productivity on grain yield gives the estimated productivity of grain harvested without adjustment to the moisture content. With this understanding, the farmer is aware of the differences in the various harvest seasons and compares them. Labor productivity gives an estimate of the farmer’s productivity, which is a function of the number of people involved in cropping on the field at a time. It enables the farmer to understand that the application of various management practices contributes to the volume of grain the labor of each person produces.
Loan repayment and transparency weigh 5], who stated that the RIFAN members in that region find ways to avoid repaying loans obtained through the Anchor Borrower Scheme. Transparency weighs 0.028, which is the lowest; this implies that there are no measures in place to prevent corrupt practices across the value chain. It is also linked to the quality assurance criterion of the social dimension, which verifies that ADP extension workers check the grain before taking it to the market. This criterion weighed 0.063, which is
Table 6 presents the results for the environmental dimension. Water usage has the highest weight of 0.349. This implies that the RIFAN members make strong, sustainability-related decisions with regard to water usage. The authors of ref. [49] identified water usage as an environmental criterion for sustainability, which requires that rice farmers understand the importance of the quality and quantity of water. This is measured by water control and irrigation. RIFAN members have a sufficient water supply and create water beds as a sustainable practice to control water flow, thereby avoiding water erosion and contamination of water.
Decisions on land usage and processing methods ranked second and third. Land usage is measured by how often land is treated after each harvest; the results indicate that sustainable practices are embraced and that the moisture level of the land is maintained following the harvest. The processing method measures the kind of method adopted to process output. The result is 0.140, which implies that RIFAN members continue to employ manual farming and processing methods and have not embraced technology. Weed management, which weighed 0.128, ranked fourth, which implies that appropriate decisions are made concerning the use of chemicals (see [49]).
Chemicals such as NPK are used to manage weeds, although the recommended proportion was not measured in this research. Power usage and seed selection weighed 0.082 and 0.055, respectively; this is <0.1, which indicates that little attention is paid to decisions on the choice of seedlings and power usage. RIFAN members indicated that they use fuel because there is no good supply of electricity. The weight of seed selection implies that members obtain seeds from unverified suppliers; such seedlings affect productivity and grain quality, a reason for poor-quality grain.
6. Conclusions
This study adopted MCDM fuzzy-AHP to assess decision making in relation to the adoption of sustainable practices in the rice supply chain from the perspective of small-scale RIFAN members (rice farmers) in the Edu-Patigi local government region of Kwara state, Nigeria. The model enabled the identification and prioritization of the sustainability-related practices embraced by the RIFAN members towards the drive for food security within the region. Water usage and supplier diversity ranked highest, followed by a safe working environment across the three dimensions of sustainability. However, to improve the performance of the small-scale RIFAN members, government as a stakeholder in the rice supply chain should promote the adoption of sustainable practices across the rice value chain, drawing on specific indicators such as those identified in the SRP. The SRP is a voluntary initiative that aims to ensure sustainability through the efficient utilization of resources and best management practices across the rice value chain.
This would enable rice farmers to check for the presence of pests and beneficial organisms and guide the use of pesticides. The pesticides applied per area of land used for rice farming would also be recorded. With regard to water for irrigation, given the need for high-quality water, the source must be free from contamination. Rice farmers need to source seedlings, fertilizers, and chemicals from designated, government-approved centers or suppliers. This would ensure the use of quality inputs that must be used in the right quantity. There is also a need to enhance efficiency in the nitrogen and phosphorus make-up of the chemicals used and the ADP team should guide users in this regard. Rice farmers should be encouraged to use both organic and inorganic fertilizers.
The quest for food security can be best driven by government intervention, such as policies on sustainable sourcing of inputs, such as quality seedlings and fertilizer, a variety of seedlings, and improved or technologically driven equipment and methods. To ensure the quality and quantity of output, the government has the responsibility to facilitate the supply of resources such as technological equipment, human resources, an enabling working environment, and rice seedlings from high-yielding varieties (HYVs). This would enhance productivity and job creation all year round. The availability of HYVs could be facilitated by research and development to ensure the right variety of seeds that thrive in specific regions, regardless of the season. Government should also educate other stakeholders across the rice value chain, including a train-the-trainer scheme, and skills training for ADP extension workers, including the use of technology. The ADP extension workers will, in turn, train the rice farmers. The work in [50] recommends that training be provided on the application of pesticides; age- and gender-appropriate pesticide applicators; storage of pesticides; disposal of containers; ablution and changing facilities for those working with pesticides; agriculture-related knowledge; the use of modern agricultural technologies; assessment of soil and grain samples. Farmers should be trained on how to reduce emissions and how to grow short-grain varieties of rice.
Lastly, the government should establish a platform to empower women to make decisions relating to their well-being such as personal and household income, labor inputs, agricultural production inputs, information and capacity building, and violence against women.
The limitation of this study is that the analysis was based on the opinions of a single category of stakeholders in the rice value chain. The views expressed are thus not representative of those of other stakeholders. Nonetheless, the research contributes to the body of knowledge by assessing the priorities and adoption of sustainable practices among rice farmers for SSCM using a fuzzy-AHP MCDM model. Another limitation is the criteria used. However, the number of criteria were reduced to ensure the use of the most relevant ones to assess the prioritization of sustainable practices among the RIFAN members.
Future research should include the views of stakeholders across the rice value chain, with more criteria included for the best possible rankings. The model proposed in this study could be used for other agricultural output or stakeholders across the value chain of other crops towards the adoption of SSC practices to drive food security in Nigeria.
Author Contributions
Conceptualization, A.O.B. and T.P.M.; methodology, A.O.B.; software, A.O.B.; validation, A.O.B. and T.P.M.; formal analysis, A.O.B.; investigation, A.O.B.; resources, A.O.B.; data curation, A.O.B.; writing—original draft preparation, A.O.B.; writing—review and editing, T.P.M.; visualization, T.P.M.; supervision, T.P.M.; project administration, A.O.B.; funding acquisition, T.P.M. All authors have read and agreed to the published version of the manuscript.
Funding
This research received no external funding.
Institutional Review Board Statement
The study was conducted in accordance with and approved by the Ethics Committee of the University of KwaZulu-Natal (Humanities and Social Science Research Ethics Committee—HSSREC (HSSREC/00003546/2021 and 11/11/2021).
Informed Consent Statement
Informed consent was obtained from all subjects involved in the study.
Data Availability Statement
The data presented in this study are available on request from the corresponding author.
Acknowledgments
The authors acknowledge support from the University of KwaZulu-Natal and RIFAN members of Edu-Patigi local government area of Kwara state who participated in the research.
Conflicts of Interest
The authors declare no conflicts of interest.
References
- OECD/FAO. OECD-FAO Agricultural Outlook 2021–2030; OECD Publishing: Paris, France, 2021. [Google Scholar] [CrossRef]
- Rathna Priya, T.S.; Eliazer Nelson, A.R.L.; Ravichandran, K.; Antony, U. Nutritional and Functional Properties of coloured rice varieties South India: A Review. J. Ethn. Foods 2019, 6, 11. [Google Scholar] [CrossRef]
- Arunrat, N.; Sereenonchai, S. Assessing Ecosystem Services. Rice–Fish Co-Culture and Rice Monoculture in Thailand. Agronomy 2022, 12, 1241. [Google Scholar] [CrossRef]
- Twine, E.E.; Ndindeng, S.A.; Mujawamariya, G.; Futakuchi, K. Pricing Rice Quality Attributes and Returns to Quality Upgrading in Sub-Saharan Africa. J. Agric. Appl. Econ. 2022, 54, 175–196. [Google Scholar] [CrossRef]
- Chidiebere-Mark, N.; Ohajianya, D.; Obasi, P.; Onyeagocha, S. Profitability of Rice Production in Different Production Systems in Ebonyi State, Nigeria. Open Agric. 2019, 4, 237–246. [Google Scholar] [CrossRef]
- Ojo, T.O.; Ogundeji, A.A.; Babu, S.C.; Alimi, T. Estimating Financing Gaps in Rice Production in Southwestern Nigeria. J. Econ. Struct. 2020, 9, 12. [Google Scholar] [CrossRef]
- Obinna, E.C.; Uzoma, I.C.; Chidume, A.J. A Profitability of Actors in Rice Value Chain in Nigeria: A Comparative Analysis. Int. J. Innov. Res. Adv. Stud. 2020, 7, 59–66. [Google Scholar]
- OECD/FAO. OECD-FAO Agricultural Outlook 2019–2028; OECD Publishing: Paris, France, 2019. [Google Scholar] [CrossRef]
- Arouna, A.; Fatognon, I.A.; Saito, A.; Futakuchi, K. Moving toward rice self-sufficiency in sub-Saharan Africa by 2030: Lessons learned from 10 years of the Coalition for African Rice Development. World Dev. Perspect. 2021, 21, 100291. [Google Scholar] [CrossRef]
- Ayuba, G.; Abba, M.; Abubakar, M.M. Effect of Anchor Borrowers Programme (ABP) on Technical Efficiency of Beneficiary Rice Farmers in Kebbi State, Nigeria. Int. J. Agric. Econ. 2020, 5, 106–113. [Google Scholar] [CrossRef]
- United Nations. Report of the World Food Conference, Rome, 5–16 November 1974, 1975. Available online: https://digitallibrary.un.org/record/701143?ln=en (accessed on 15 April 2023).
- FAO. World Food Security: A Reappraisal of the Concepts and Approaches; Director General’s Report; FAO: Rome, Italy, 1982. [Google Scholar]
- Clapp, J.; Moseley, W.G.; Burlingame, B.; Termine, P. The case for a six-dimensional food security framework. Food Policy 2022, 106, 102164. [Google Scholar] [CrossRef]
- World Commission on Environment and Development (WCED). Our Common Future; Oxford University Press: Oxford, UK, 1987. [Google Scholar]
- FAO (1996). Rome Declaration on World Food Security and World Food Summit Plan of Action; FAO: Rome, Italy, 1996; Available online: http://www.fao.org/3/w3613e/w3613e00.htm (accessed on 24 June 2023).
- FAO. The State of Food Insecurity in the World 2001; FAO: Rome, Italy, 2001; Available online: http://www.fao.org/docrep/003/y1500e/y1500e00.htm (accessed on 24 June 2023).
- IPC. Integrated Food Security Phase Classification: Technical Manual Version 3.0. 2019. Available online: http://www.ipcinfo.org/fileadmin/user_upload/ipcinfo/manual/IPC_Technical_Manual_3_Final.pdf (accessed on 18 May 2022).
- Upton, J.B.; Cissé, J.D.; Barrett, C.B. Food security as resilience: Reconciling definition and measurement. Agric. Econ. 2016, 47, 135–147. [Google Scholar] [CrossRef]
- Sen, A. Well-being, agency and freedom: The Dewey lectures 1984. J. Philos. 1985, 82, 169–221. [Google Scholar] [CrossRef]
- HLPE. Food Security and Nutrition: Building a Global Narrative towards 2030. 2020. Available online: http://www.fao.org/3/ca9731en/ca9731en.pdf (accessed on 12 July 2022).
- Erol, I.; Velioglu, M.N. An investigation into sustainable supply chain management practices in a developing country. Int. J. Ebusiness Egovernment Stud. 2019, 11, 104–118. [Google Scholar] [CrossRef]
- Liu, K.S.; Lin, M.H. Performance assessment on the application of artificial intelligence to sustainable supply chain management in the construction material industry. Sustainability 2021, 13, 12767. [Google Scholar] [CrossRef]
- Hsu, H.Y.; Hwang, M.H.; Chiu, Y.S.P. Development of a strategic framework for sustainable supply chain management. AIMS Environ. Sci. 2021, 8, 532–552. [Google Scholar] [CrossRef]
- Su, Z.; Zhang, M.; Wu, W. Visualizing sustainable supply chain management: A systematic scientometric review. Sustainability 2021, 13, 4409. [Google Scholar] [CrossRef]
- Reefke, H.; Sundaram, D. Key themes and research opportunities in sustainable supply chain management—Identification and evaluation. Omega 2017, 66, 195–211. [Google Scholar] [CrossRef]
- Li, L.; Su, Q.; Chen, X. Ensuring supply chain quality performance through applying the SCOR model. Int. J. Prod. Res. 2011, 49, 33–57. [Google Scholar] [CrossRef]
- Putro, A.W.; Purwaningsih, E.K.; Sensuse, D.I.; Suryono, R.R. Model and implementation of rice supply chain management: A literature review. Procedia Comp. Sci. 2022, 197, 453–460. [Google Scholar] [CrossRef]
- Lis, A.; Sudolska, A.; Tomanek, M. Mapping research on sustainable supply-chain management. Sustainability 2020, 12, 3987. [Google Scholar] [CrossRef]
- Li, Q.K.; Lin, H.; Tan, X.; Du, S. H∞ consensus for multiagent-based supply chain systems under switching topology and uncertain demands. IEEE Trans. Syst. Man Cybern. Syst. 2018, 50, 4905–4918. [Google Scholar] [CrossRef]
- Oelze, N.; Brandenburg, M.; Jansen, C.; Warasthe, R. Applying sustainable supply chain management frameworks to two german case studies. IFAC-PapersOnLine 2018, 51, 293–296. [Google Scholar] [CrossRef]
- Council of Supply Chain Management Professionals. 2013. Available online: www.cscmp.org (accessed on 15 September 2020).
- Council of Supply Chain Management Professionals. 2021. Available online: www.cscmp.org (accessed on 12 July 2023).
- Mastrocinque, E.; Ramírez, F.J.; Honrubia-Escribano, A.; Pham, D.T. Industry 4.0 enabling sustainable supply chain development in the renewable energy sector: A multi-criteria intelligent approach. Technol. Forecast. Soc. Chang. 2022, 182, 121813. [Google Scholar] [CrossRef]
- Soni, U.; Vaishnavi, A. Analyzing Risk in Dynamic Supply Chains Using Hybrid Fuzzy AHP Model. In Applications of Artificial Intelligence Techniques in Engineering: SIGMA 2018; Springer: Singapore, 2019; Volume 2, pp. 411–420. [Google Scholar]
- Tsai, F.M.; Bui, T.D.; Tseng, M.L.; Ali, M.H.; Lim, M.K.; Chiu, A.S. Sustainable supply chain management trends in world regions: A data-driven analysis. Resour. Conserv. Recycl. 2021, 167, 105421. [Google Scholar] [CrossRef]
- Elkington, J. 25 years ago I coined the phrase “triple bottom line.” Here’s why it’s time to rethink it. Har. Biz. Rev. 2018, 25, 2–5. [Google Scholar]
- Hammer, J.; Pivo, G. The triple bottom line and sustainable economic development theory and practice. Econ. Dev. Q. 2017, 31, 25–36. [Google Scholar] [CrossRef]
- Braccini, A.M.; Margherita, E.G. Exploring organizational sustainability of industry 4.0 under the triple bottom line: The case of a manufacturing company. Sustainability 2018, 11, 36. [Google Scholar] [CrossRef]
- Agrawal, S.; Singh, R.K. Analyzing disposition decisions for sustainable reverse logistics: Triple Bottom Line approach. Resour. Conserv. Recycl. 2019, 150, 104448. [Google Scholar] [CrossRef]
- Shou, Y.; Shao, J.; Lai, K.H.; Kang, M.; Park, Y. The impact of sustainability and operations orientations on sustainable supply management and the triple bottom line. J. Clean. Prod. 2019, 240, 118280. [Google Scholar] [CrossRef]
- Xu, J.; Yang, Z.; Wang, Z.; Li, J.; Zhang, X. Flexible sensing enabled packaging performance optimization system (FS-PPOS) for lamb loss reduction control in E-commerce supply chain. Food Control 2023, 145, 109394. [Google Scholar] [CrossRef]
- Adesiji, G.B.; Joseph, J.K.; Gunu, U.; Awoyemi, A.O.; Adelowo, J.Y. Contributions of rice entrepreneurial activities to sustainable livelihood assets of rice farmers in Kwara state, Nigeria. SVU-Int. J. Agric. Sci. 2022, 4, 1–9. [Google Scholar] [CrossRef]
- Birkel, H.; Müller, J.M. Potentials of industry 4.0 for supply chain management within the triple bottom line of sustainability–A systematic literature review. J. Clean. Prod. 2021, 289, 125612. [Google Scholar] [CrossRef]
- Zimon, D.; Tyan, J.; Sroufe, R. Drivers of sustainable supply chain management: Practices to alignment with UN sustainable development goals. Int. J. Q. Res. 2020, 14, 219–236. [Google Scholar] [CrossRef]
- Jia, F.; Zuluaga-Cardona, L.; Bailey, A.; Rueda, X. Sustainable supply chain management in developing countries: An analysis of the literature. J. Clean. Prod. 2018, 189, 263–278. [Google Scholar] [CrossRef]
- Bhole, G.P.; Deshmukh, T. Multi-criteria decision making (MCDM) methods and its applications. Int. J. Res. Appl. Sci. Eng. Technol. 2018, 6, 899–915. [Google Scholar] [CrossRef]
- Kamari, M.A.; Isvand, H.; Nazari, M.L. Applications of multi-criteria decision-making (MCDM) methods in renewable energy development: A review. Renew. Energy Res. Appl. 2020, 1, 47–54. [Google Scholar]
- Bello, A.O.; Adegun, A.; Eze, S.C.; Alao, E.M.; Gbadamosi, B. Supply chain management: Risk assessment in automotive industry using Fuzzy-AHP model. Int. J. Mech. Eng. Technol. 2018, 9, 552–562. [Google Scholar]
- Sustainable Rice Platform Performance (SRP). The SRP Standard for Sustainable Rice Cultivation (Version 2.1) Bangkok. 2022. Available online: https://www.sustainablerice.org/Resources/#srp-standard (accessed on 13 February 2022).
- Mishra, A.K.; Pede, V.O.; Arouna, A.; Labart, R.; Andrade, R.; Veettil, P.C.; Bouman, B. Helping feed the world with rice innovations: CGIAR research adoption and socioeconomic impact on farmers. Glob. Food Sec. 2022, 33, 100628. [Google Scholar] [CrossRef]
Figure 1.
Conceptualization of research.
Figure 1.
Conceptualization of research.
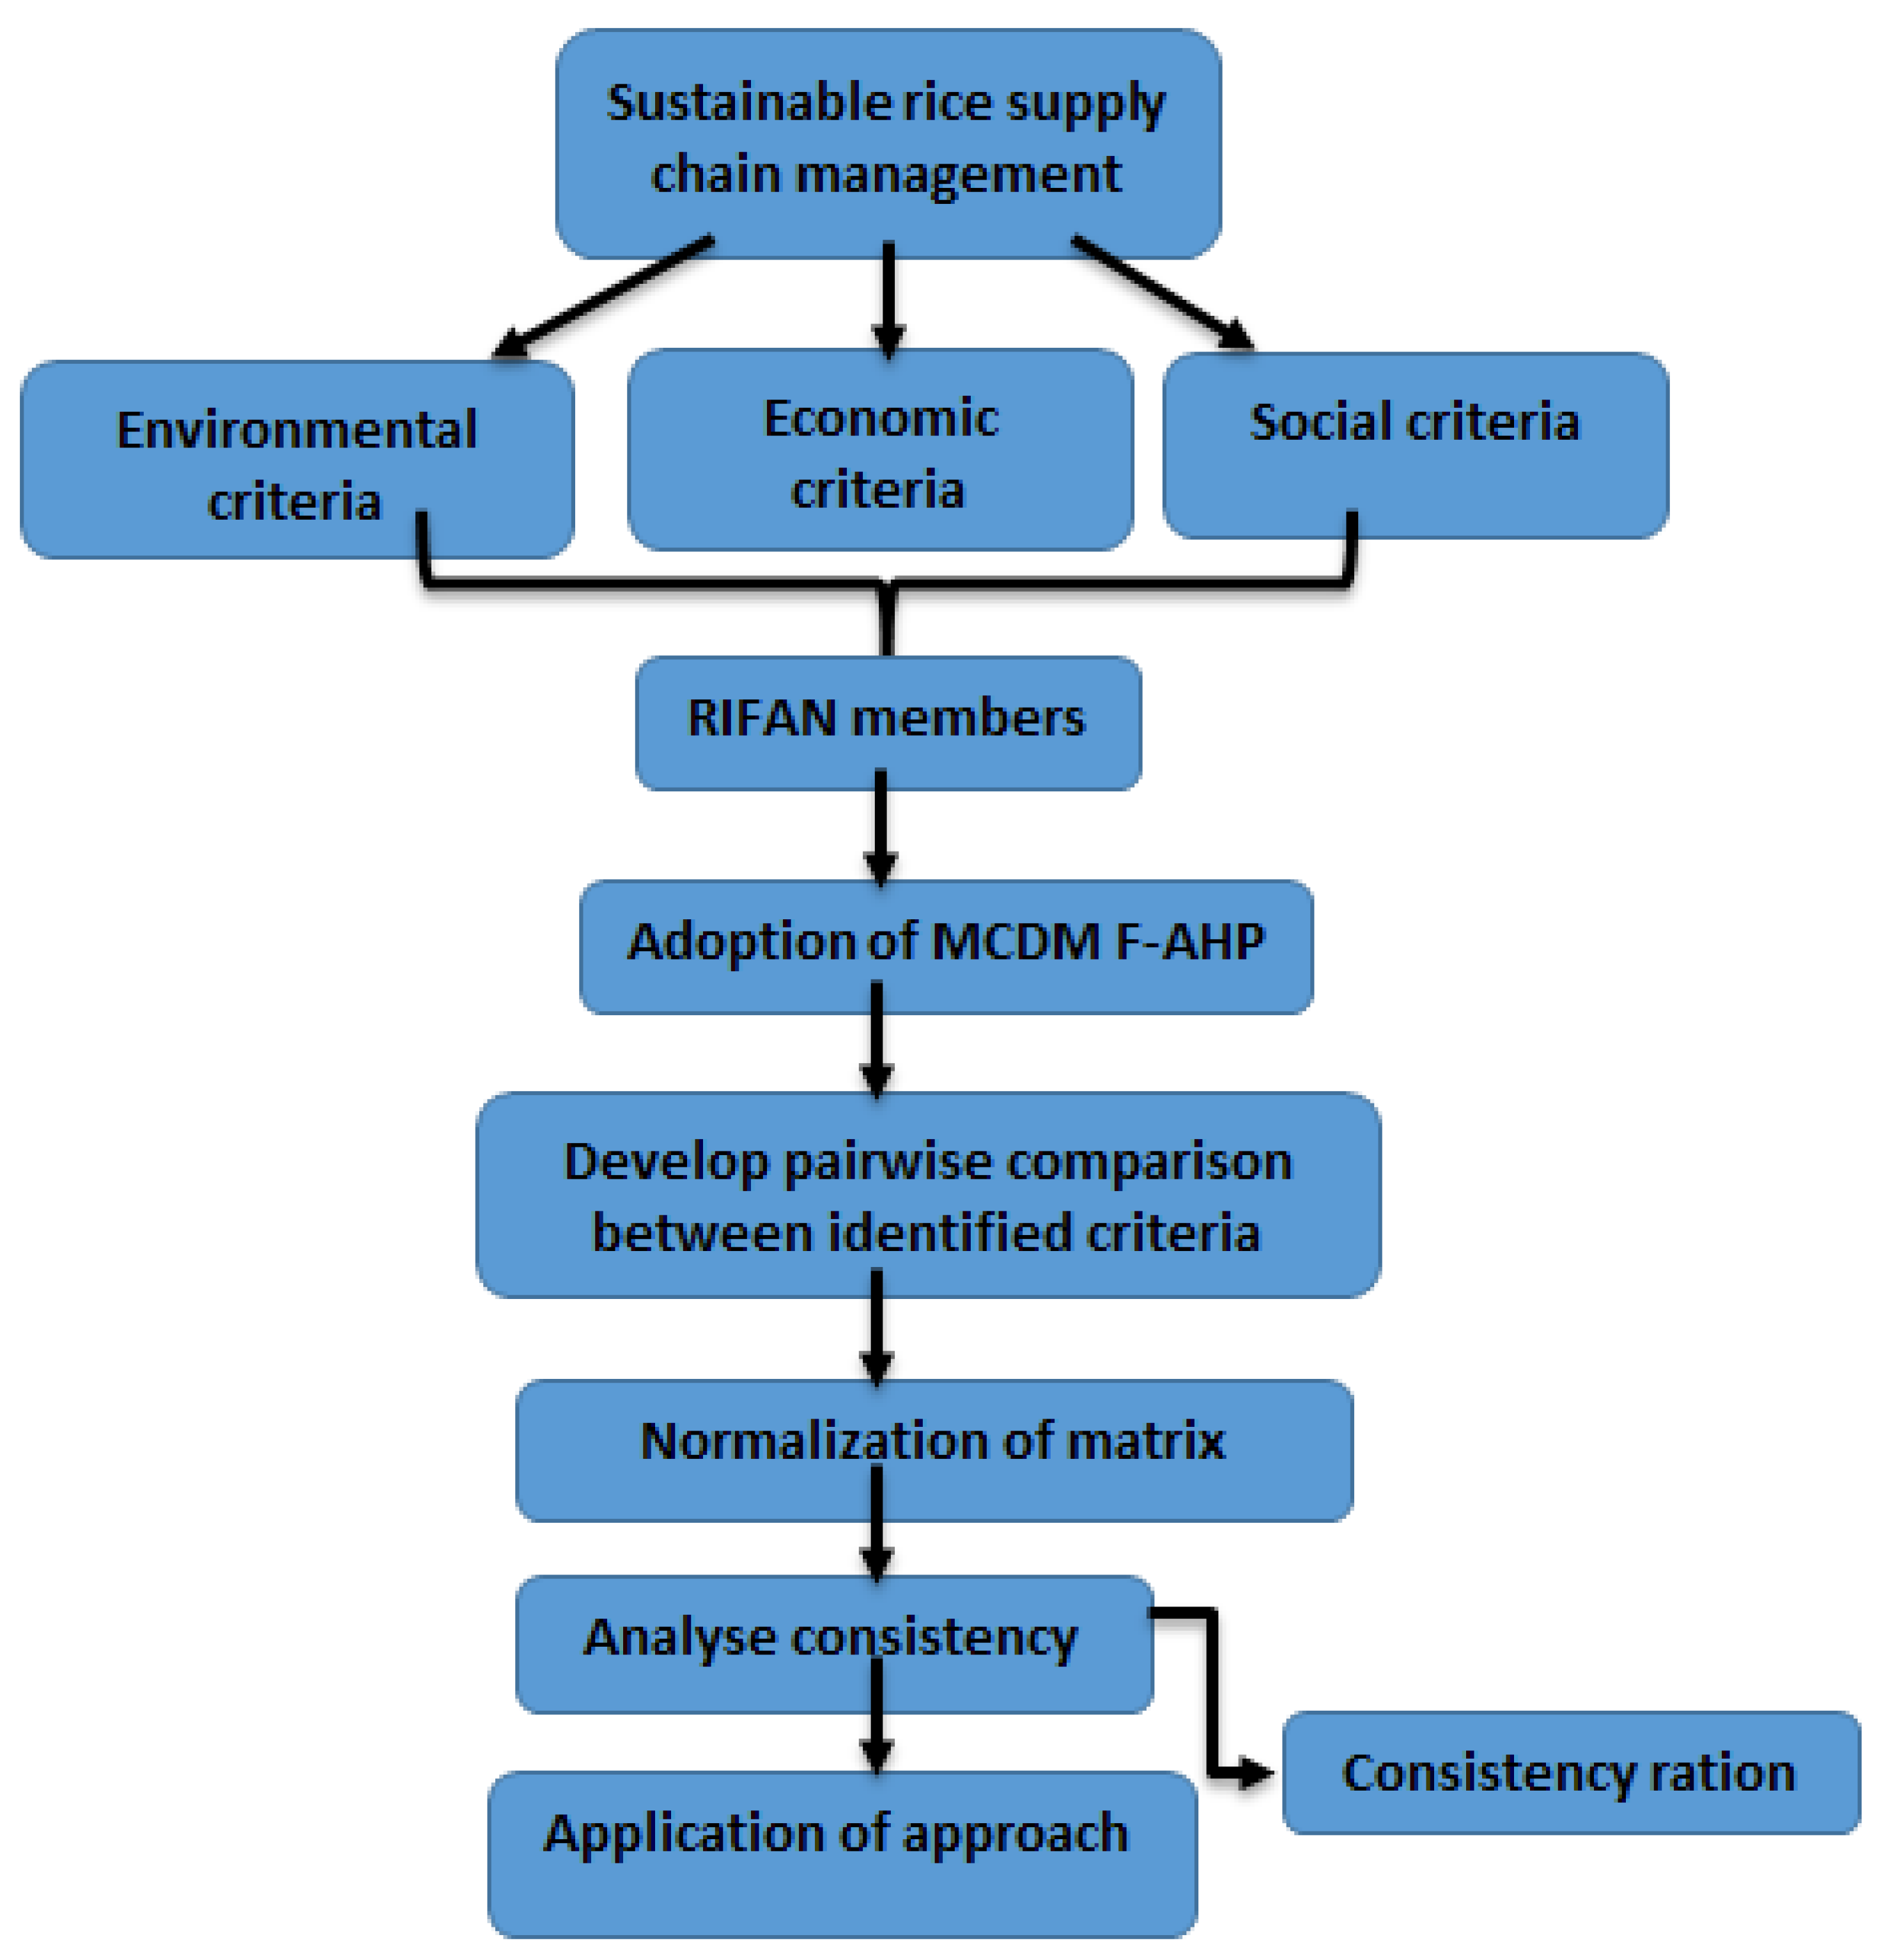
Figure 2.
Triangular fuzzy [34].
Triangular fuzzy [34].
Figure 2.
Triangular fuzzy [34].
Triangular fuzzy [34].
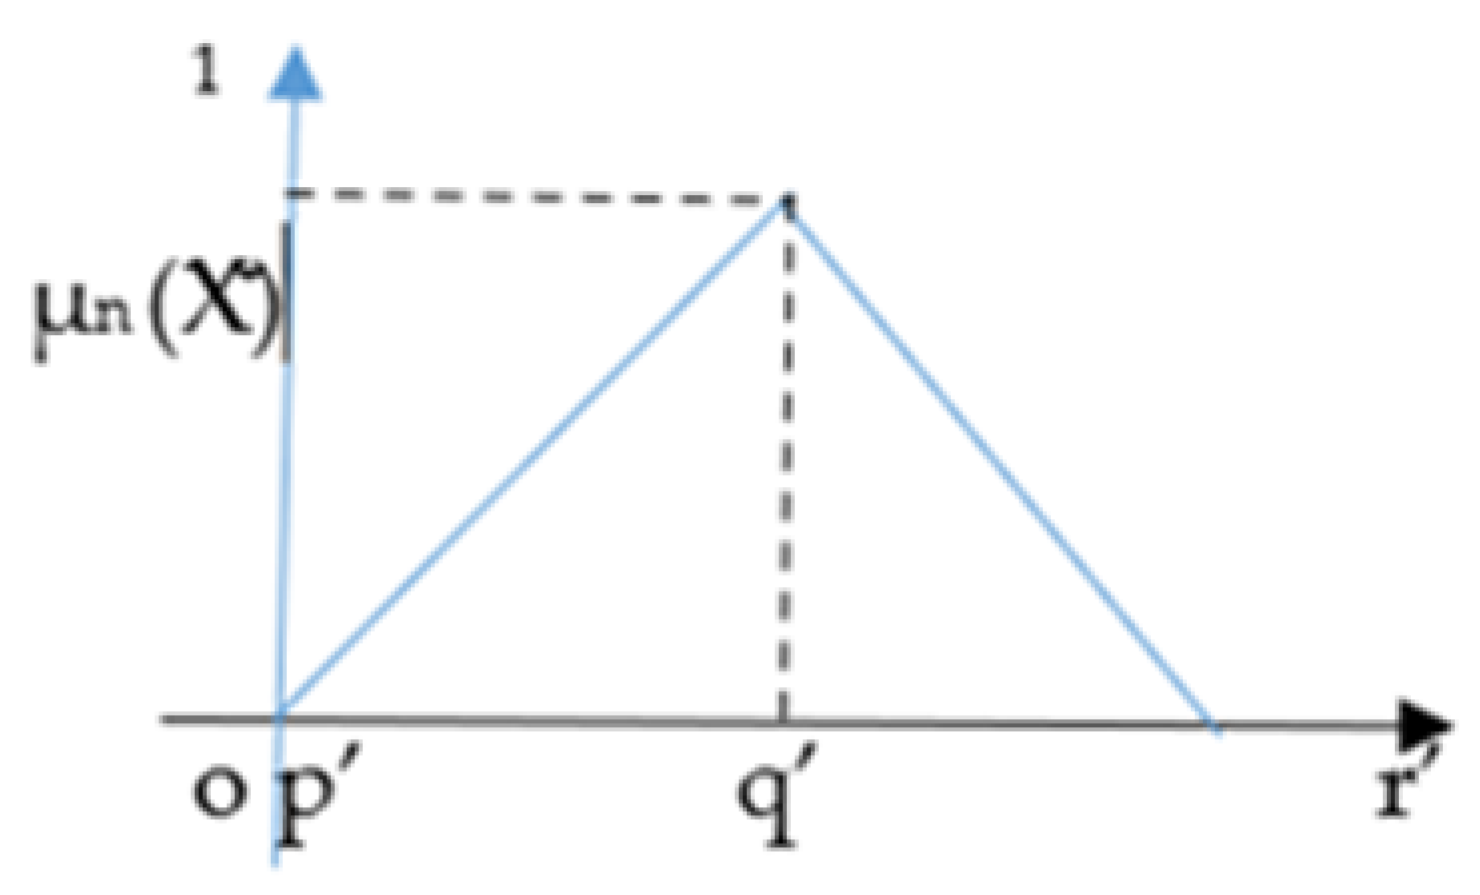
Figure 3.
SRP indicators.
Figure 3.
SRP indicators.
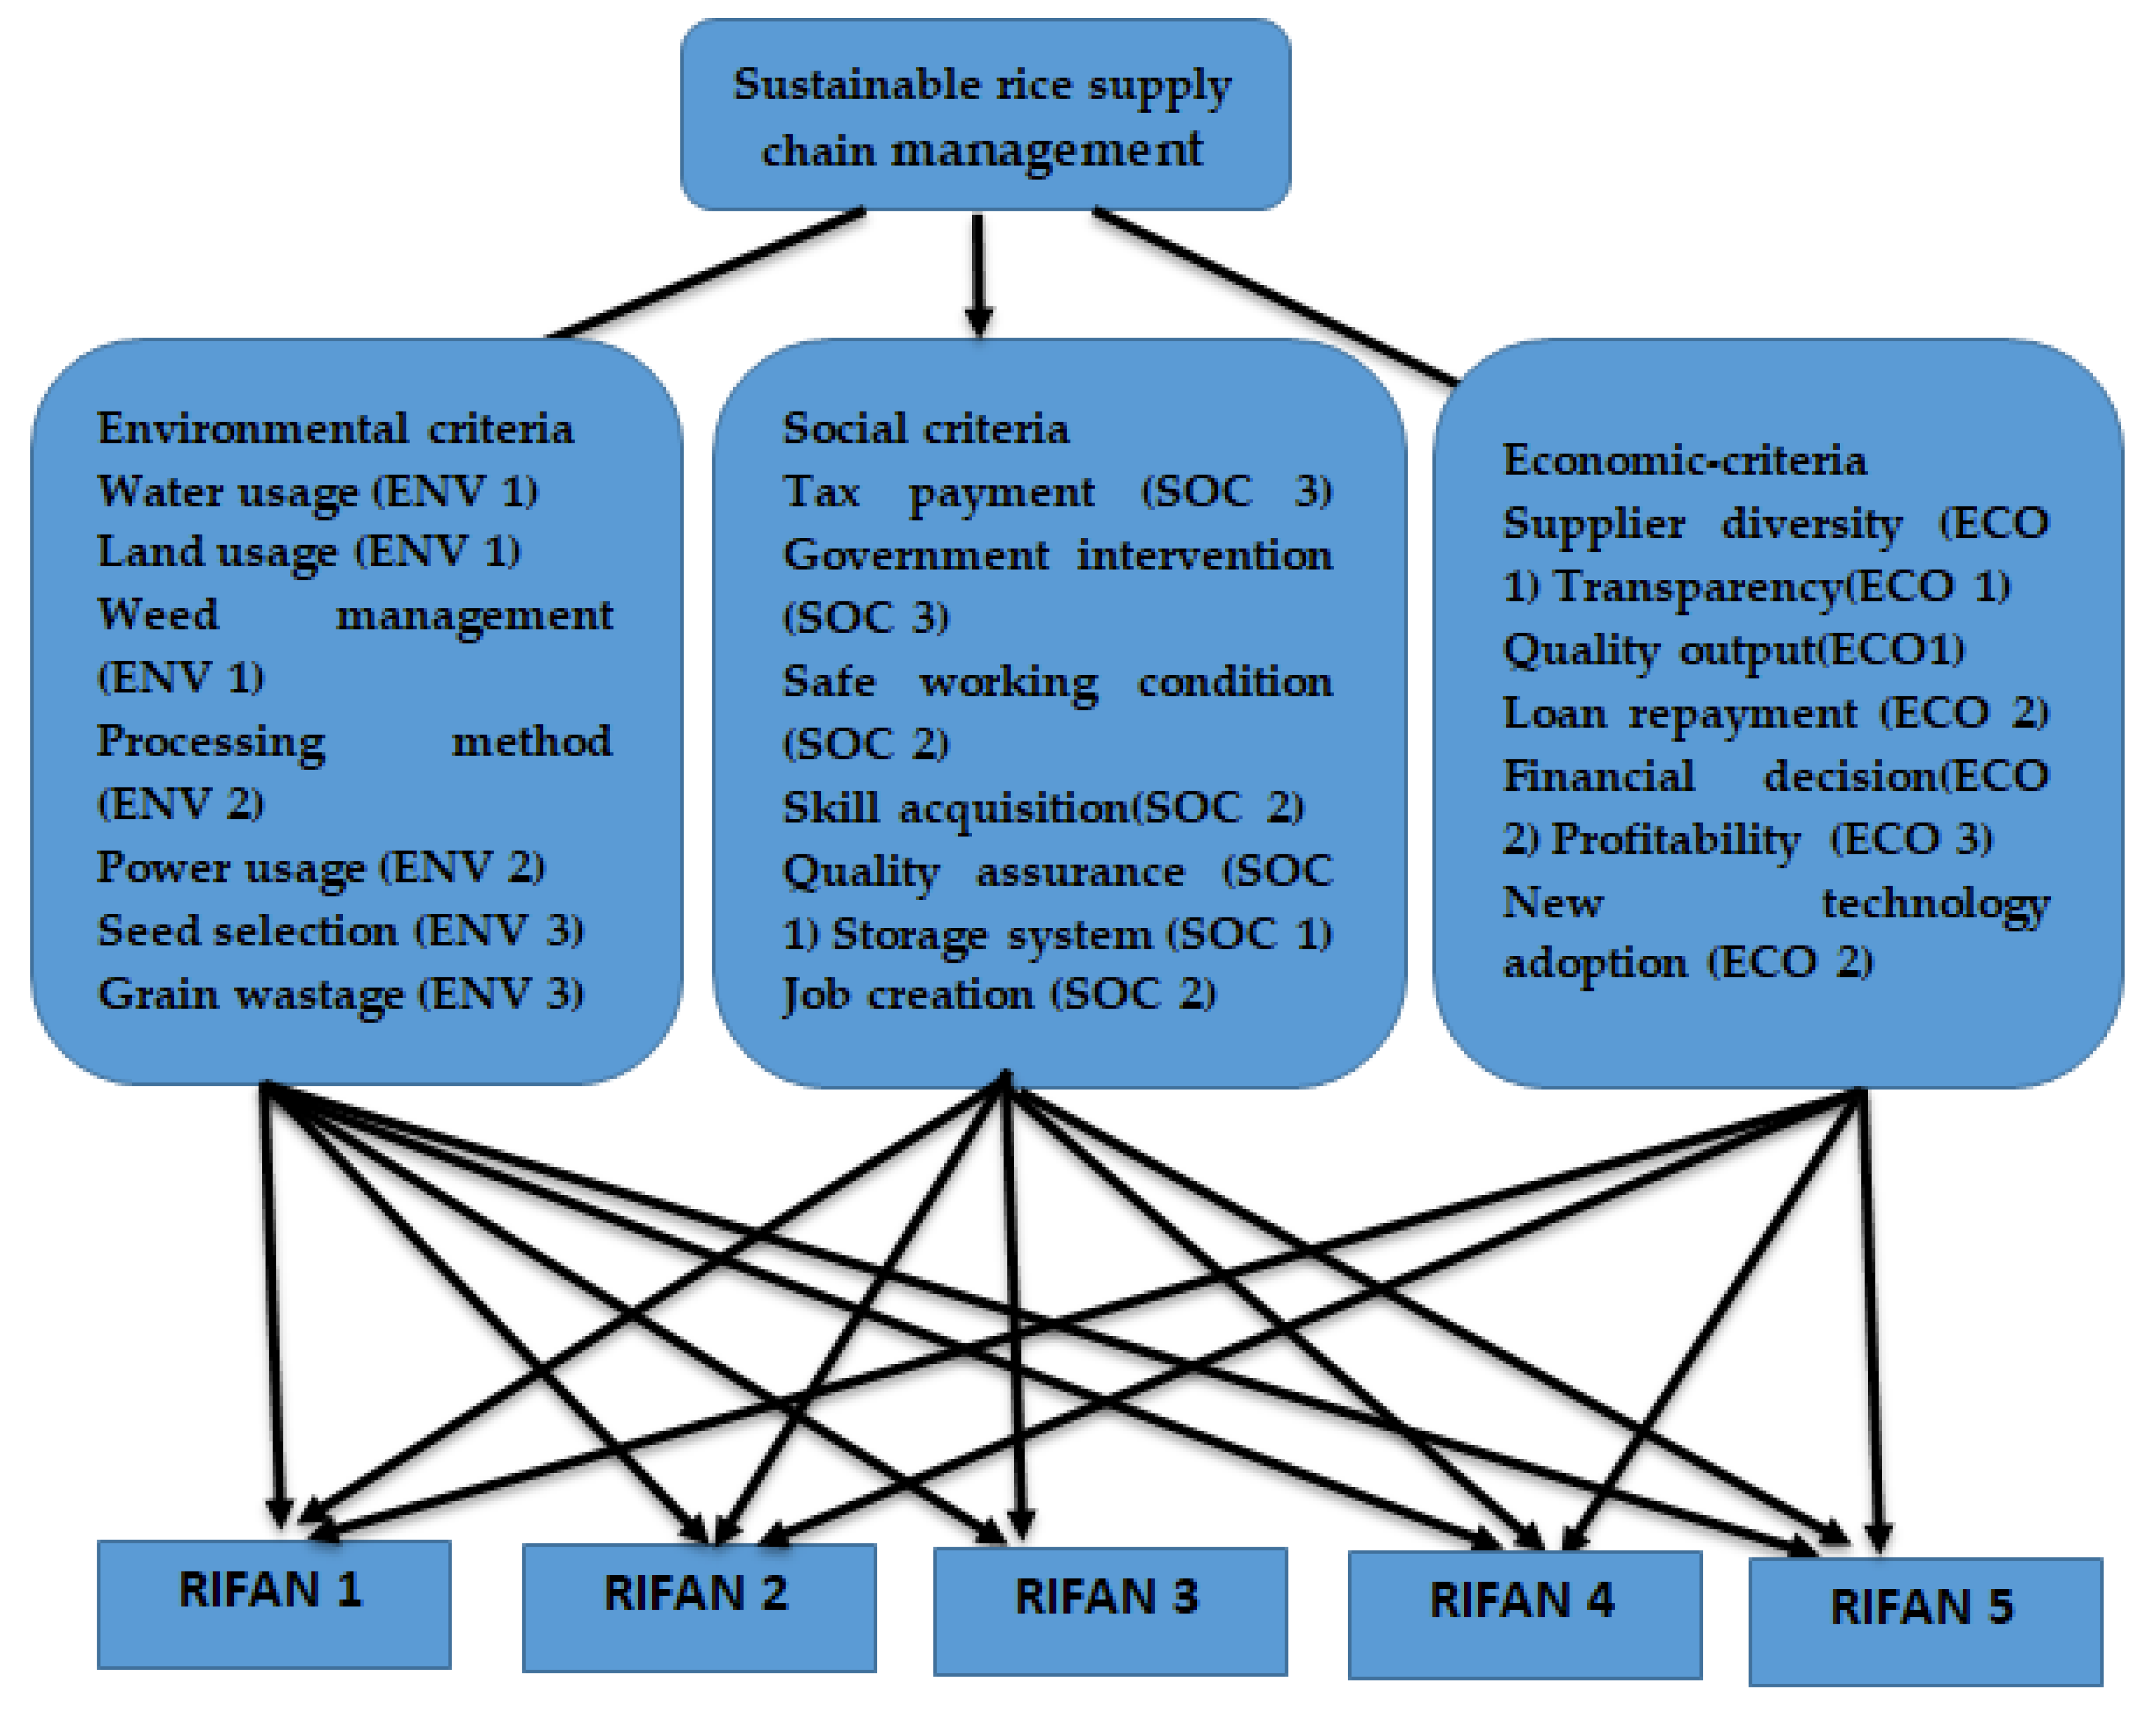
Table 1.
Assessment, standard values, corresponding triangular fuzzy numbers, and the inverse values.
Table 1.
Assessment, standard values, corresponding triangular fuzzy numbers, and the inverse values.
| Definition | Standard Values | Fuzzy Number | Inverse Values of the Fuzzy Number |
|---|---|---|---|
| Disagree | 1 | 1, 1, 1 | 1/1, 1/1, 1/1 |
| Slightly agree | 3 | 1, 3, 5 | 1/5, 1/3, 1/1 |
| Agree | 5 | 3, 5, 7 | 1/7, 1/5, 1/3 |
| Strongly agree | 7 | 5, 7, 9 | 1/9, 1/7, 1/5 |
| Extremely agree | 9 | 7, 9, 11 | 1/11, 1/9, 1/7 |
| Intermediate values | 2, 4, 6, 8 | (1, 2, 4), (3, 4, 5) (5, 6, 7) (7, 8, 9) | (1/4, 1/2, 1/1), (1/5, 1/4, 1/3), (1/7, 1/6, 1/5), (1/9, 1/8, 1/7) |
Table 2.
Corresponding assessment using the Satty scale and Triangular fuzzy scale.
Table 2.
Corresponding assessment using the Satty scale and Triangular fuzzy scale.
| Assessment | Weighting | Importance Intensity (Satty Scale) | Triangular Fuzzy Scale | Triangular Fuzzy Reciprocal |
|---|---|---|---|---|
| Slightly Agree | 30 | 3 | 2, 3, 4 | ¼, 1/3, 1/2 |
| Agree | 50 | 5 | 4, 5, 6 | 1/6, 1/5, 1/4 |
| Slightly Agree | 30 | 3 | 2, 3, 4 | ¼, 1/3, 1/4 |
| Disagree | 10 | 1 | 1, 1, 1 | 1, 1, 1 |
| Slightly Agree | 30 | 3 | 2, 3, 4 | ¼, 1/3, 1/2 |
| Agree | 50 | 5 | 4, 5, 6 | 1/6, 1/5, 1/4 |
| Disagree | 10 | 1 | 1, 1, 1 | 1, 1, 1 |
Table 3.
Averaged weight criterion (Mi) and normalized weight criterion (Ni) of each assessment.
Table 3.
Averaged weight criterion (Mi) and normalized weight criterion (Ni) of each assessment.
| Rating | Mi | Ni | Rank |
|---|---|---|---|
| R1 | 0.048 | 0.045 | 6 |
| R2 | 0.096 | 0.089 | 4 |
| R3 | 0.167 | 0.155 | 3 |
| R4 | 0.096 | 0.089 | 4 |
| R5 | 0.239 | 0.221 | 2 |
| R6 | 0.057 | 0.053 | 5 |
| R7 | 0.377 | 0.349 | 1 |
| Total | 1.080 |
Table 4.
Overall rating of the Social criteria for the five respondents.
Table 4.
Overall rating of the Social criteria for the five respondents.
| Nodes | Criteria | Weight | Rank |
|---|---|---|---|
| SOC-1 | Quality assurance | 0.063 | 6 |
| Storage system | 0.129 | 3 | |
| SOC-2 | Job creation | 0.247 | 2 |
| Skills acquisition | 0.115 | 4 | |
| Safe working environment | 0.323 | 1 | |
| SOC-3 | Government intervention | 0.057 | 7 |
| Tax payment | 0.067 | 5 |
Table 5.
Overall rating of the Economic criteria for the five respondents.
Table 5.
Overall rating of the Economic criteria for the five respondents.
| Nodes | Criteria | Weight | Rank |
|---|---|---|---|
| ECO-1 | Supplier diversity | 0.349 | 1 |
| Transparency | 0.028 | 7 | |
| Quality input | 0.102 | 5 | |
| ECO-2 | Loan repayment | 0.049 | 6 |
| Adoption of new technology | 0.21 | 2 | |
| Financial decisions | 0.108 | 4 | |
| ECO-3 | Profitability | 0.129 | 3 |
Table 6.
Overall rating of the Environmental criteria for the five respondents.
Table 6.
Overall rating of the Environmental criteria for the five respondents.
| Nodes | Criteria | Weight | Rank |
|---|---|---|---|
| ENV-1 | Water Usage | 0.349 | 1 |
| Land usage | 0.168 | 2 | |
| Weed management | 0.128 | 4 | |
| ENV-2 | Processing method | 0.140 | 3 |
| ENV-3 | Power usage | 0.055 | 6 |
| Grain wastage | 0.049 | 7 | |
| Seed selection | 0.082 | 5 |
|
Disclaimer/Publisher’s Note: The statements, opinions and data contained in all publications are solely those of the individual author(s) and contributor(s) and not of MDPI and/or the editor(s). MDPI and/or the editor(s) disclaim responsibility for any injury to people or property resulting from any ideas, methods, instructions or products referred to in the content. |
[ad_2]