JPM | Free Full-Text | Clinical and Epidemiological Study of IgA Nephropathy in the Bulgarian Population: Insights into Disease Presentation and Potential Biomarkers
Figure 1.
Population Pyramid Frequency age group by sex.
Figure 1.
Population Pyramid Frequency age group by sex.
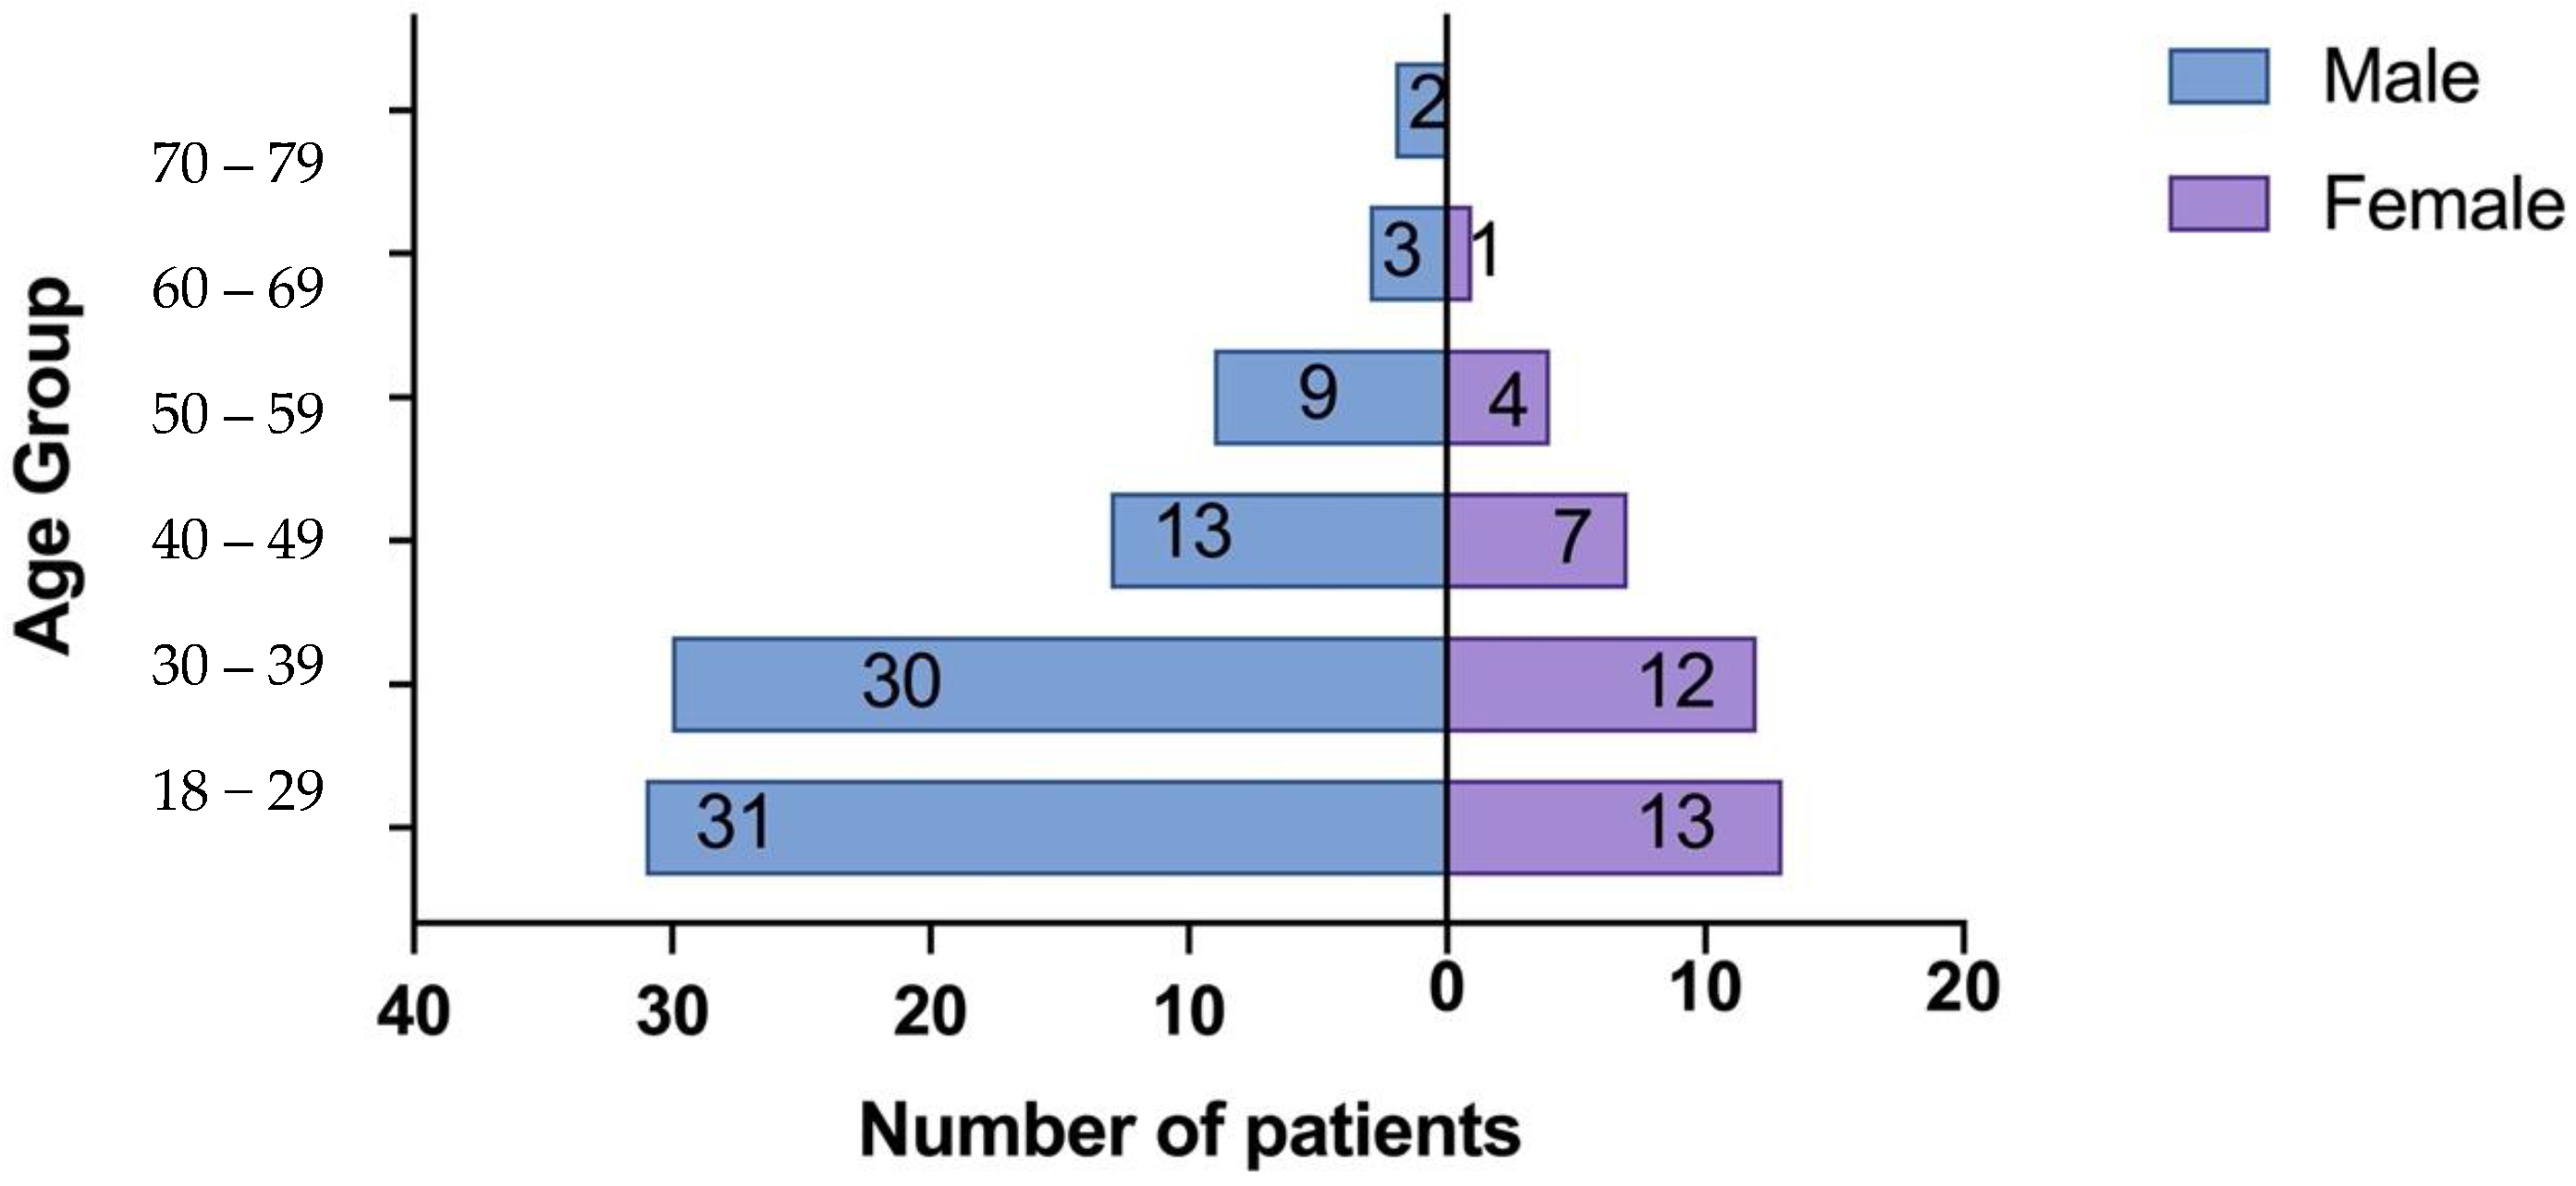
Figure 2.
Percentage distribution of pathologic features in 125 kidney biopsies according to the Oxford classification. MEST-C, Oxford classification system; M1, mesangial hypercellularity; E1, endocapillary hypercellularity; S1, segmental glomerulosclerosis; T1/2, tubular atrophy, and interstitial fibrosis >25%; C 1/2, crescent in at least one glomerulus.
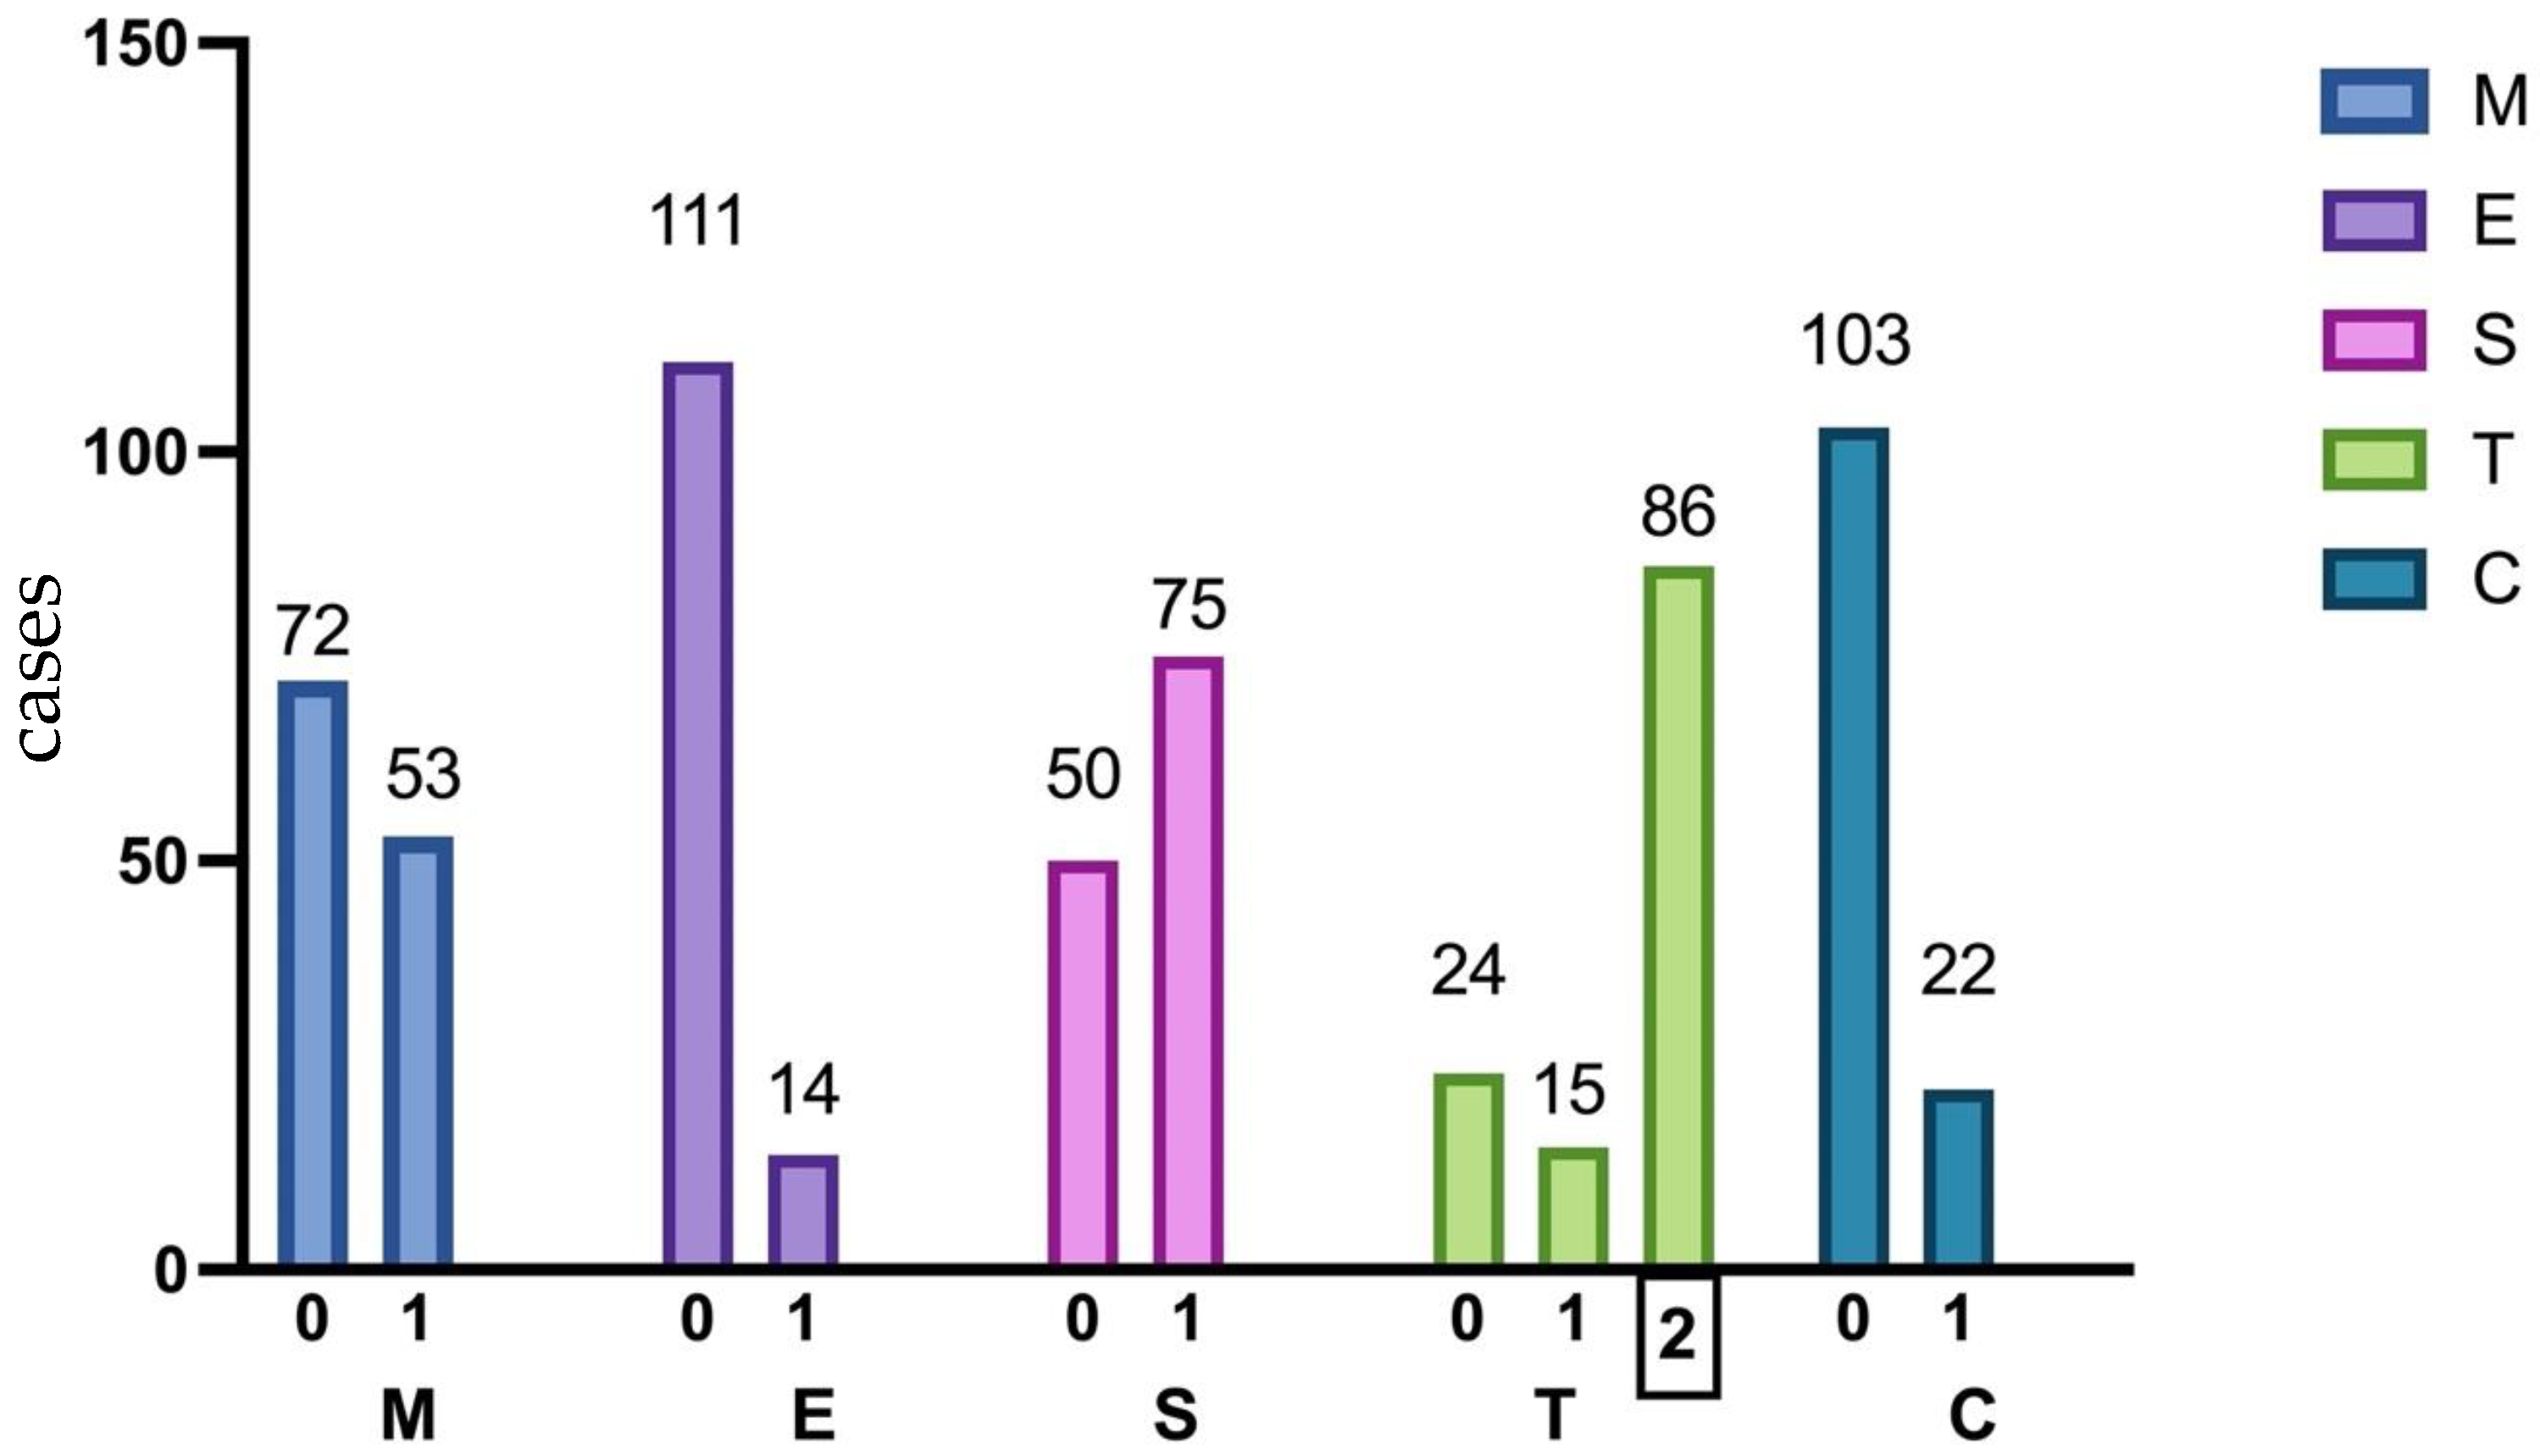
Figure 3.
Serum levels of IgA, Gd-IgA1, IgA/C3, and the Gd-IgA1/IgA ratio in IgAN patients and healthy controls. (A) Serum levels of IgA in IgAN patients and healthy controls. (B) Serum levels of Gd-IgA1 in IgAN patients and healthy controls. (C) IgA/C3 ratio in IgAN patients and healthy controls. (D) Gal-deficient IgA1/IgA ratio in IgAN patients and healthy controls. Gd-IgA1, galactose-deficient IgA1; IgAN, IgA nephropathy.
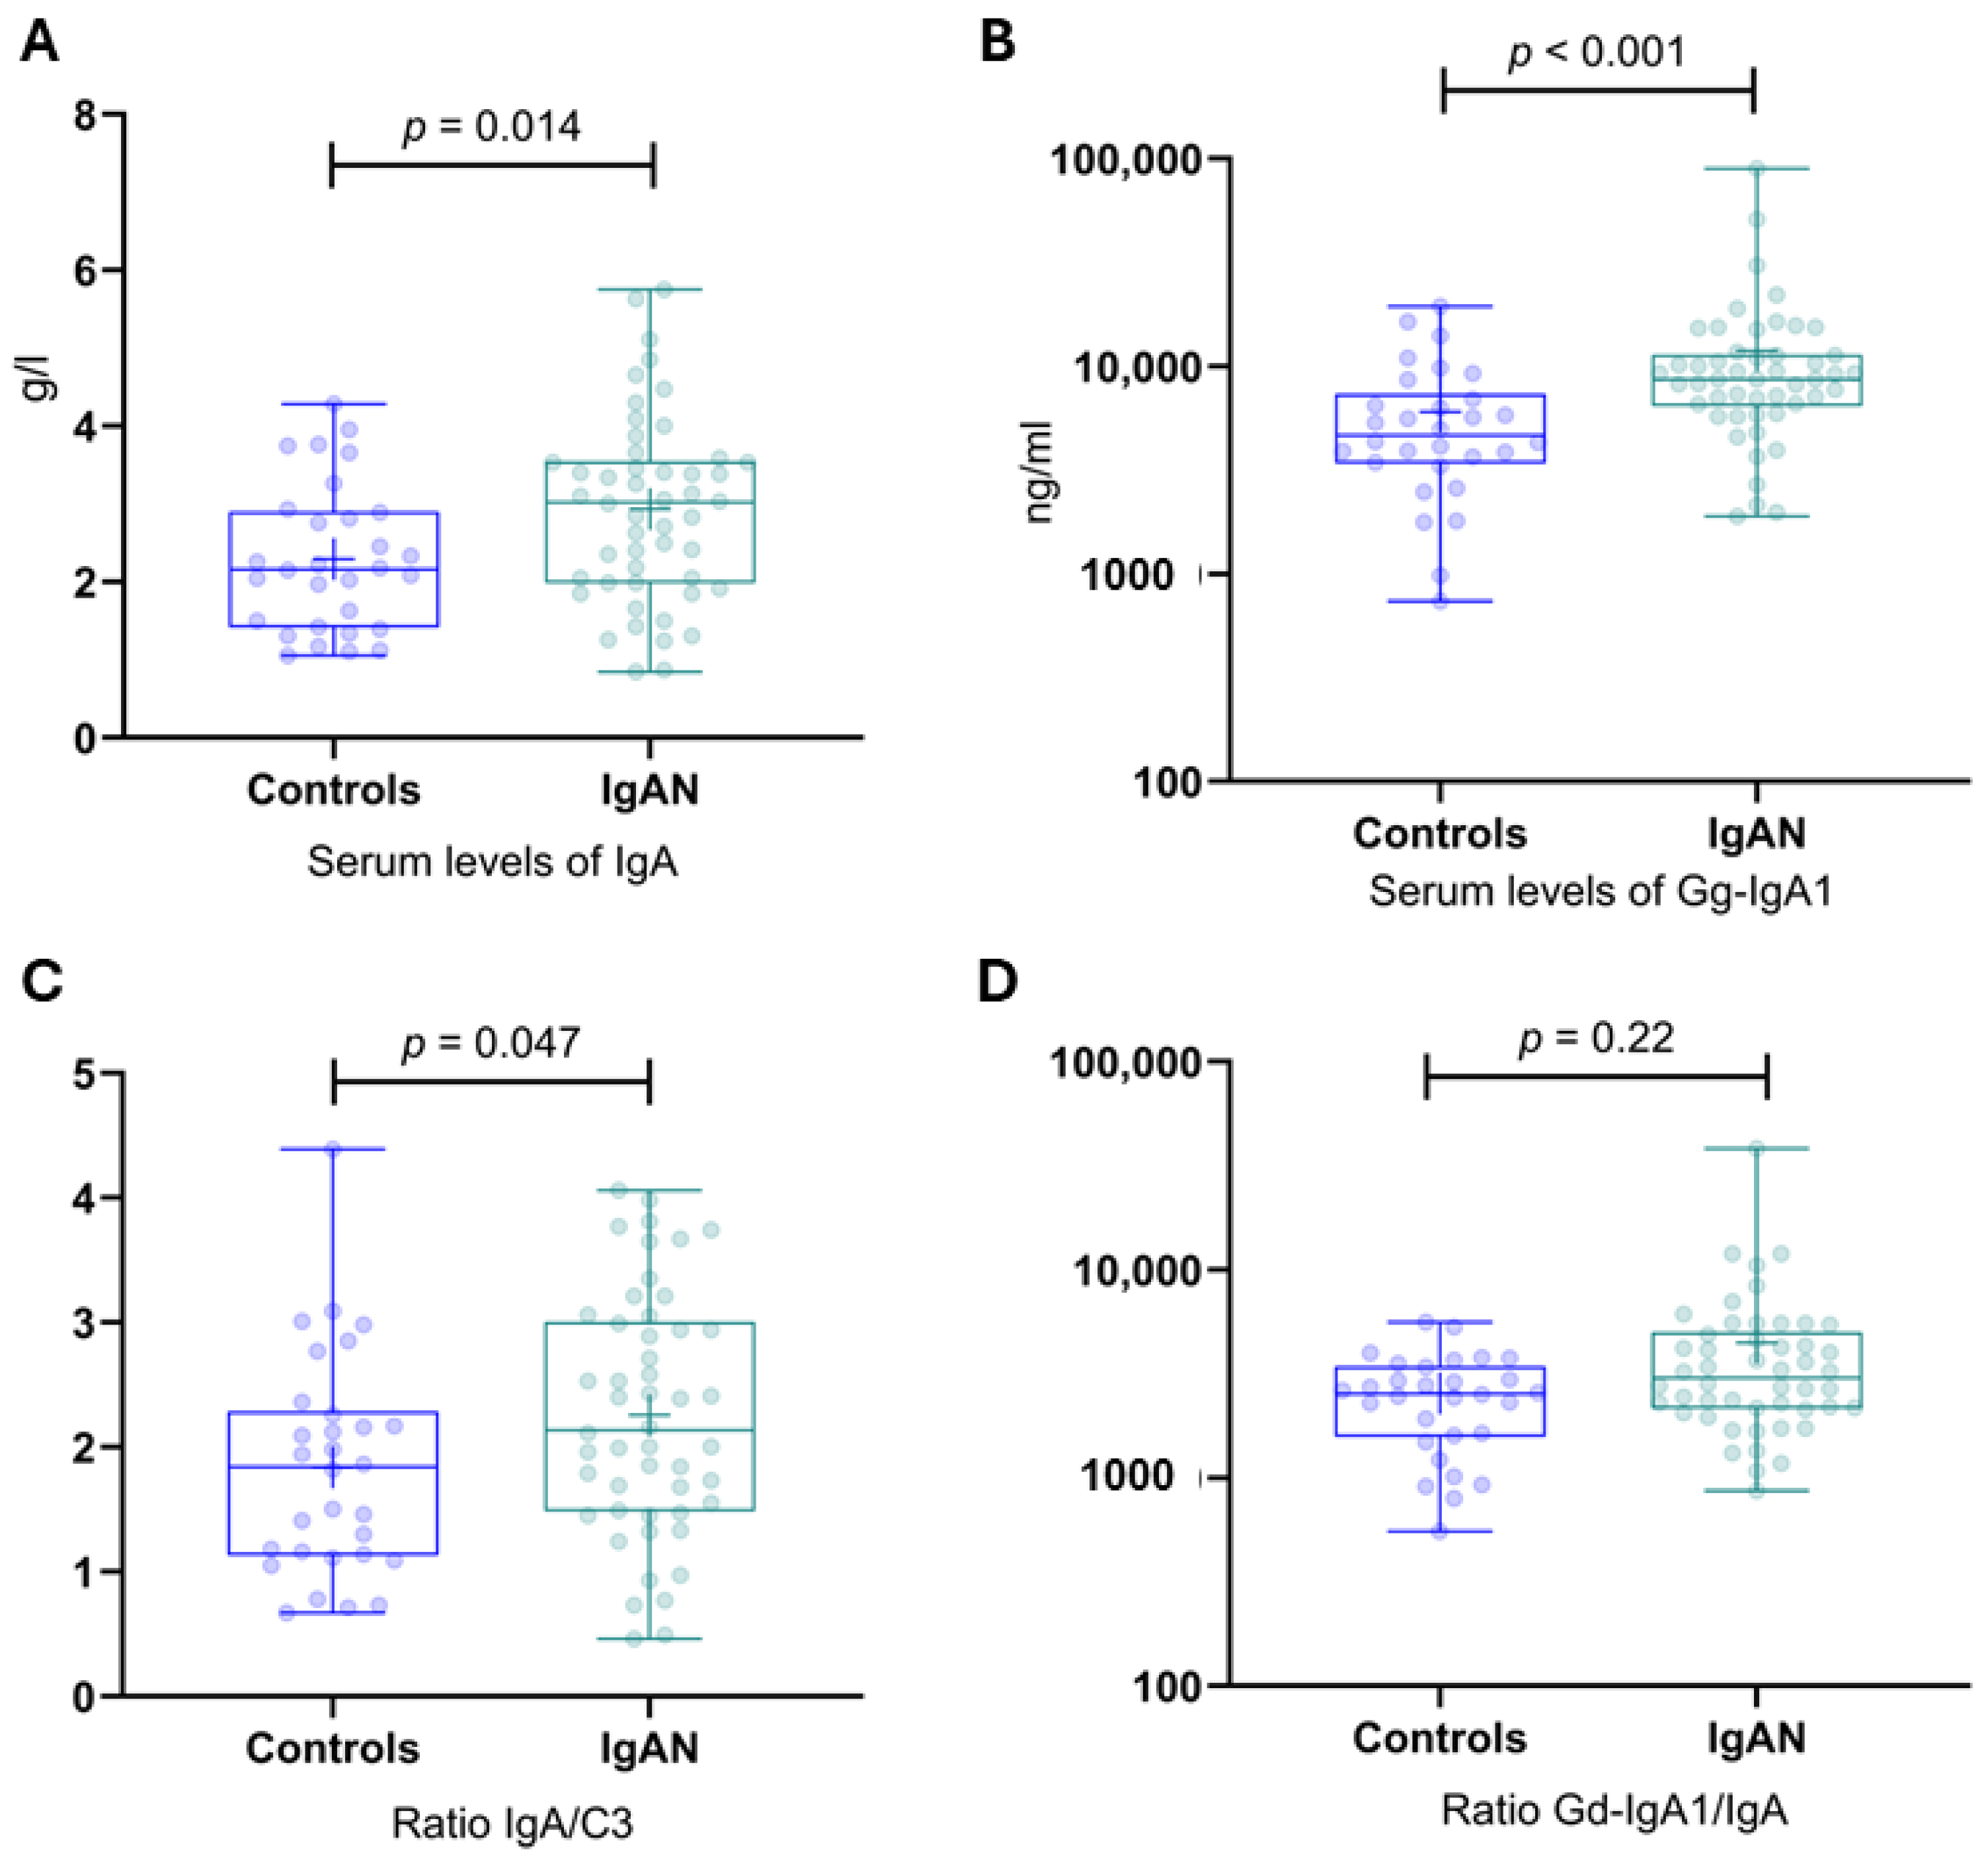
Figure 4.
Serum levels of BAFF, C3, APRIL in IgAN patients and healthy controls. (A) Serum levels of BAFF in IgAN patients and healthy controls. (B) Serum levels of C3 in IgAN patients and healthy controls. (C) Serum levels of APRIL in IgAN patients and healthy controls. BAFF, B-cell activating factor; IgAN, immunoglobulin A nephropathy; APRIL, a proliferation-inducing ligand; IgAN, immunoglobulin A nephropathy.
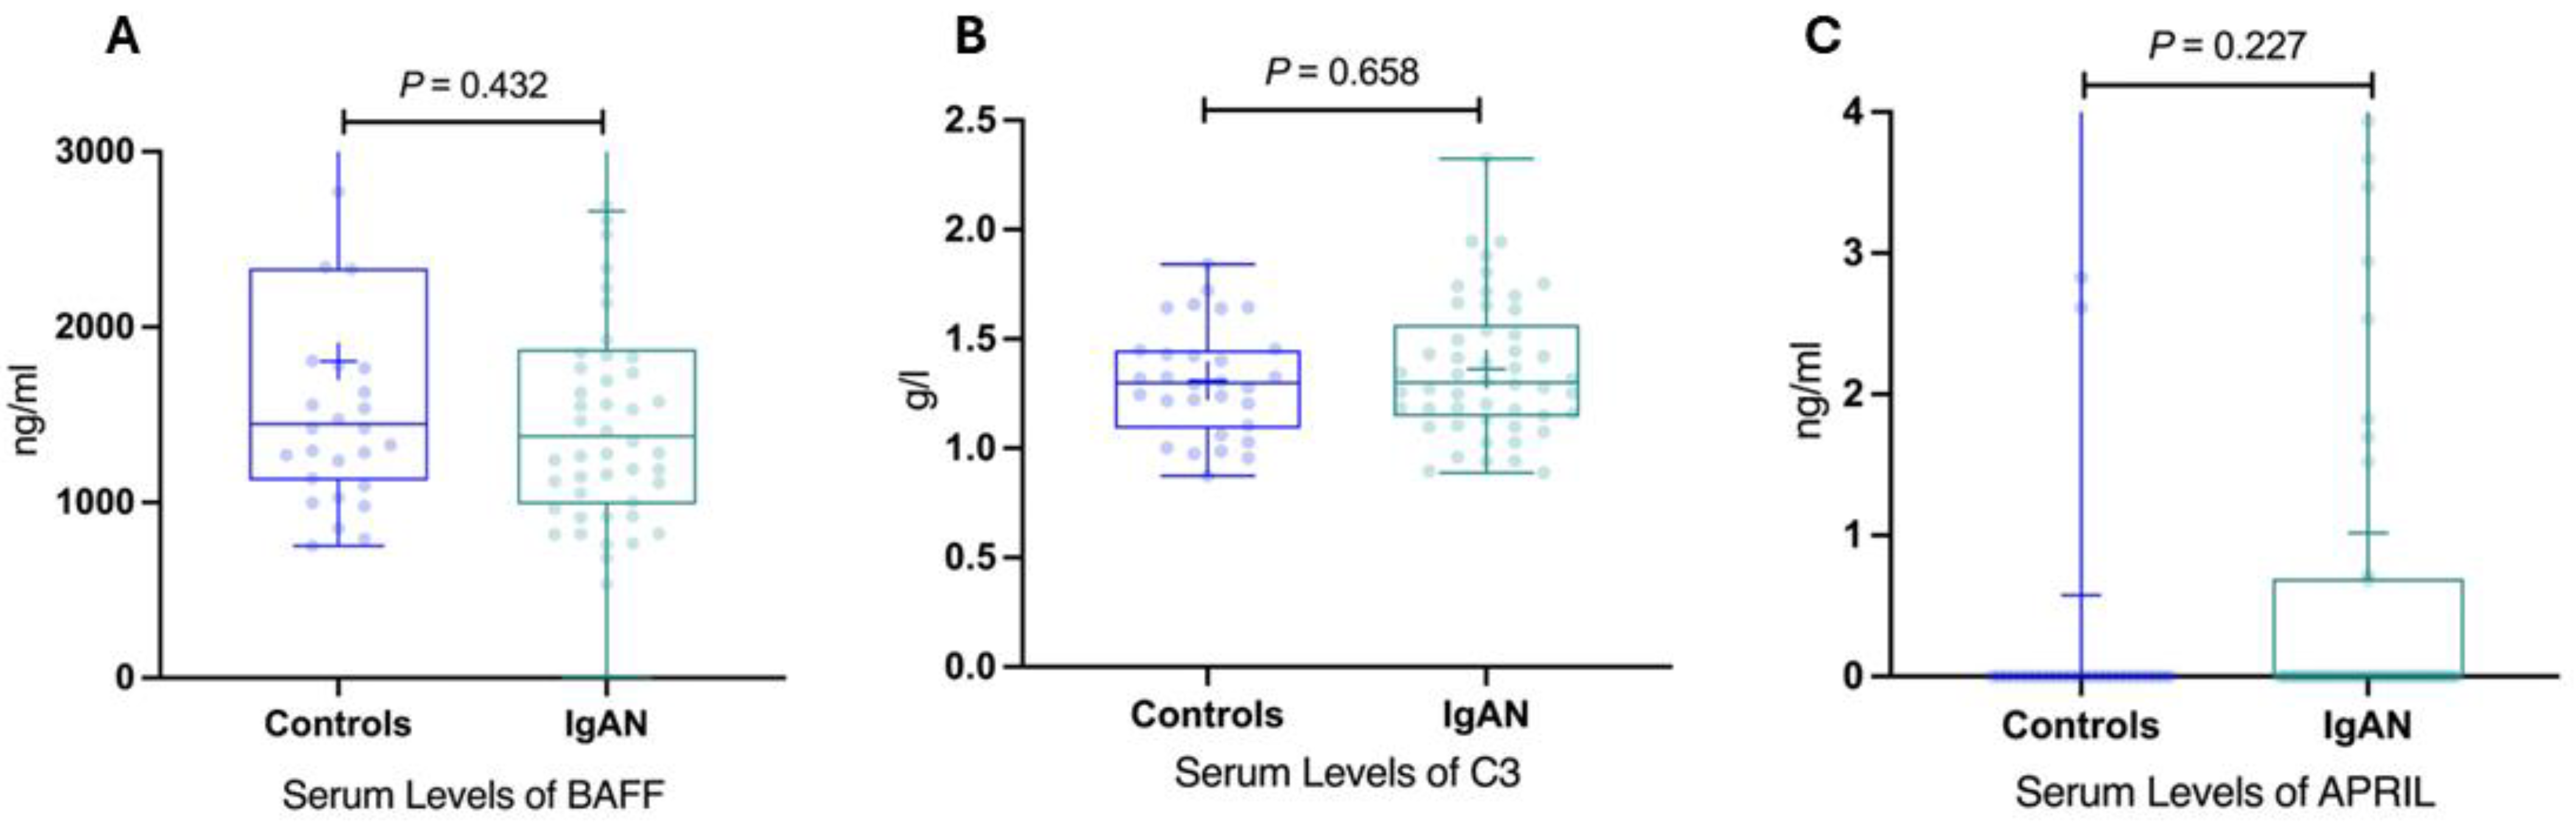
Figure 5.
Receiver operating characteristic curve for Gd-IgA1 levels. The area under the curve is 0.747. Gd-IgA1, galactose-deficient IgA1.
Figure 5.
Receiver operating characteristic curve for Gd-IgA1 levels. The area under the curve is 0.747. Gd-IgA1, galactose-deficient IgA1.
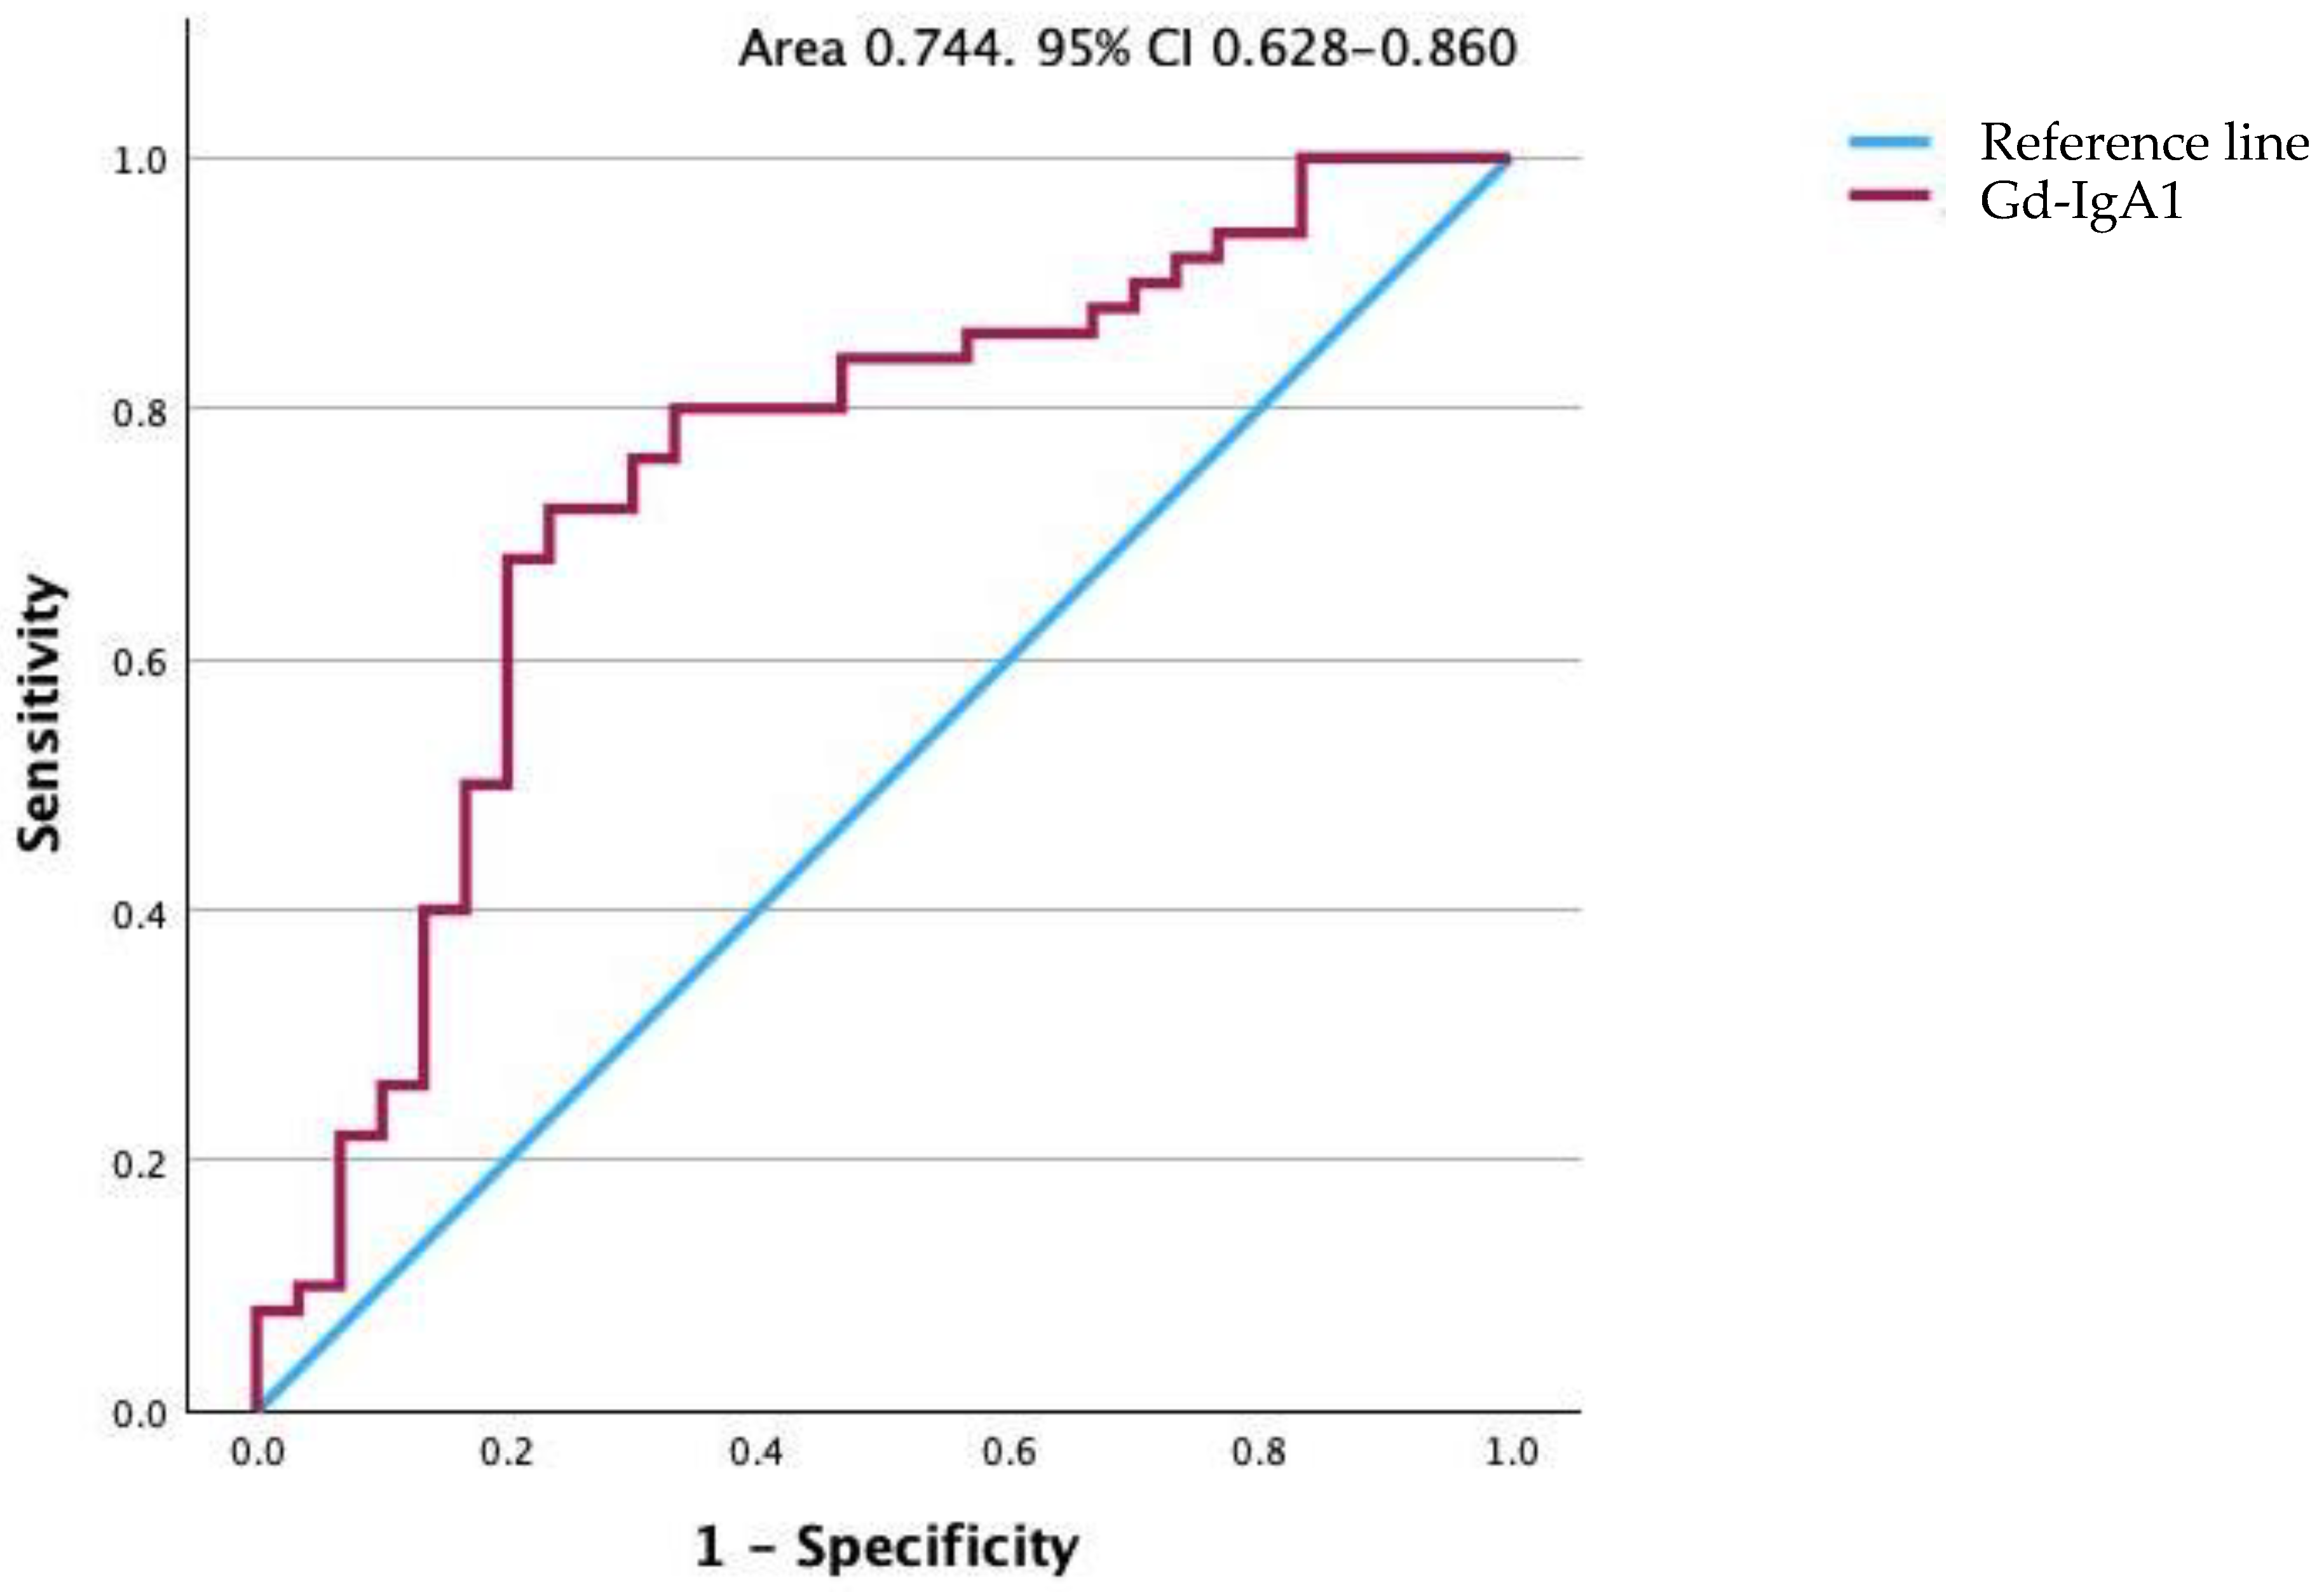
Table 1.
Baseline clinical and laboratory profile of patients at the time of biopsy.
Table 1.
Baseline clinical and laboratory profile of patients at the time of biopsy.
| Total Patients (n = 125) | |
|---|---|
| Age (yrs) (Mean ± SD) | 35.94 ± 11.91 |
| Gender (M:F) (n) | 88:37 |
| Hb (g/L) (Mean ± SD) | 141.37 ± 19.49 |
| Cholesterol (mmol/L) (Mean ± SD) | 5.17 ± 1.45 |
| Triglyceride (mmol/L) (Mean ± SD) | 1.43 ± 0.78 |
| Serum uric acid (μmol/L) (Mean ± SD) | 373.7 ± 112.91 |
| Serum protein (g/L) (Mean ± SD) | 69.58 ± 6.69 |
| Serum albumin (g/L) (Mean ± SD) | 42.03 ± 5.49 |
| Hematuria microscopic * (n) | |
| + | 62 |
| ++ | 12 |
| +++ | 46 |
| Hematuria macroscopic (episodes) | 50 |
| Urinary protein (g/day) (Mean ± SD) | 1.34 ± 1.16 |
| Serum creatinine (μmol/L) (Mean ± SD) | 125.71 ± 67.83 |
| eGFR (mL/min/1.73 m2) (Mean ± SD) | 61.78 ± 27.72 |
| CKD stage on the time of biopsy | |
| 1 | 21 |
| 2 | 40 |
| 3a | 26 |
| 3b | 23 |
| 4 | 13 |
| 5 | 2 |
| Timeframe to biopsy | 24.22 ± 32.9 |
| Follow up duration | 69.60 ± 22.19 |
Table 2.
Odds ratio and 95% confidence interval of parameters studied as factors for the occurrence of disease progression based on eGFR over the years.
Table 2.
Odds ratio and 95% confidence interval of parameters studied as factors for the occurrence of disease progression based on eGFR over the years.
| Risk Factors | Range | Individually | Group | ||||||
|---|---|---|---|---|---|---|---|---|---|
| OR | 95% CI | p Value | OR | 95% CI | p Value | ||||
| Lower Limit | Upper Limit | Lower Limit | Upper Limit | ||||||
| Anemia (g/L) | <120 M <110 F |
3.352 | 0.986 | 11.394 | 0.053 | 3.333 | 0.978 | 11.365 | 0.054 |
| Hyperuricemia (μmol/L) | ≥420 M ≥360 F |
1.023 | 0.481 | 2.174 | 0.953 | ||||
| Cholesterol (mmol/L) | ≥5.2/<5.20 | 1.313 | 0.631 | 2.731 | 0.466 | ||||
| Triglyceride (mmol/L) | ≥1.7/<1.7 | 1.094 | 0.486 | 2.463 | 0.829 | ||||
Table 3.
Odds ratio and 95% confidence interval of the studied indicators as factors for the occurrence of disease progression based on a doubling of serum creatinine values.
Table 3.
Odds ratio and 95% confidence interval of the studied indicators as factors for the occurrence of disease progression based on a doubling of serum creatinine values.
| Risk Factors | Range | Individually | Group | ||||||
|---|---|---|---|---|---|---|---|---|---|
| OR | 95% CI | p Value | OR | 95% CI | p Value | ||||
| Lower Limit | Upper Limit | Lower Limit | Upper Limit | ||||||
| Anemia (g/L) | <120 M <110 F |
12.086 | 3.536 | 41.306 | <0.001 | 15.832 | 4.203 | 59.642 | <0.001 |
| Hyperuricemia (μmol/L) | ≥420 M ≥360 F |
2.393 | 0.952 | 6.016 | 0.064 | 3.087 | 1.031 | 9.243 | 0.044 |
| Cholesterol (mmol/L) | ≥5.2/<5.20 | 1.036 | 0.417 | 2.572 | 0.939 | ||||
| Triglyceride (mmol/L) | ≥1.7/<1.7 | 0.680 | 0.229 | 2.017 | 0.486 | ||||
Table 4.
MEST-C correlation with clinical variables: serum creatinine, hematuria, duration of complaints.
Table 4.
MEST-C correlation with clinical variables: serum creatinine, hematuria, duration of complaints.
| Clinical Variables | MEST-C [16] | ||||||
|---|---|---|---|---|---|---|---|
| <3 | ≥3 | p Value | |||||
| n | SD | n | SD | ||||
| Serum creatinine (μmol/L) | 72 | 121.63 | 61.91 | 53 | 133.62 | 75.19 | 0.560 |
| Duration of complaints | 68 | 28.11 | 36.43 | 50 | 18.92 | 25.84 | 0.126 |
| MEST-C | |||||||
| <3 | ≥3 | ||||||
| Hematuria * | Frequency | 0.937 | |||||
| + | n % |
36 50.0 |
26 49.1 |
||||
| ++ | n % |
9 12.5 |
8 15.1 |
||||
| + + + | n % |
27 37.5 |
19 35.8 |
||||
| Episode of macroscopic hematuria | n % |
42 58.3 |
33 62.3 |
0.714 | |||
Table 5.
Correlation between serum creatinine value at diagnosis and histological stage of the disease based on Haas’s classification.
Table 5.
Correlation between serum creatinine value at diagnosis and histological stage of the disease based on Haas’s classification.
| Haas Classification [18] | Serum Creatinine (μmol/L) | ||
|---|---|---|---|
| n | SD | ||
| Minimal Histological Lesion | 15 | 96.73 a | 24.93 |
| FSGS | 44 | 135.09 bc | 53.24 |
| Focal Proliferative GN | 28 | 125.71 ac | 70.74 |
| Diffuse Proliferative GN | 30 | 117.37 a | 69.32 |
| Advanced Chronic GN * | 4 | 271.25 | 132.46 |
Table 6.
Difference between serum concentration of Gd-IgA1, IgA, C3, Gd-IgA1/IgA ratio, IgA/C3 ratio, BAFF, and APRIL in healthy controls and IgAN patients.
Table 6.
Difference between serum concentration of Gd-IgA1, IgA, C3, Gd-IgA1/IgA ratio, IgA/C3 ratio, BAFF, and APRIL in healthy controls and IgAN patients.
| Variables | Groups | ||||||
|---|---|---|---|---|---|---|---|
| Controls | IgAN Patients | p Value | |||||
| n | SD | n | SD | ||||
| Gd-IgA1 | 30 | 6022.49 | 4421.79 | 50 | 11,882.38 | 1374.19 | <0.001 |
| IgA | 30 | 2.29 | 2.29 | 50 | 2.93 | 1.18 | 0.014 |
| C3 | 30 | 1.31 | 1.31 | 50 | 1.36 | 0.31 | 0.658 |
| Gd-IgA1/IgA | 30 | 2552.91 | 2551.91 | 50 | 4458.26 | 5486.84 | 0.022 |
| IgA/C3 | 30 | 1.84 | 0.87 | 50 | 2.26 | 0.97 | 0.047 |
| BAFF | 30 | 1804.23 | 956.73 | 50 | 2660.40 | 6925.67 | 0.432 |
| APRIL | 30 | 0.57 | 1.67 | 50 | 1.017 | 2.71 | 0.227 |
Table 7.
Clinical features and levels of serum biomarkers of patients with IgA nephropathy.
Table 7.
Clinical features and levels of serum biomarkers of patients with IgA nephropathy.
| Group | No. | Age | Interval to Kidney Biopsy (Months) |
24-h Proteinuria * | Gd-IgA1 | IgA | C3 | CKD-EPI GFR [17] |
|---|---|---|---|---|---|---|---|---|
| Count | Mean | Mean | Median | Median | Median | Median | Mean | |
| IgAN | 50 | 34.8 ± 9.7 | 19.4 ± 30.3 | 1.4 (0.3–5.5) |
8637.7 (1888.9–89,642) |
3.0 (0.8–5.7) |
1.3 (0.9–2.3) |
64.4 ± 30.7 |
| Male | 33 | 35 ± 9 | 20 ± 34 | 1.3 (0.3–5.5) |
7754.25 (980–89,642) |
3.0 (1.1–5.7) |
1.3 (0.9–2.3) |
59.1 ± 28.9 |
| Female | 17 | 34.4 ± 10 | 16.9 ± 20 | 0.7 (0.3–3.8) |
7030.1 (738.5–30,622.55) |
2.8 (0.8–5.6) |
1.3 (0.9–1.9) |
74.8 ± 32.3 |
| CKD I | 10 | 29.8 ± 7 | 16 ± 25 | 1.2 (0.3–5.5) |
8930.07 (3676.75–16,376.50) |
3.4 (0.9–3.9) |
1.3 (1.0–2.3) |
109.5 ± 10.9 |
| CKD II | 16 | 32.8 ± 8 | 18.4 ± 22 | 0.6 (0.3–3.8) |
7954.62 (2140.25–30,622.55) |
2.6 (0.8–5.7) |
1.3 (0.9–1.7) |
76.1 ± 8.7 |
| CKD IIIa | 9 | 40 ± 12 | 8.6 ± 10 | 0.7 (0.3–2.6) |
9455.95 (1888.95–51,037.7) |
3.1 (1.8–5.1) |
1.6 (0.9–1.8) |
52.8 ± 4.8 |
| CKD IIIb | 7 | 36.1 ± 11 | 26.7 ± 31 | 1.1 (0.4–2.8) |
8634.15 (3949.4–11,286.45) |
3.4 (1.9–4.3) |
1.2 (1.0–1.7) |
37.2 ± 4.4 |
| CKD IV | 7 | 38.1 ± 10 | 33.4 ± 60 | 2.0 (0.5–3.9) |
10,965.5 (1970.85–89,642) |
2.4 (2.4–3.0) |
1.2 (0.9–1.9) |
23.0 ± 3.9 |
| ESRD | 1 | 36 | 6 | 1.6 | 15,373.75 | 4.7 | 1.4 | 12.2 |
Table 8.
Correlation between serum concentrations of Gd-IgA1, IgA, Gd-IgA1/IgA, and IgA/C3 and disease progression based on eGFR over years.
Table 8.
Correlation between serum concentrations of Gd-IgA1, IgA, Gd-IgA1/IgA, and IgA/C3 and disease progression based on eGFR over years.
| Variables | CKD Progression Based on eGFR | ||||||
|---|---|---|---|---|---|---|---|
| No | Yes | ||||||
| n | SD | n | SD | p Value | |||
| Gd-IgA1 | 31 | 12,353.24 | 16,685.58 | 19 | 11,114.14 | 6908.02 | 0.442 |
| IgA | 31 | 2.79 | 1.23 | 19 | 3.16 | 1.10 | 0.407 |
| Gd-IgA1/IgA | 31 | 4905.13 | 6692.2 | 19 | 3729.16 | 2530.77 | 0.960 |
| IgA/C3 | 31 | 2.05 | 1.00 | 19 | 2.58 | 0.82 | 0.067 |
Table 9.
Comparison of clinic-pathologic characteristics of the present cohort with other study populations.
Table 9.
Comparison of clinic-pathologic characteristics of the present cohort with other study populations.
| Present Study Bulgaria | Oxford [16] Study (Multi-Country) |
Valiga [22] Cohort (Europe) |
Alamartine et al. [23] (France) |
Zeng et al. [24] (China) |
Katafuchi et al. [25] (Japan) |
|
|---|---|---|---|---|---|---|
| Patients (n) | 125 | 265 | 1147 | 183 | 1026 | 702 |
| Age (yrs, mean) | 35.94 | 30 | 36 | 38 | 34 | 30 |
| Males (%) | 70.4 | 72 | 73 | 74,9 | 50 | 42 |
| Proteinuria (g/day) | 1.34 | 1.7 | 1.3 | 1.2 | 1.3 | 0.9 |
| S Cr (μmol/L) | 126.7 | |||||
| eGFR (mL/min/1.73 m2) | 62 | 83 | 73 | 72 | 85 | 82 |
| MEST lesions % | ||||||
| M1 | 34.2 | 80 | 28 | 21 | 43 | 12 |
| E1 | 9 | 42 | 11 | 14 | 11 | 42 |
| S1 | 48.4 | 45 | 70 | 54 | 83 | 79 |
| T1 and T2 (T2) | 55.5 (9.7) | 21 (3.6) | 30 (10) | 27.3 (3.3) | 30 (12) | |
| C1 | 14.2 | 11 | 5 | 48 | 63 | |
| Follow-up duration (months) | 69.6 | 65 | 56 | 77 | 53 | 62 |
| ACEi/ARB (%) | 59.4 | 74 | 86 | 65 | 89 | 37 |
| Immunosupression (%) | 38.4 | 29 | 46 | 30 | 31 | 32 |
| End point definition | Doubling of S Cr | 50% decline in eGFR or ESKD | 50% decline in eGFR or ESKD | Doubling of S Cr or ESKD | 50% decline in eGFR or ESKD | ESKD |
| END point event (%) | 18.4 | 22 | 16 | 20 | 15.5 | 12 |