JPM | Free Full-Text | The Impact of Positive Inotropic Therapy on Hemodynamics and Organ Function in Acute Heart Failure: A Differentiated View
Figure 1.
Patient cohort for data analysis.
Figure 1.
Patient cohort for data analysis.
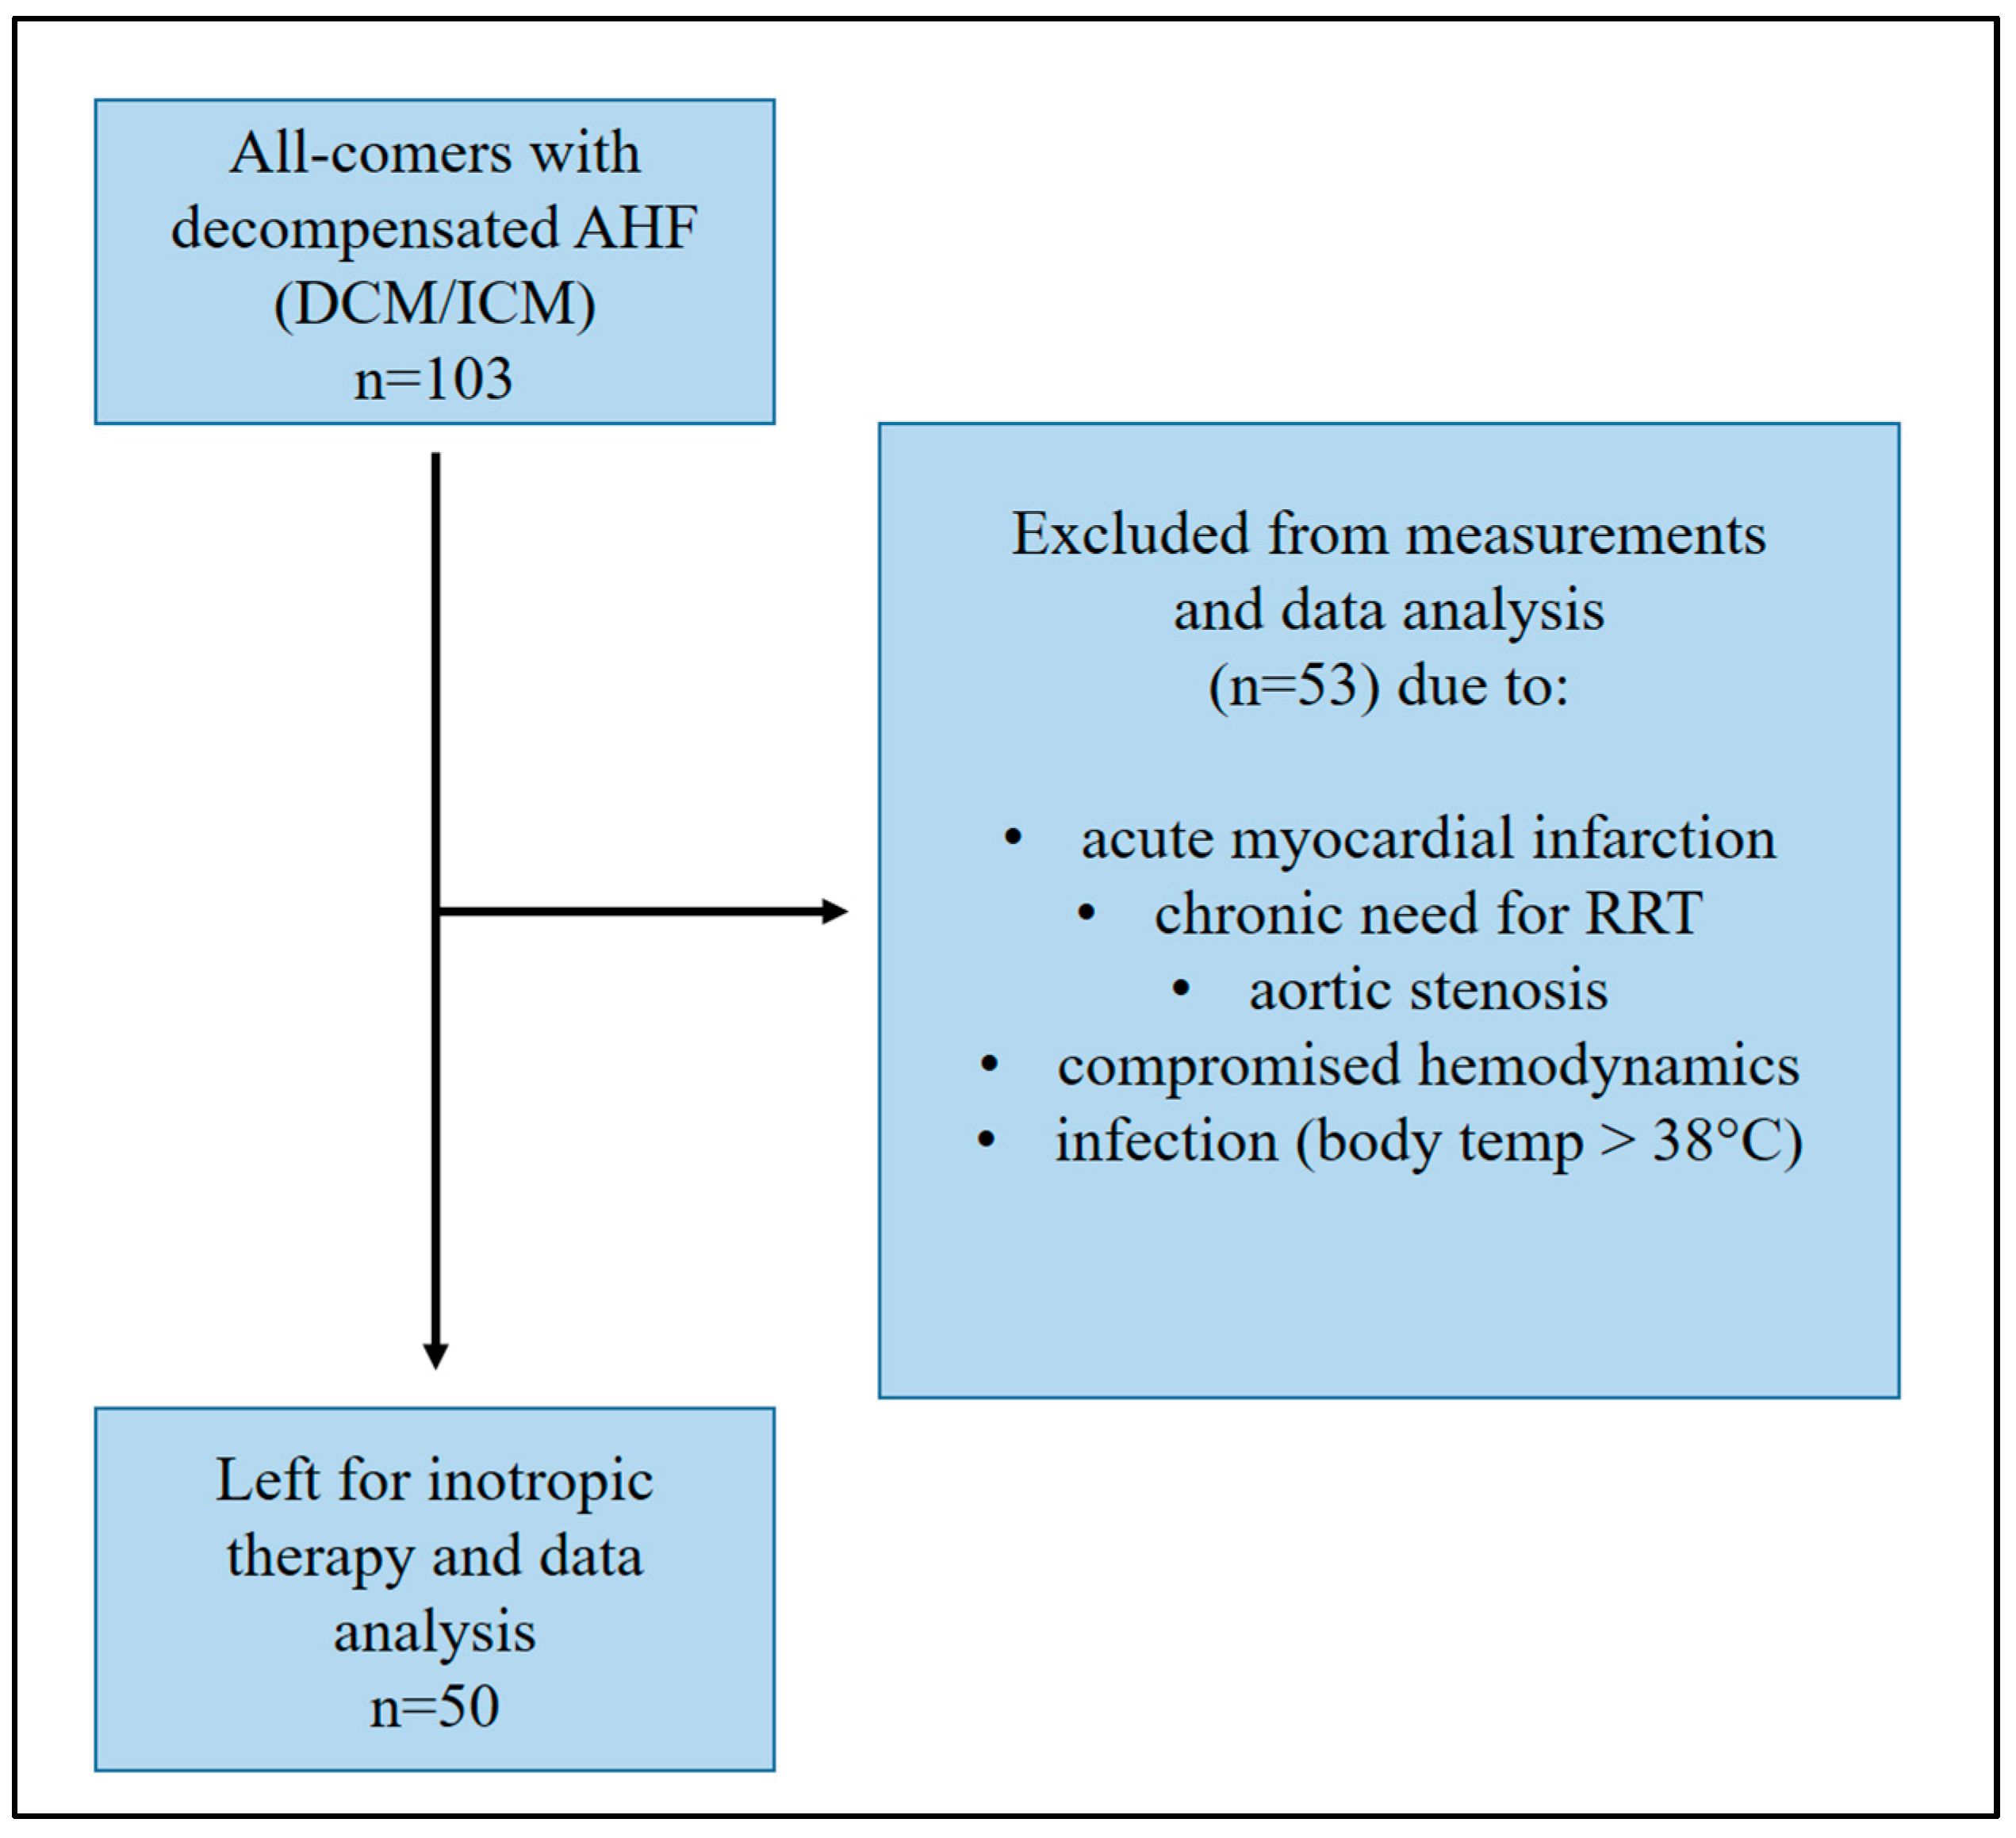
Figure 2.
Changes in hemodynamics and LVEF in the overall cohort. In the overall cohort, no significant changes in cardiac output (CO), cardiac index (CI), systemic vascular resistance (SVR), and left ventricular ejection fraction (LVEF) could be observed (T1: admission, T2: follow-up, ns: not significant, p ≥ 0.05).
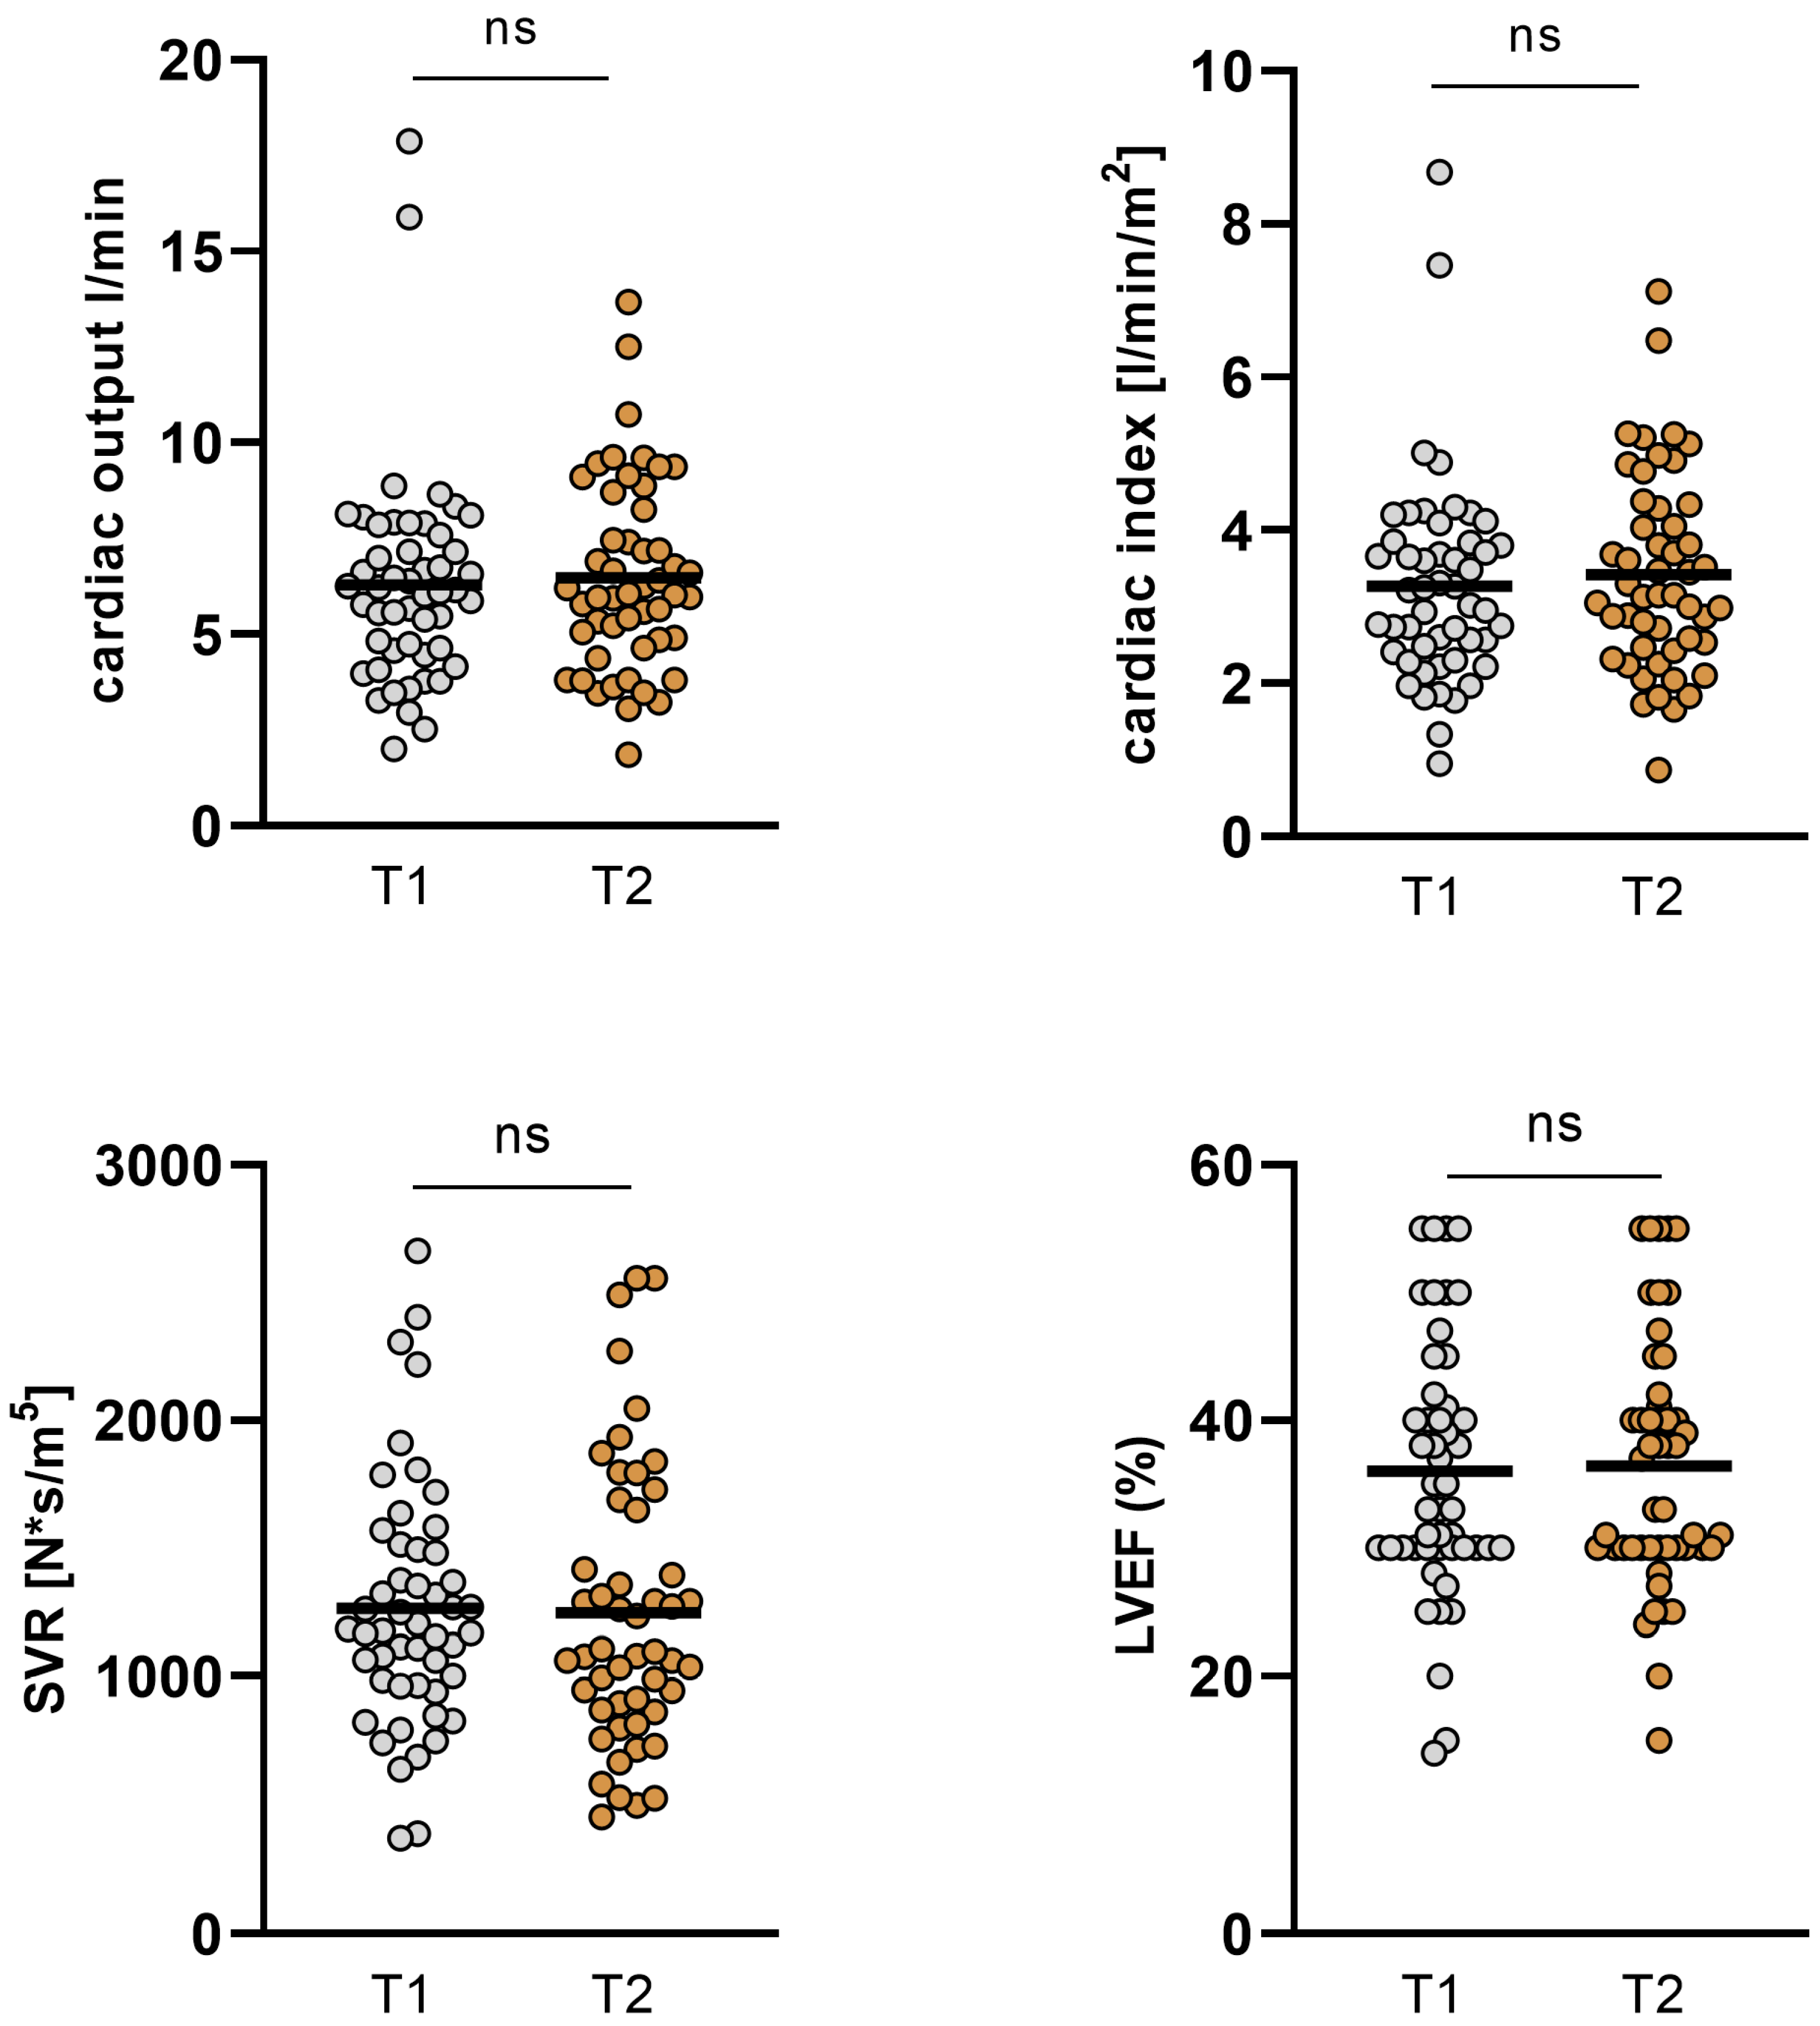
Figure 3.
Changes in GFR, NT-proBNP, ST2, and body weight in the overall cohort. GFR improved significantly from baseline 36.63 ± 18.1 mL/min to 42.8 ± 18.82 mL/min (p = 0.01). Levels of NT-proBNP and ST2 decreased significantly from baseline to short-term follow-up (15765 ± 12246 to 6984 ± 5775 pg/mL; p < 0.001 and 102.76 ± 77.55 ng/mL to 68.59 ± 58.94 ng/mL; p < 0.001). Also, body weight was significantly reduced between the two time points (80.45 ± 14.87 kg to 78.58 ± 15.5; p < 0.001). (GFR: glomerular filtration rate, T1: admission, T2: follow-up, ns: not significant, p ≥ 0.05, **: p ≤ 0.01, ***: p < 0.001).
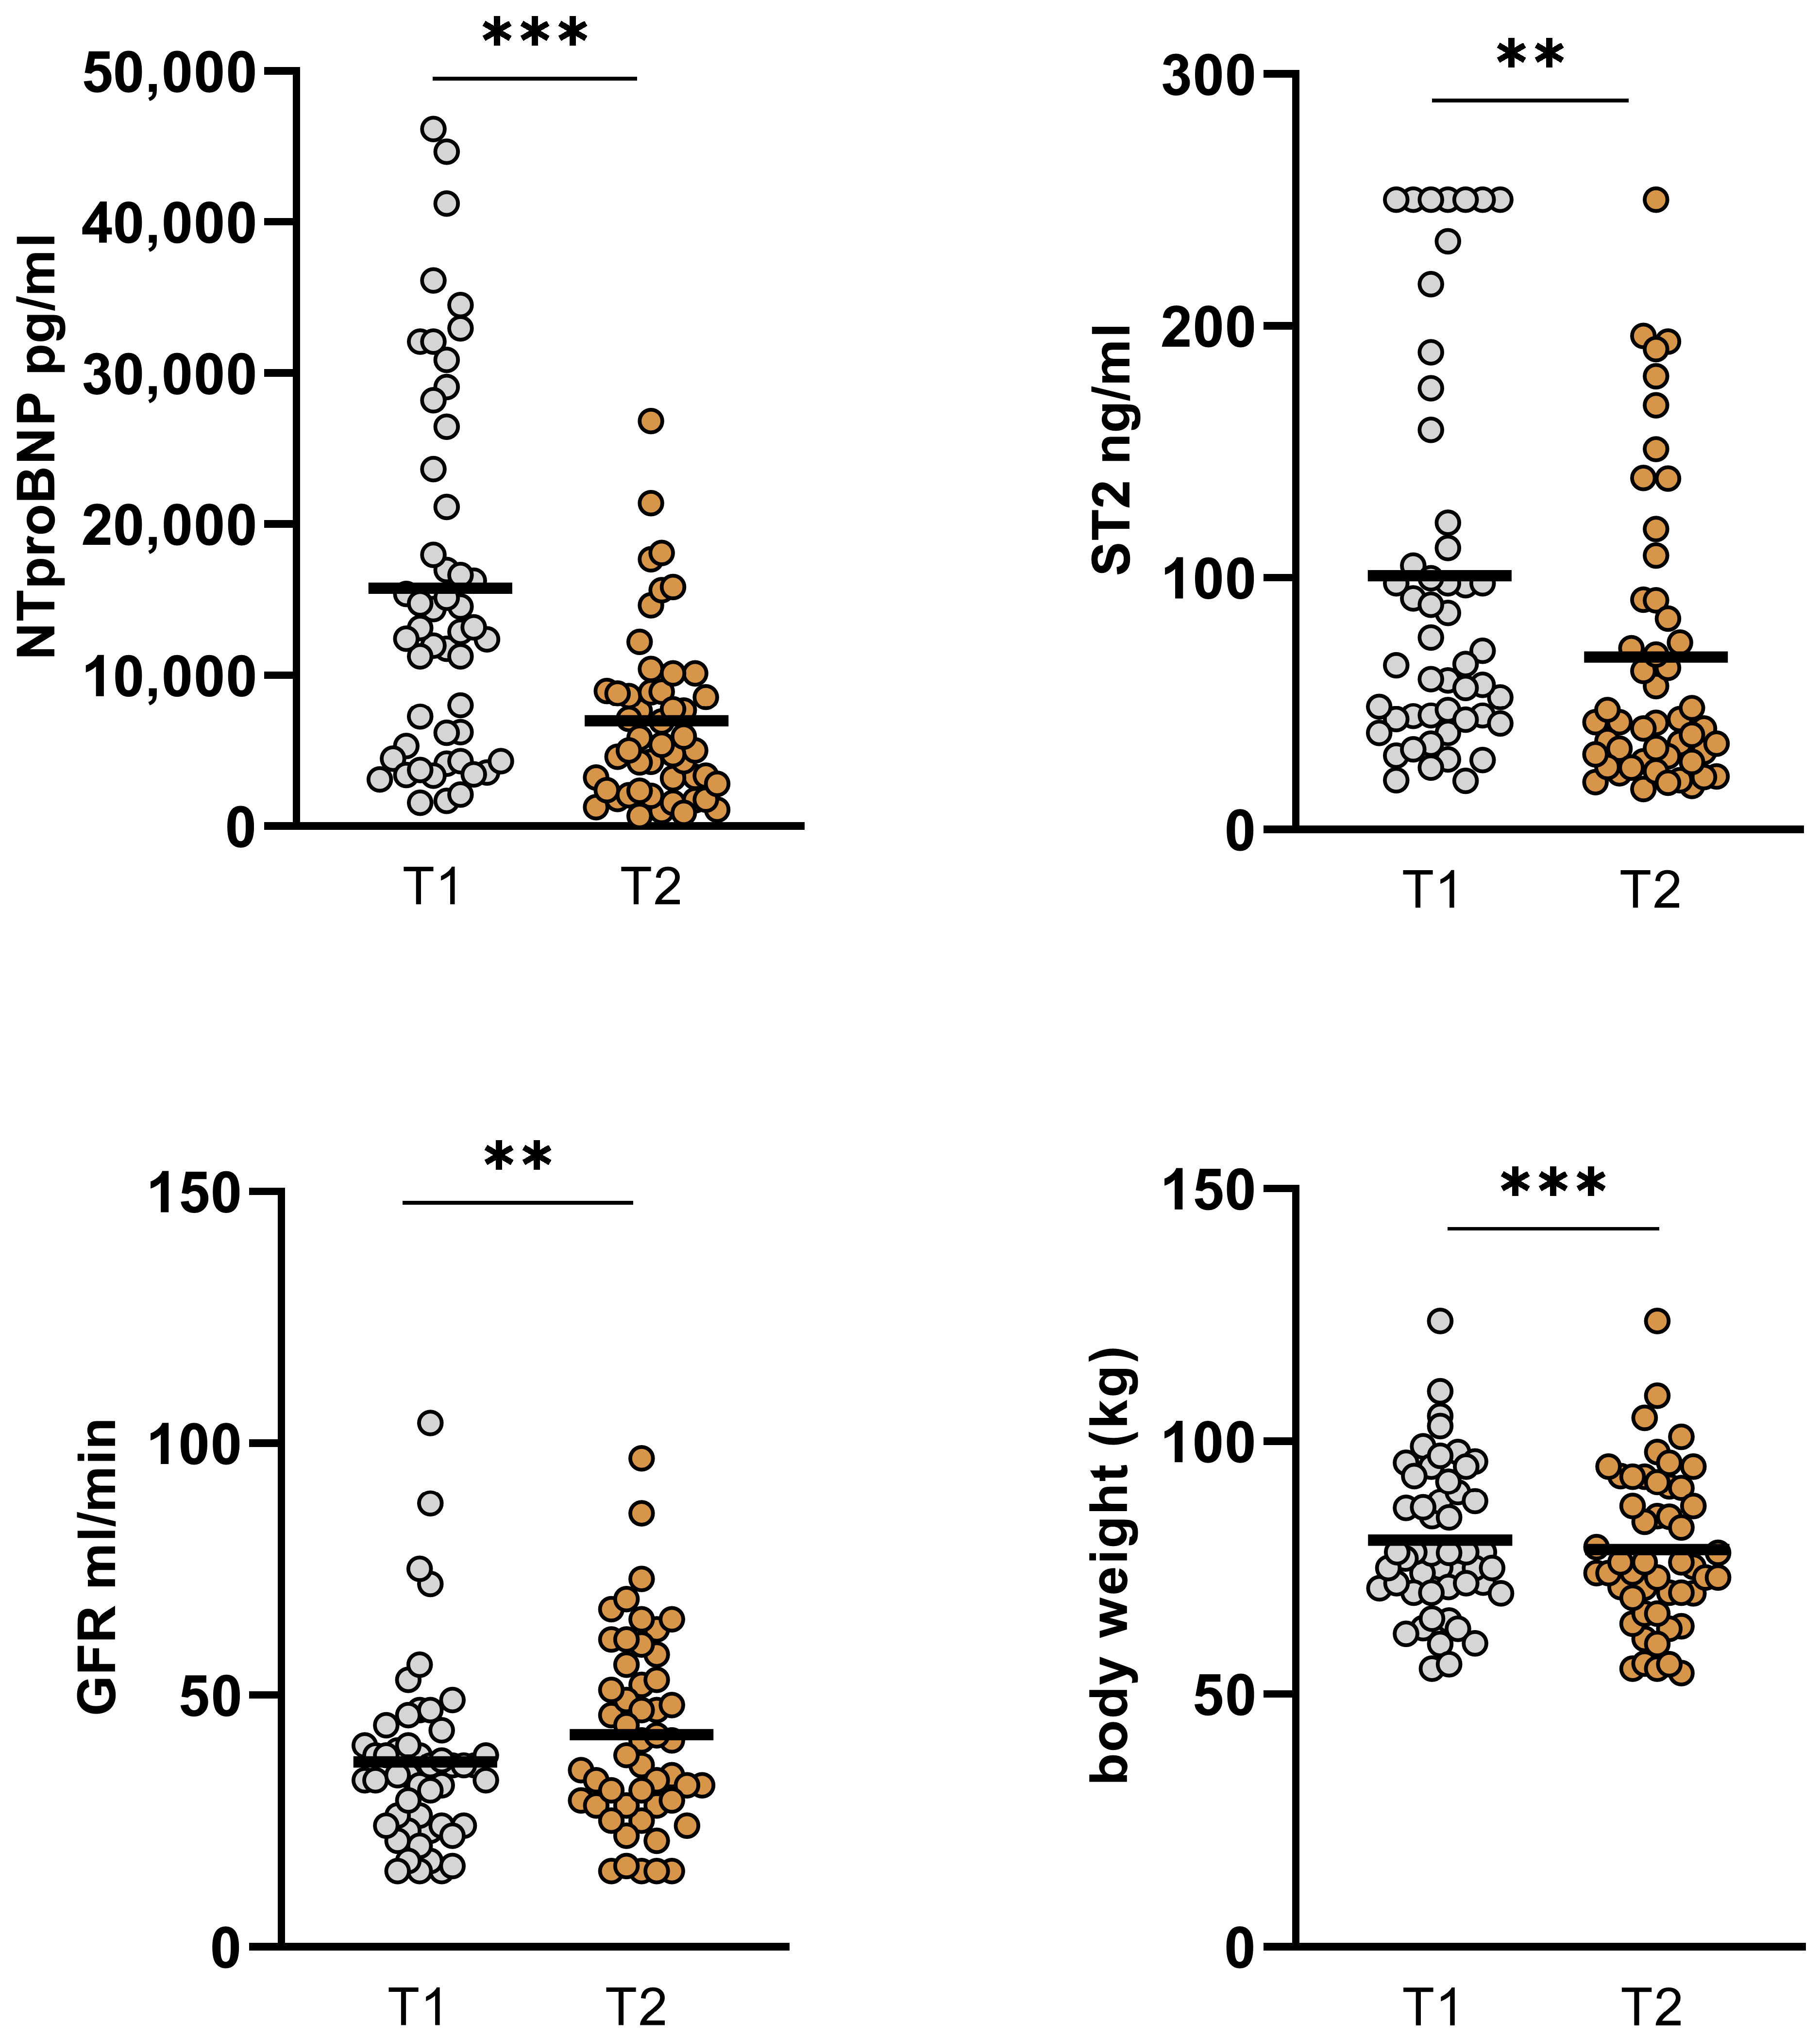
Figure 4.
Changes in hemodynamics and LVEF in ICM and DCM subgroups. In the ICM subgroup, no significant changes in CO, CI, SVR, and LVEF were observed. However, in patients with underlying DCM, CO increased from 6.09 ± 2.58 L/min (T1) to 6.82 ± 2.57 L/min (T2; p = 0.036) and CI increased from 3.26 ± 1.18 L/min/m2 (T1) to 3.74 ± 1.27 L/min/m2 (T2; p = 0.013). SVR and LVEF were not altered significantly. (DCM: dilative cardiomyopathy, ICM: ischemic cardiomyopathy, CO: cardiac output, CI: cardiac index, SVR: systemic vascular resistance, LVEF: left ventricular ejection function. T1: admission, T2: follow-up, ns: not significant, p ≥ 0.05, *: p < 0.05).
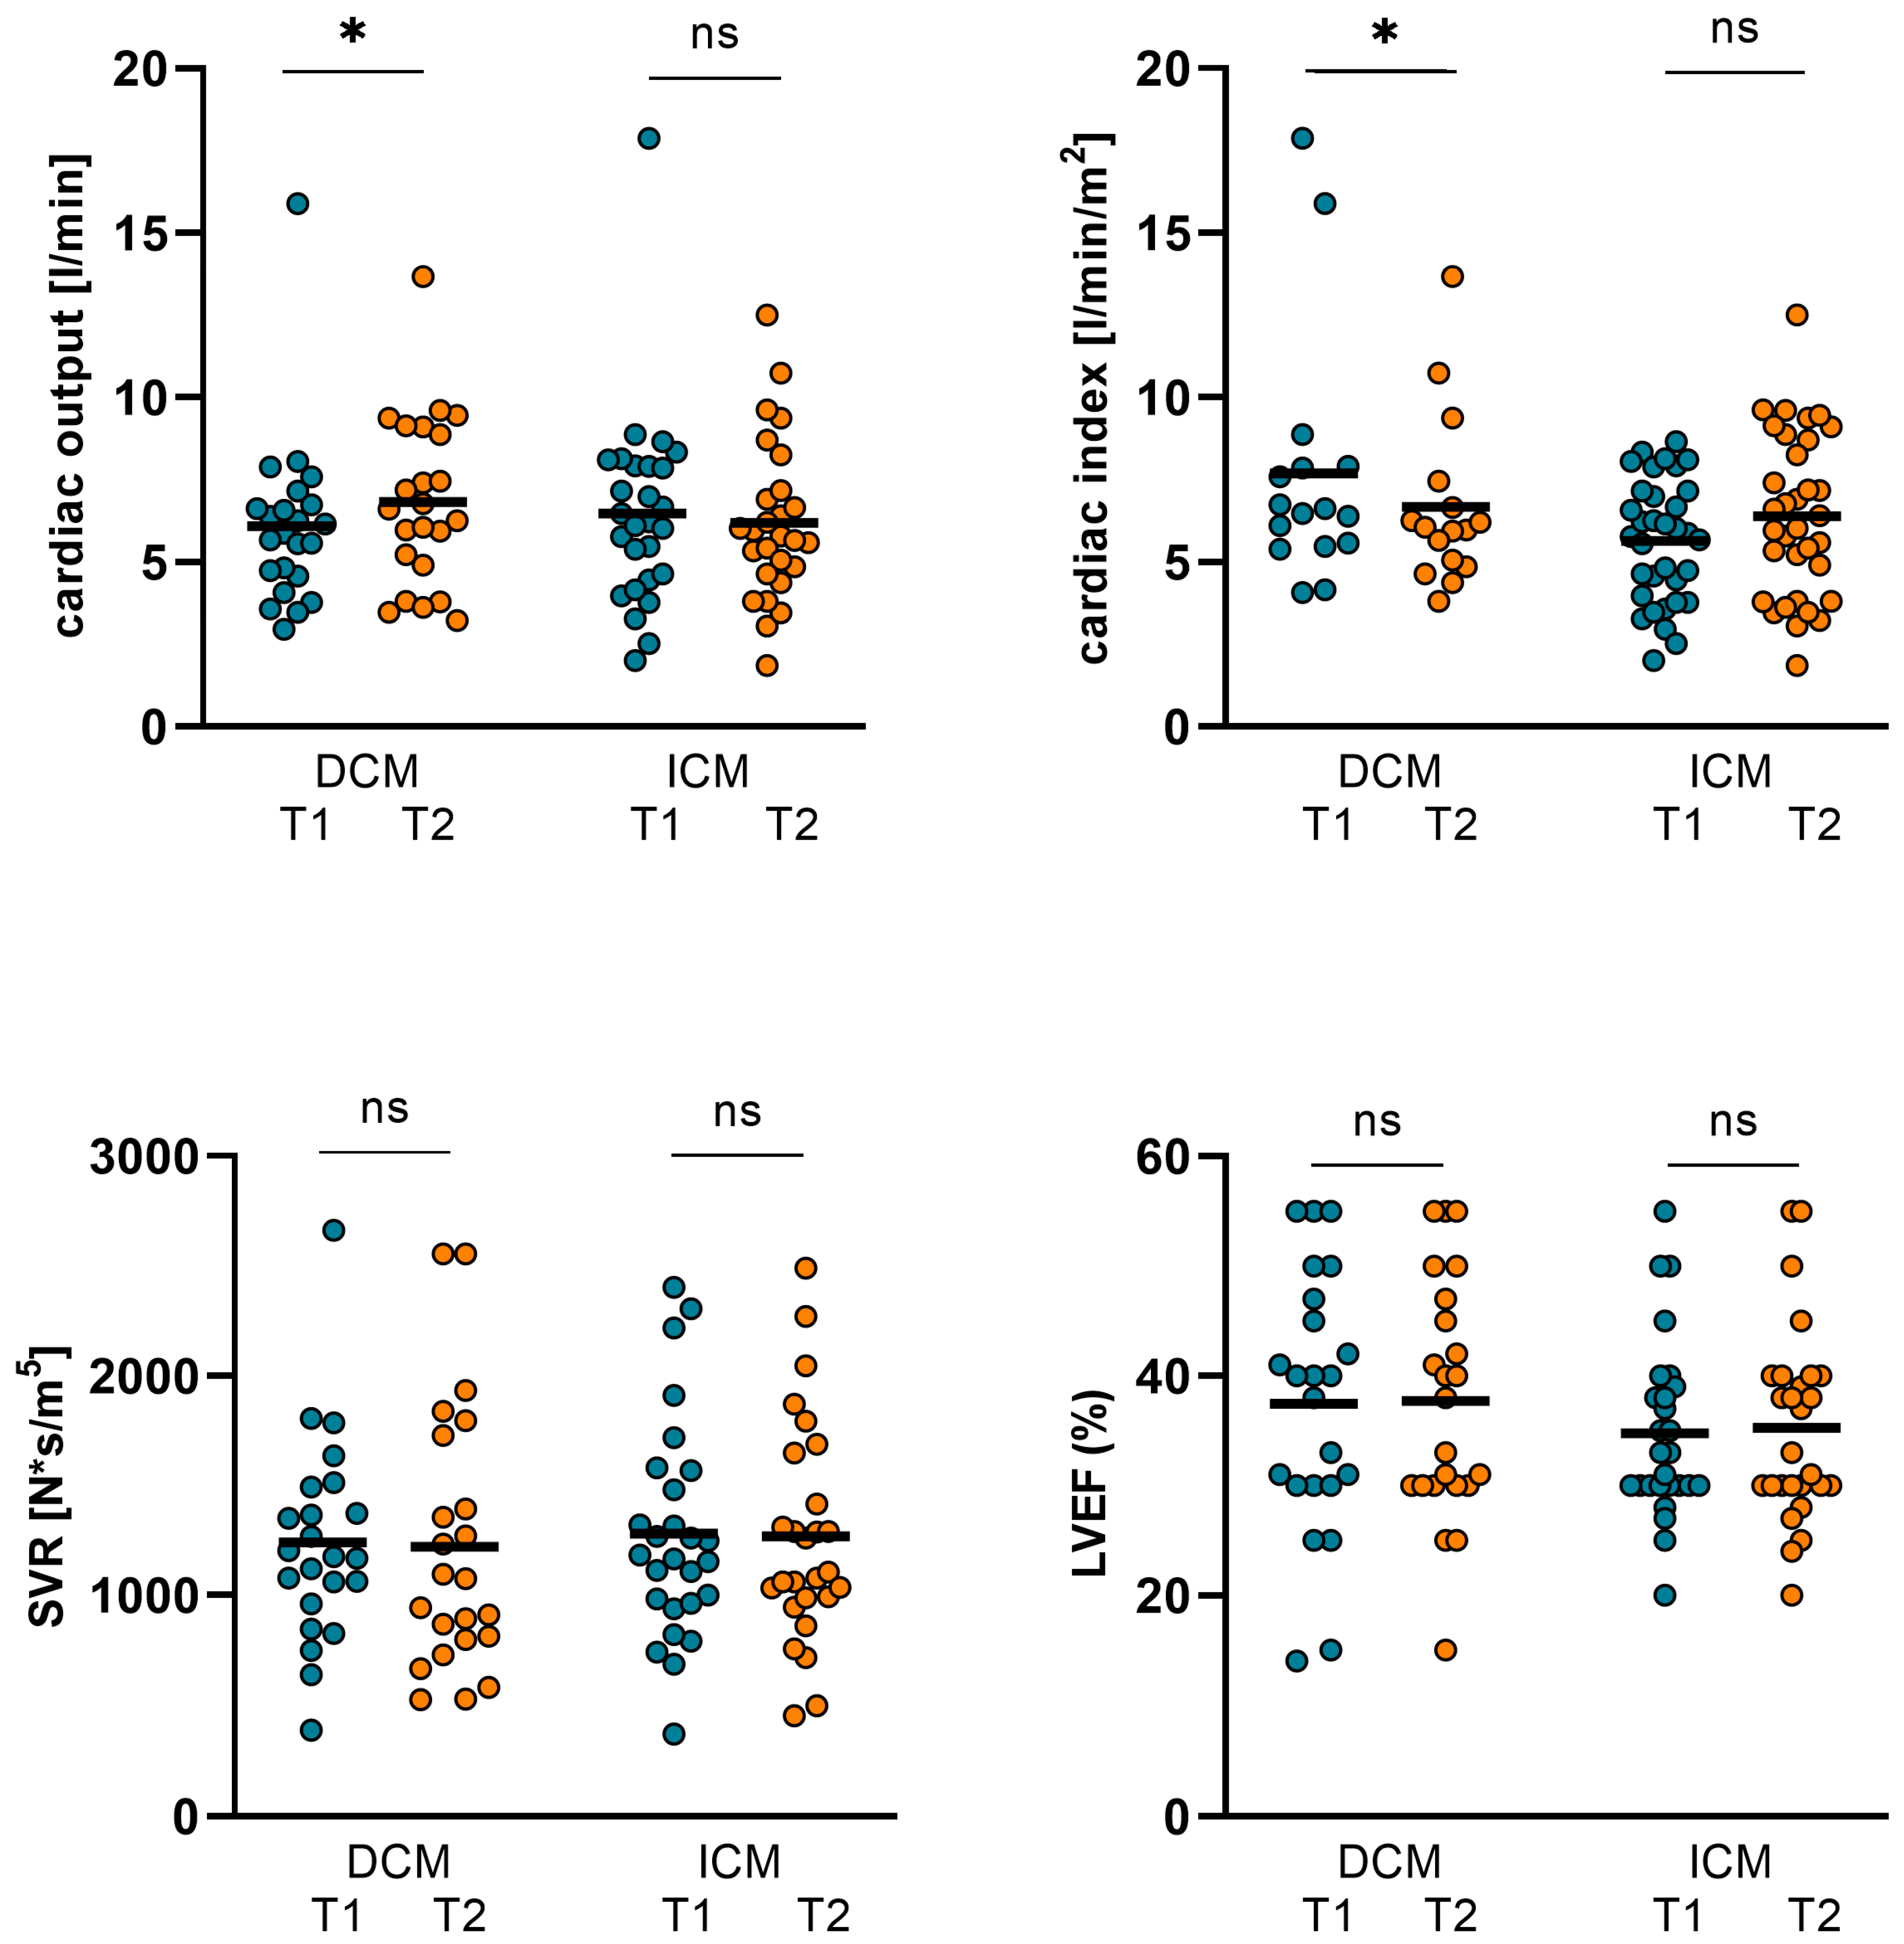
Figure 5.
Changes in NT-proBNP, ST2, GFR, and body weight in ICM and DCM subgroups. In ICM patients, NT-proBNP was significantly reduced from 15891 ± 12167 pg/mL (T1) to 7677 ± 6700 pg/mL (T2; p = 0.001). ST2 also decreased from 98.22 ± 74.42 ng/mL (T1) to 72.34 ± 63.67 ng/mL (T2; p = 0.042). In ICM patients, body weight declined significantly from 85.26 ± 15.37 kg (T1) to 83.93 ± 15.63 kg (T2; p = 0.007). GFR improved in this subgroup from 37.52 ± 21.01 (T1) to 43.81 ± 21.18 (T2) but the p-value did not reach statistical significance (p = 0.082). In DCM patients, NT-proBNP and ST2 both decreased from 15616 ± 12611 pg/mL (T1) to 6170 ± 4467 pg/mL (T2; p = 0.001) and from 103.74 ± 82.67 ng/mL (T1) to 64.19 ± 53.9 ng/mL (T2; p = 0.001). Body weight decreased in this subgroup from 74.81 ± 12.34 kg (T1) to 72.31 ± 12.04 kg (T2; p < 0.001) and GFR improved from 35.55 ± 14.16 (T1) to 41.55 ± 15.86 (T2), but in turn, the p-value did not reach statistical significance (p = 0.062). (GFR: glomerular filtration rate, DCM: dilative cardiomyopathy, ICM: ischemic cardiomyopathy, T1: admission, T2: follow-up, ns: not significant, p ≥ 0.05, *: p < 0.05, **: p ≤ 0.01, ***: p < 0.001).
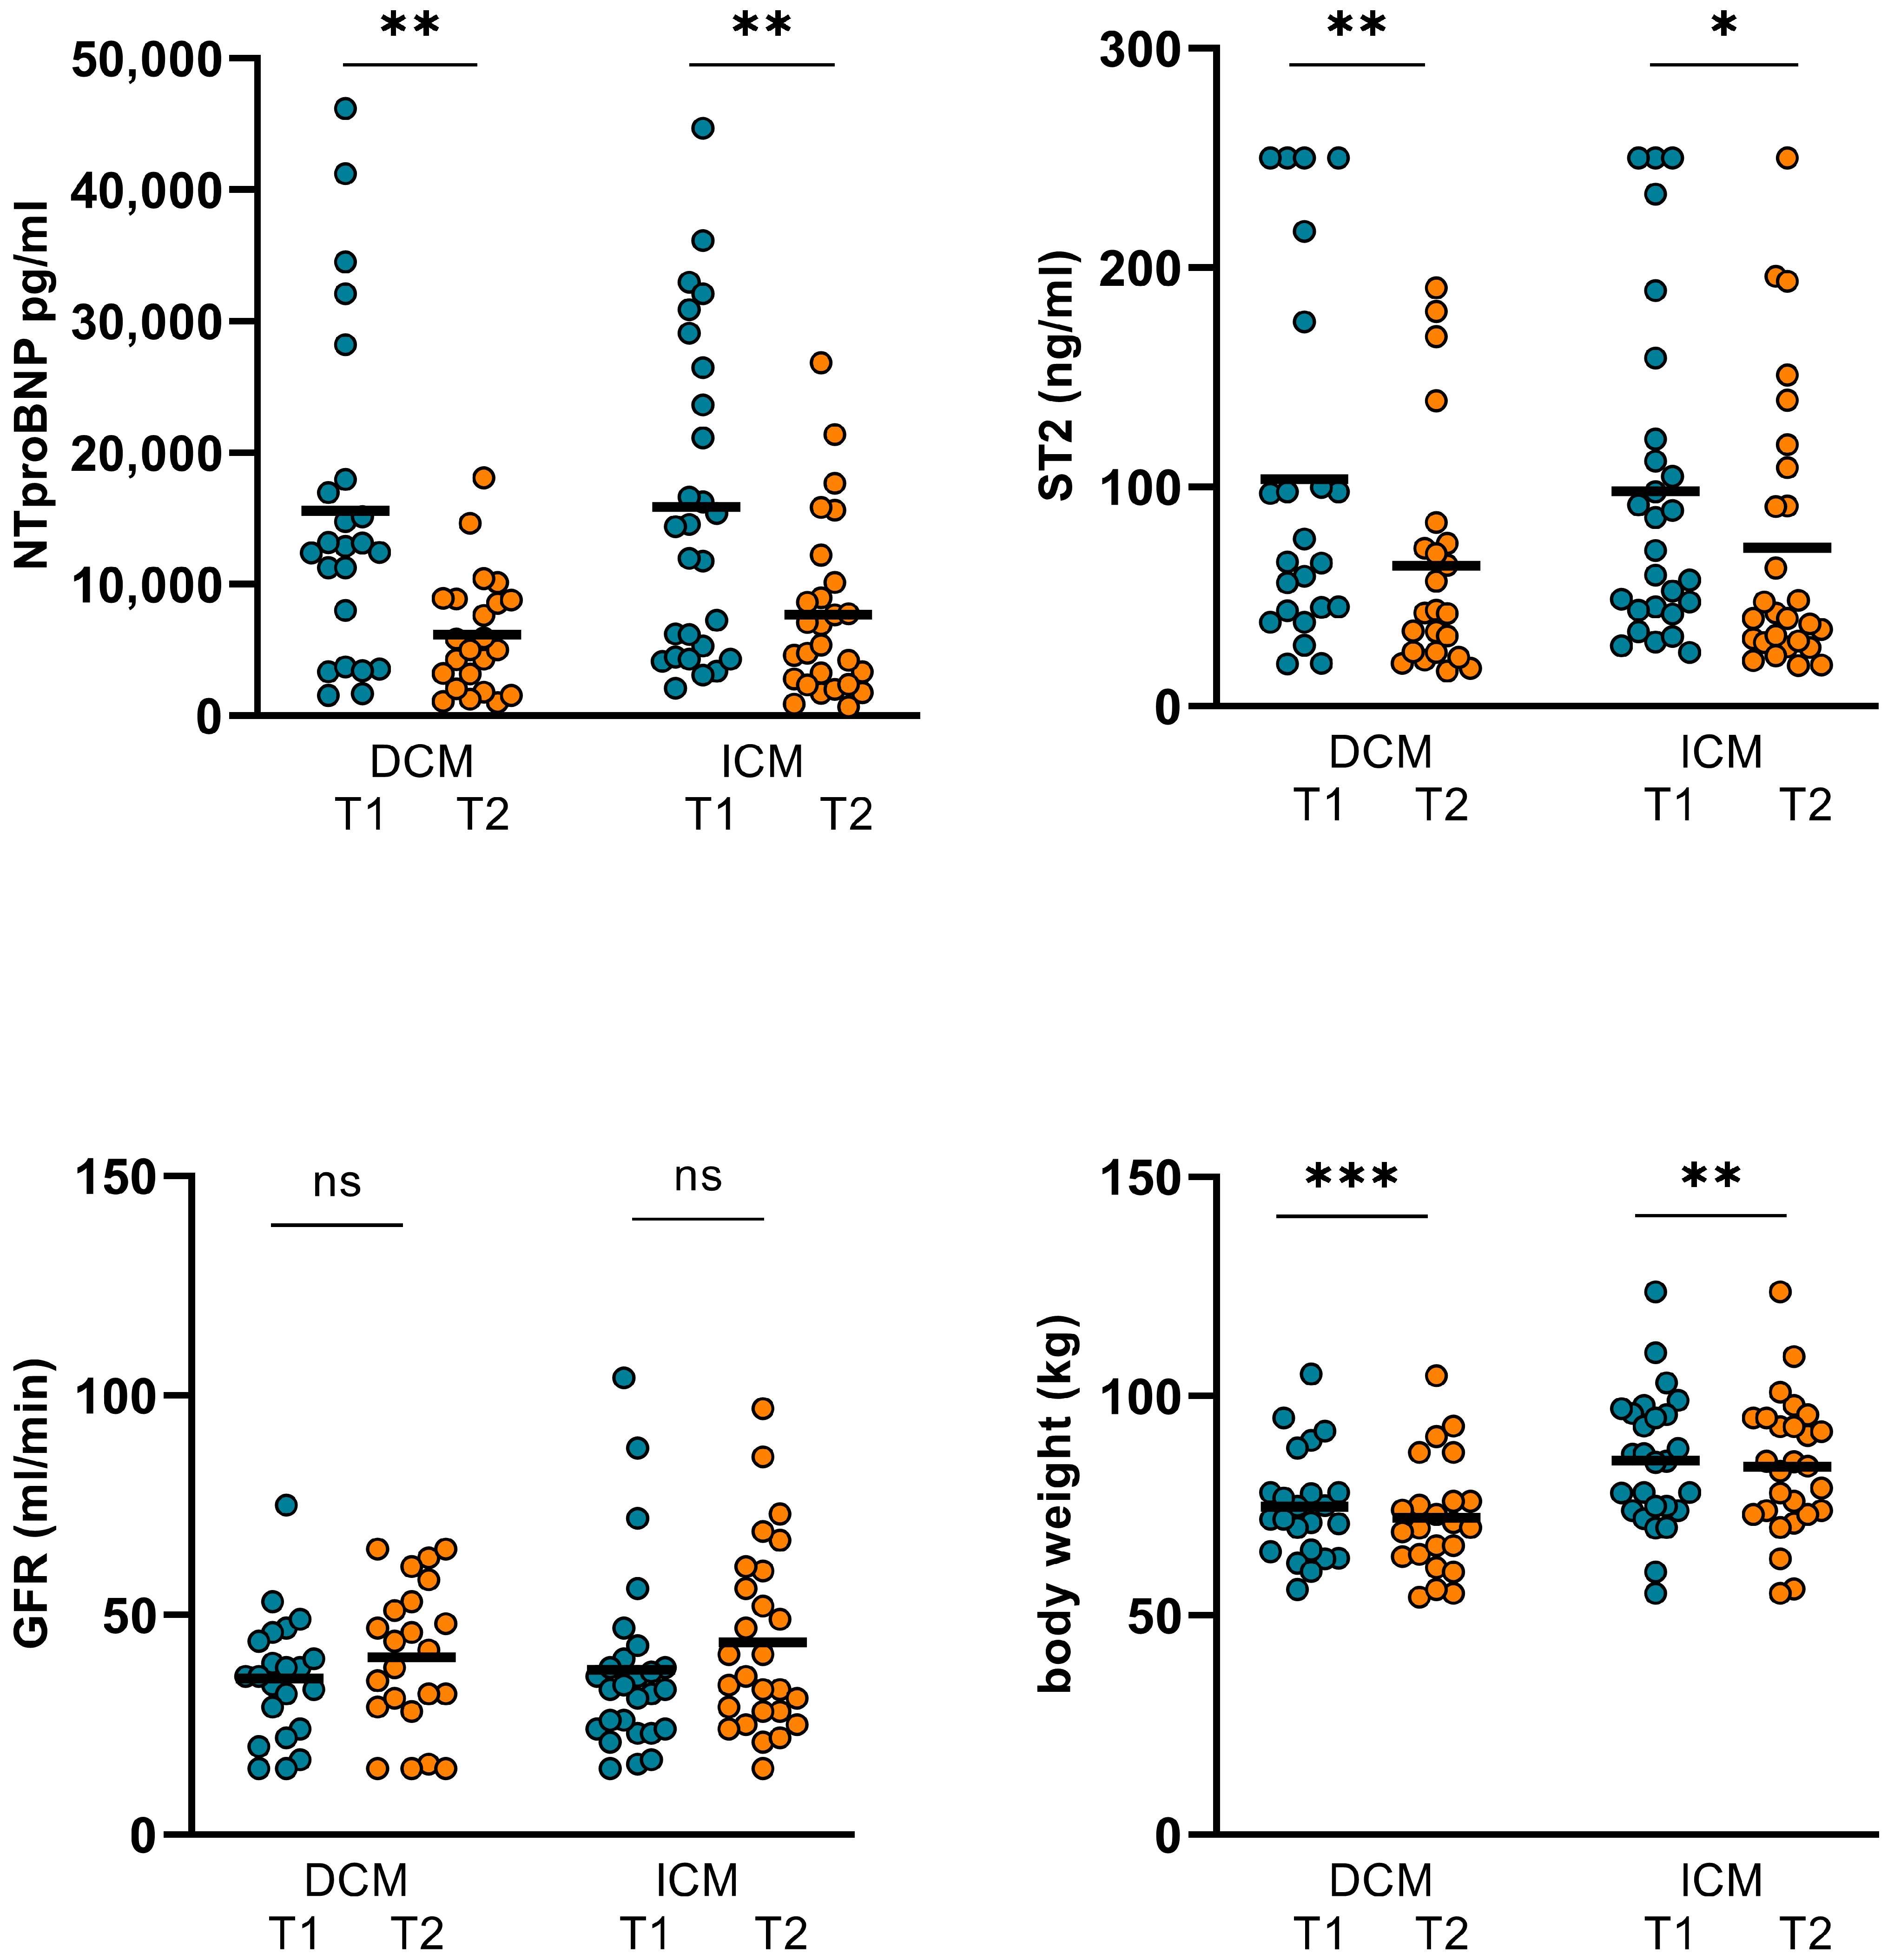
Figure 6.
Changes in hemodynamics and LVEF in levosimendan and dobutamine subgroups. In the dobutamine subgroup, no significant alterations regarding CO, CI, SVR, and LVEF were observed. However, in the levosimendan subgroup, CO significantly increased from 4.55 ± 1.62 L/min (T1) to 5.47 ± 2.44 L/min (T2; p = 0.044) and CI from 2.39 ± 0.76 L/min/m2 (T1) to 2.87 ± 1.18 L/min/m2 (T2; p = 0.05). SVR and LVEF could not be significantly altered in the levosimendan subgroup. (CO: cardiac output, CI: cardiac index, SVR: systemic vascular resistance, LVEF: left ventricular ejection function, T1: admission, T2: follow-up, ns: not significant, p ≥ 0.05, *: p < 0.05).
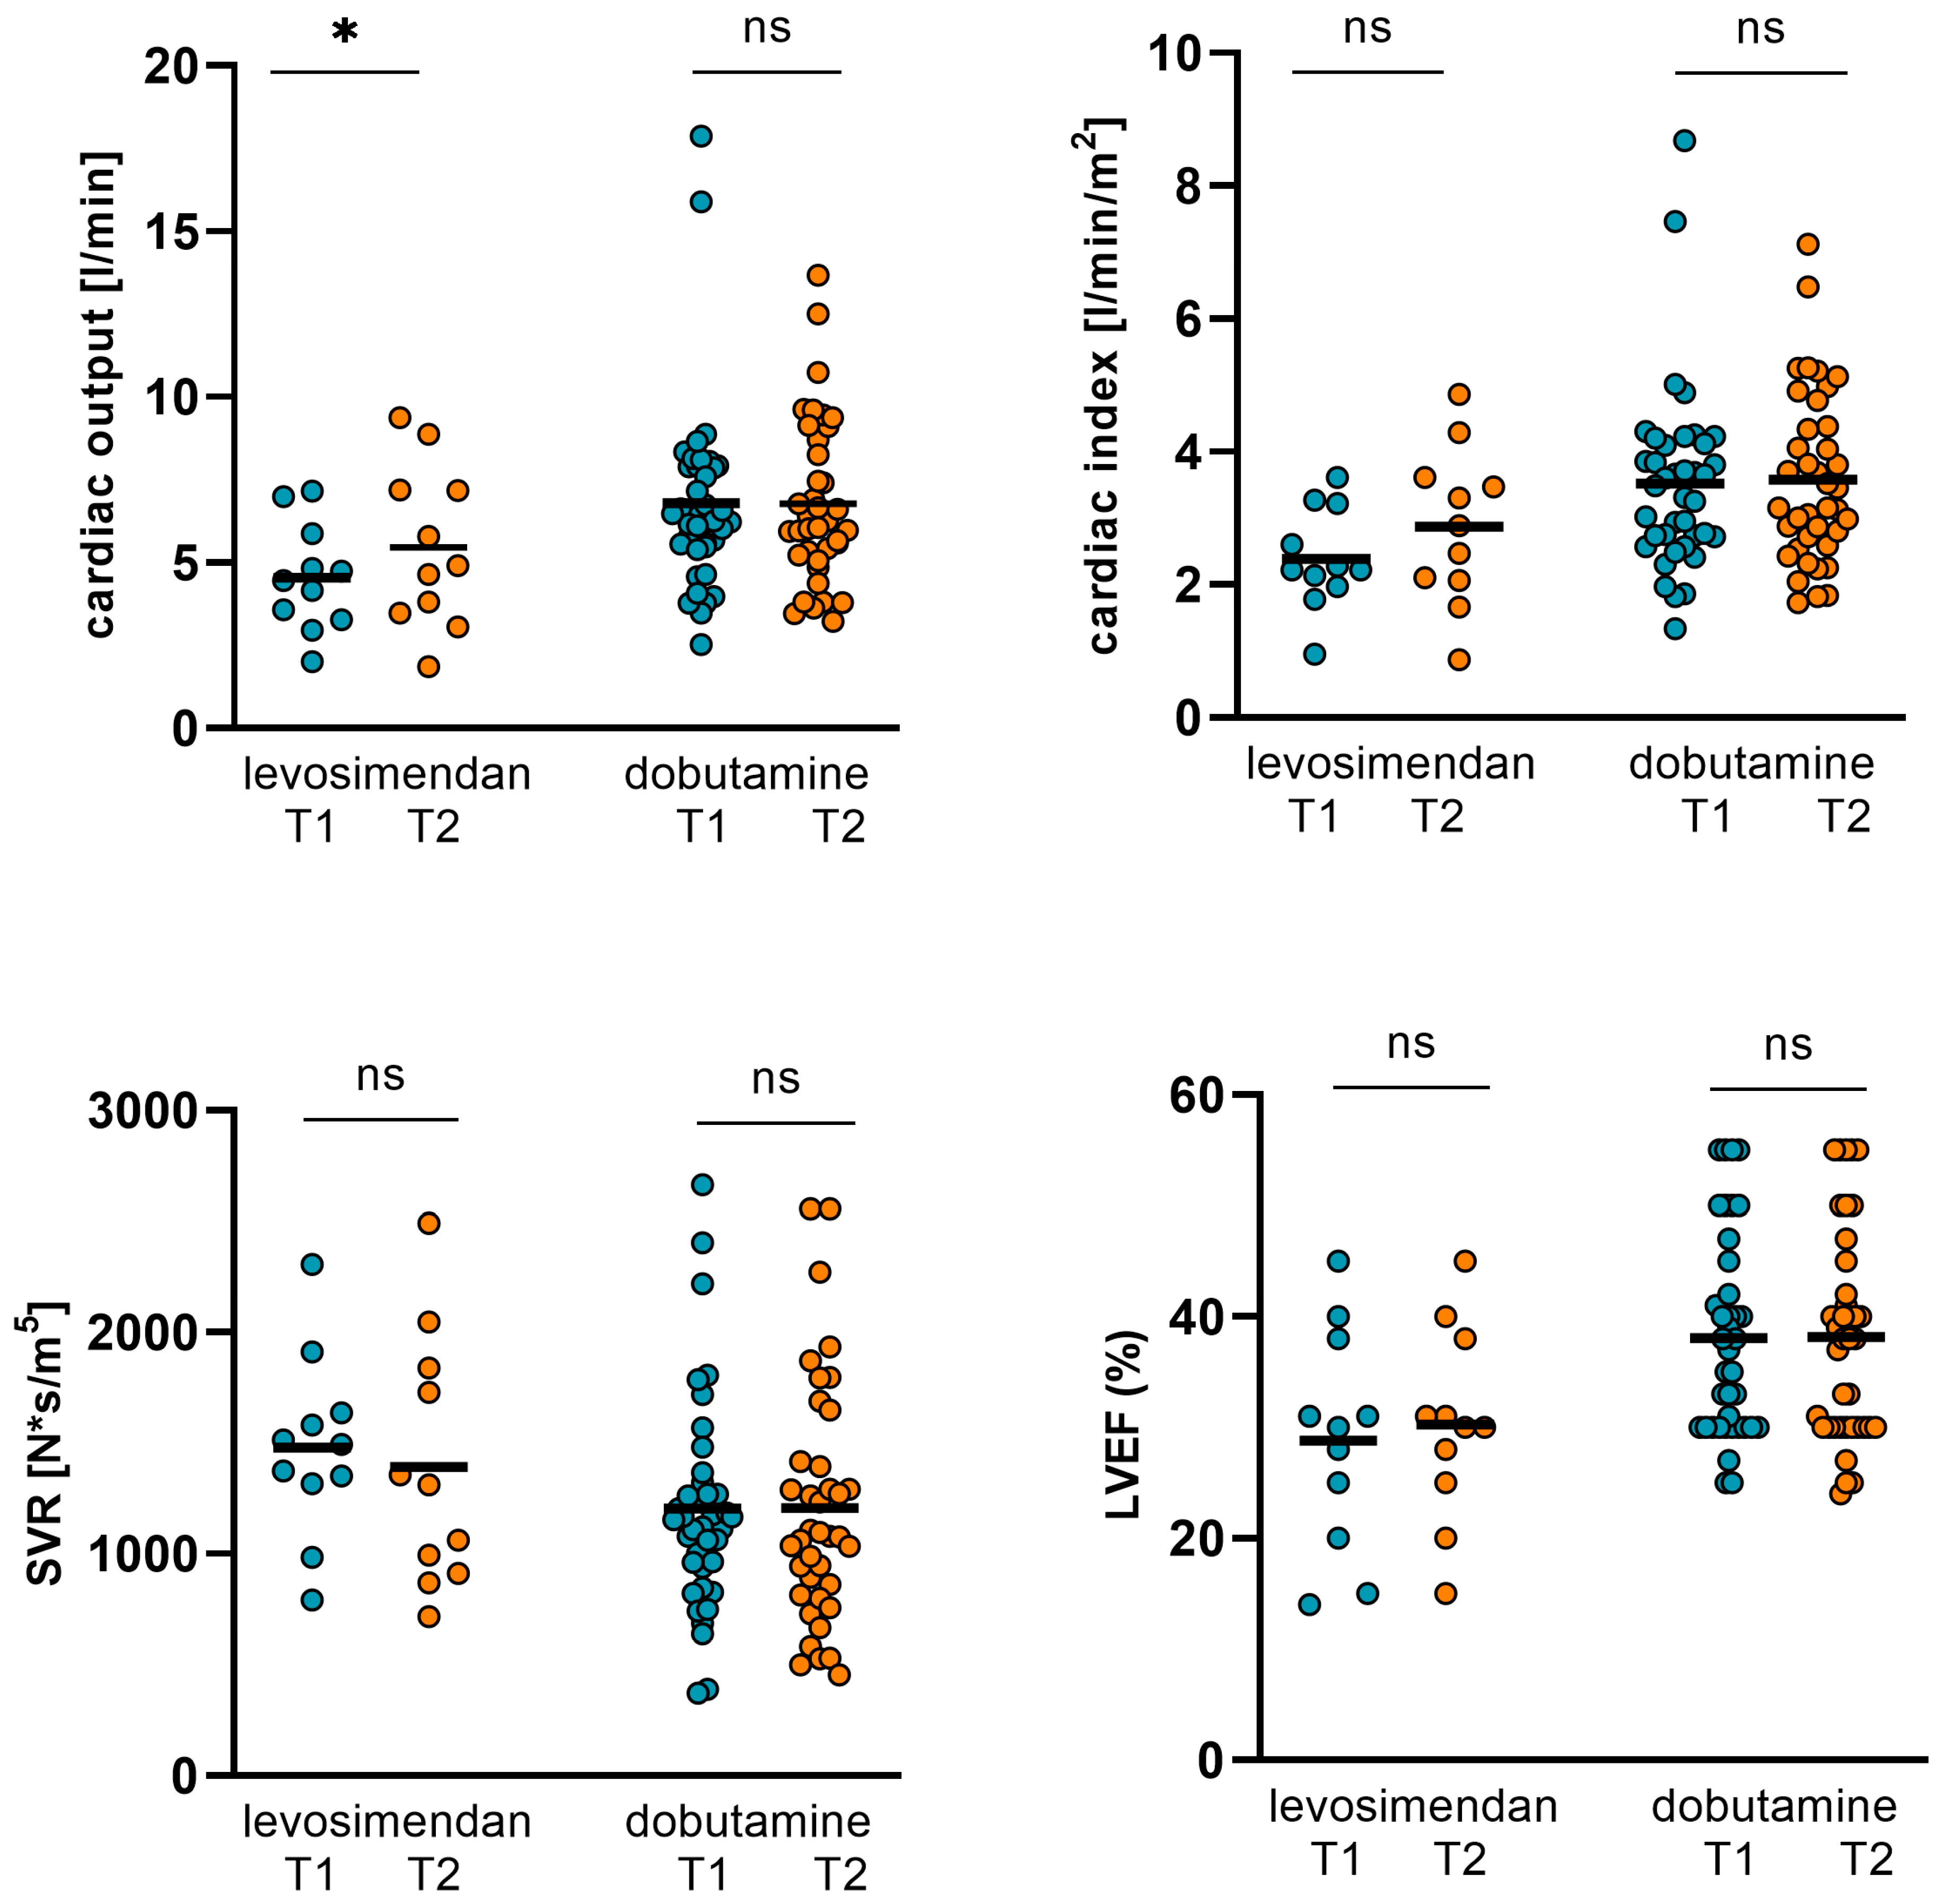
Figure 7.
Changes in NT-proBNP, ST2, GFR, and body weight in dobutamine and levosimendan subgroups. In the dobutamine subgroup, NT-proBNP and ST2 could be significantly reduced from 15436 ± 12524 pg/mL (T1) to 7166 ± 6095 pg/mL (T2; p < 0.001) and from 100.34 ± 76.63 ng/mL (T1) to 69.77 ± 60.4 ng/mL (T2; p = 0.003), respectively. GFR increased significantly from 36 ± 19.32 mL/min (T1) to 42 ± 19.99 mL/min (T2; p = 0.029). Body weight decreased from 81.09 ± 15.93 kg (T1) to 78.61 ± 16.6 kg (T2; p < 0.001). In the levosimendan subgroup, NT-proBNP decreased from 16931 ± 11701 ng/mL (T1) to 6337 ± 4653 ng/mL (T2; p = 0.004) and ST2 from 102.23 ± 84.58 pg/mL (T1) to 64.41 ± 56.01 pg/mL (T2; p = 0.16). GFR increased from 38.8 ± 13.59 (T1) to 45.55 ± 14.54 (T2), but the p-value did not reach statistical significance again (p = 0.202). Body weight was not altered significantly. (T1: admission, T2: follow-up, ns: not significant, p ≥ 0.05, *: p < 0.05, **: p ≤ 0.01, ***: p < 0.001).
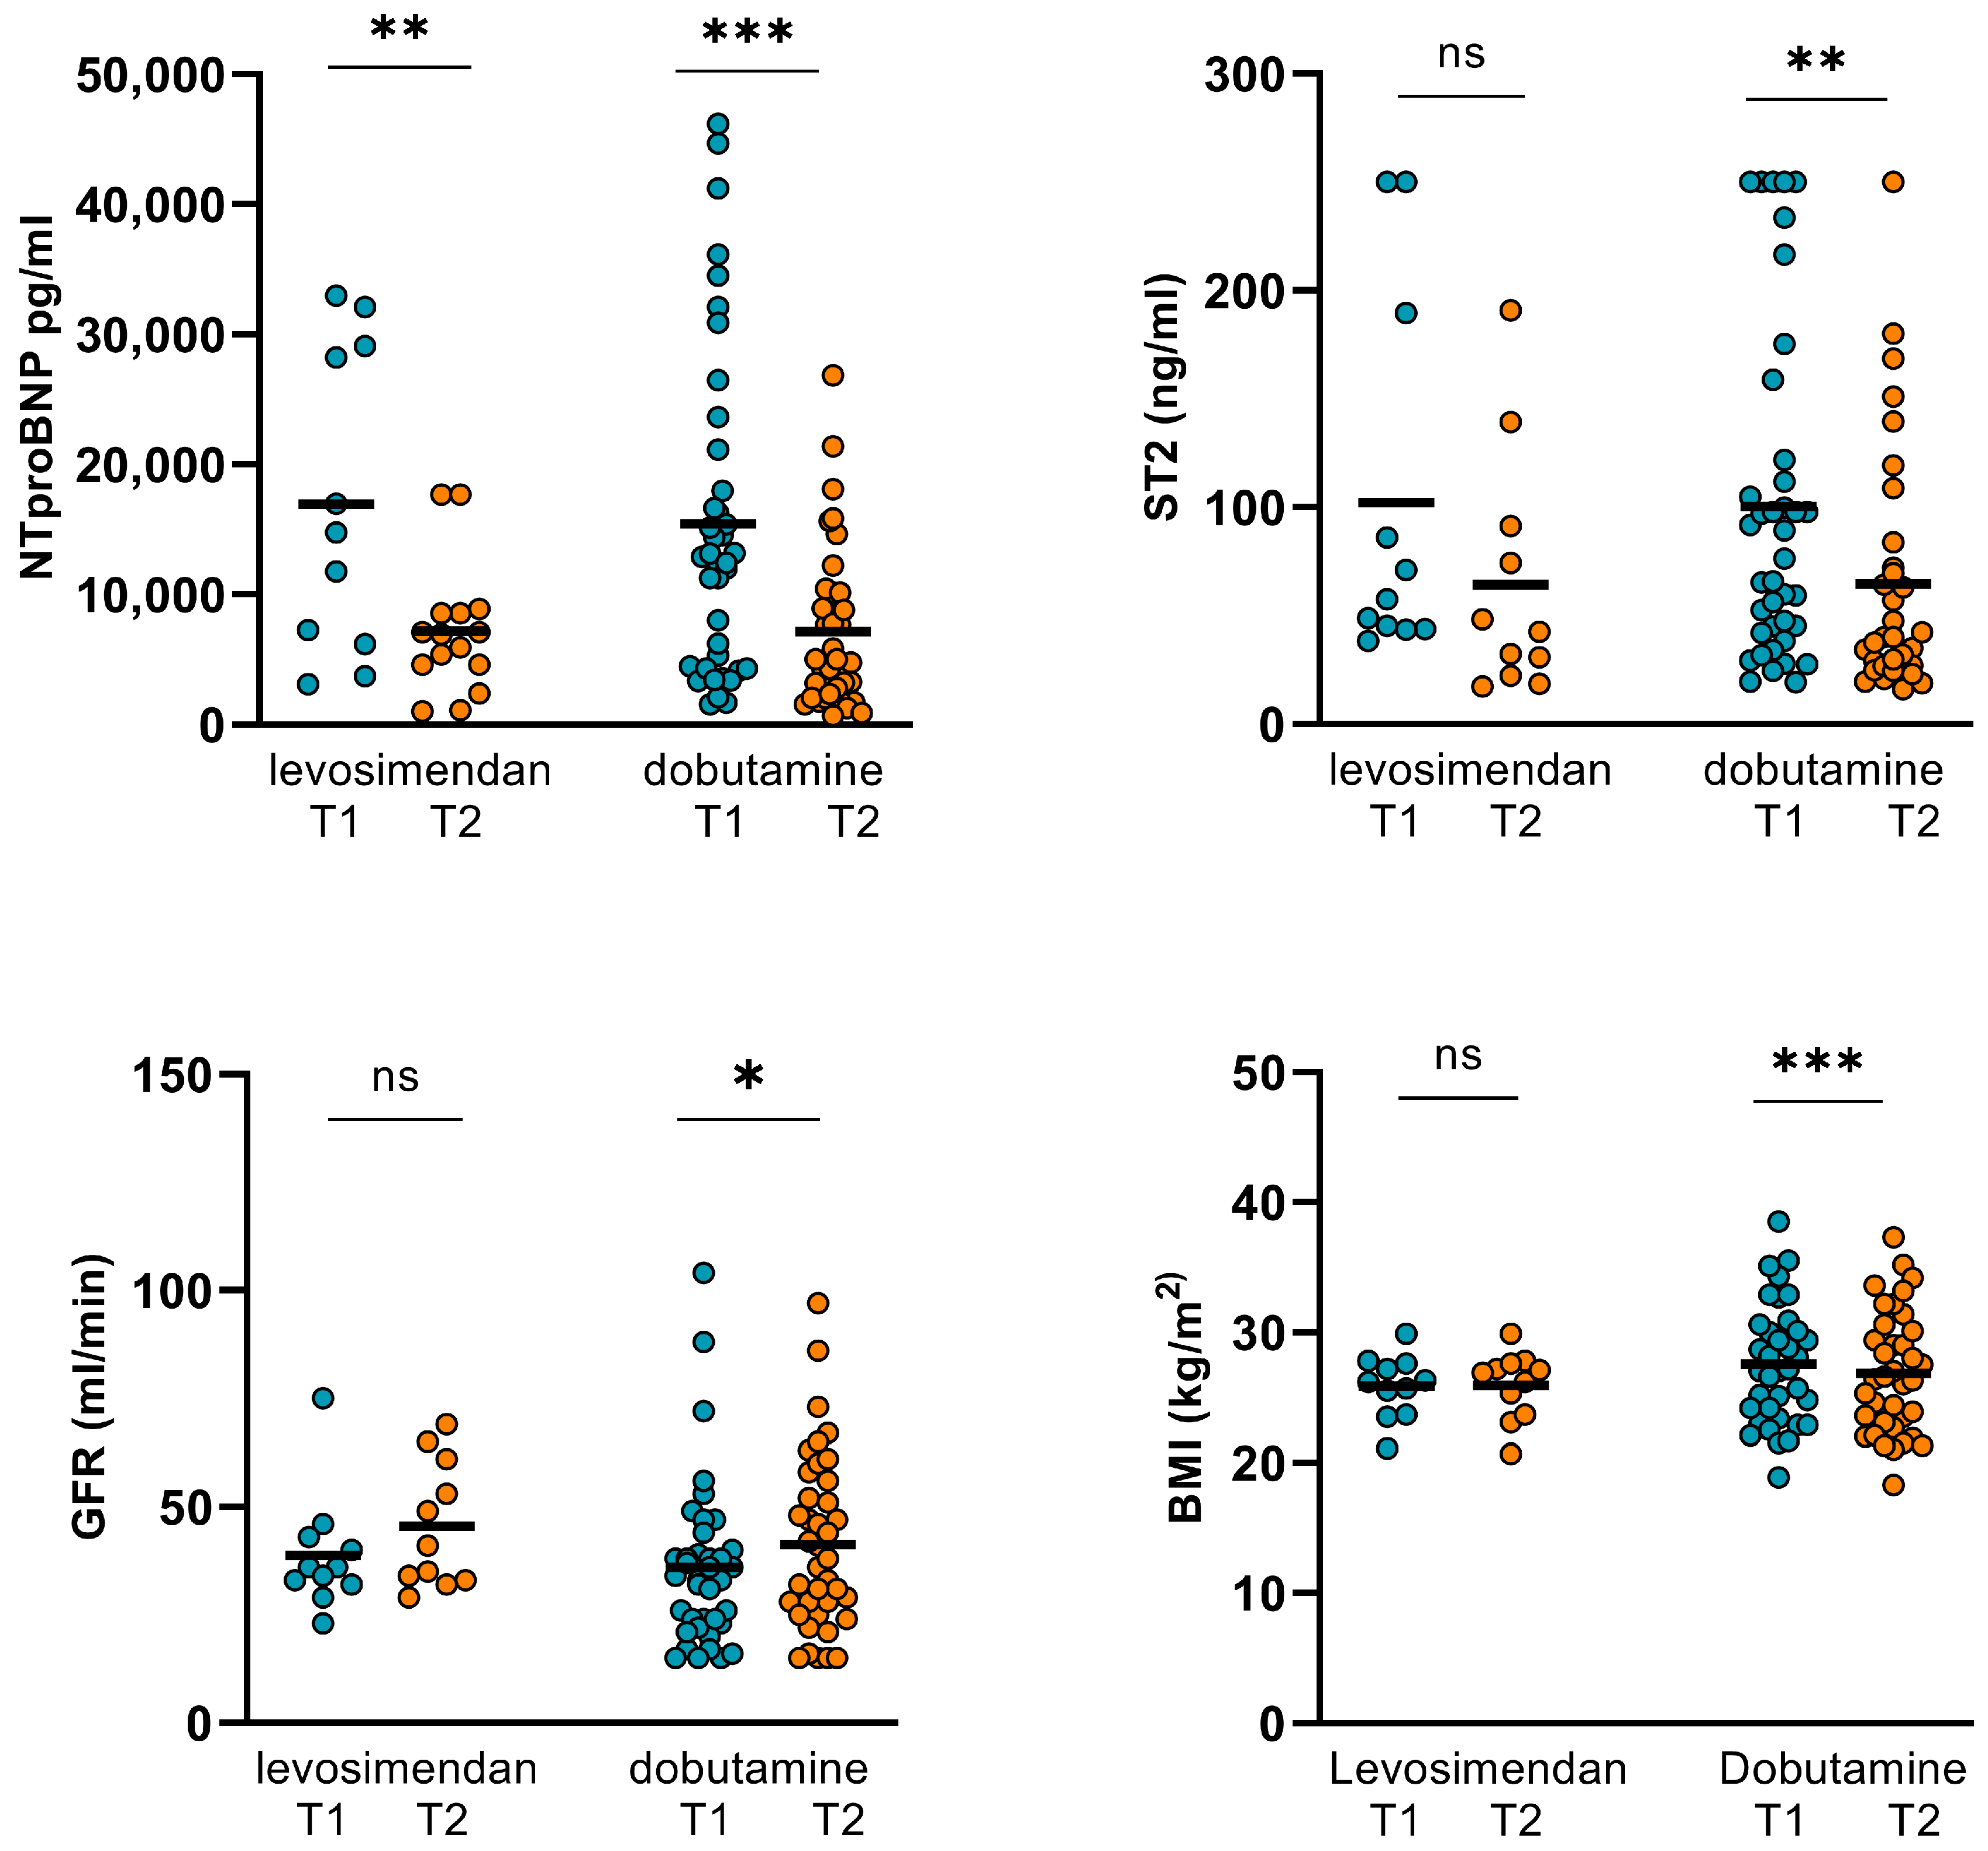
Figure 8.
Changes in hemodynamics and LVEF in AF and SR/PM subgroups. In the AF subgroup CO, CI, SVR, and LVEF did not improve significantly during the inotropic treatment. In the SR/PM subgroup, however, both CO and CI increased significantly from 5.64 ± 1.86 L/min (T1) to 6.39 ± 2.48 L/min (T2; p = 0.023) and from 2.96 ± 0.97 L/min/m2 (T1) to 3.38 ± 1.31 L/min/m2 (T2; p = 0.018). SVR and LVEF were not altered significantly in this subgroup (CO: cardiac output, CI: cardiac index, SVR: systemic vascular resistance, LVEF: left ventricular ejection function. (GFR: glomerular filtration rate, AF: atrial fibrillation, SR: sinus rhythm, PM: pacemaker stimulation, T1: admission, T2: follow-up, ns: not significant, p ≥ 0.05, *: p < 0.05).
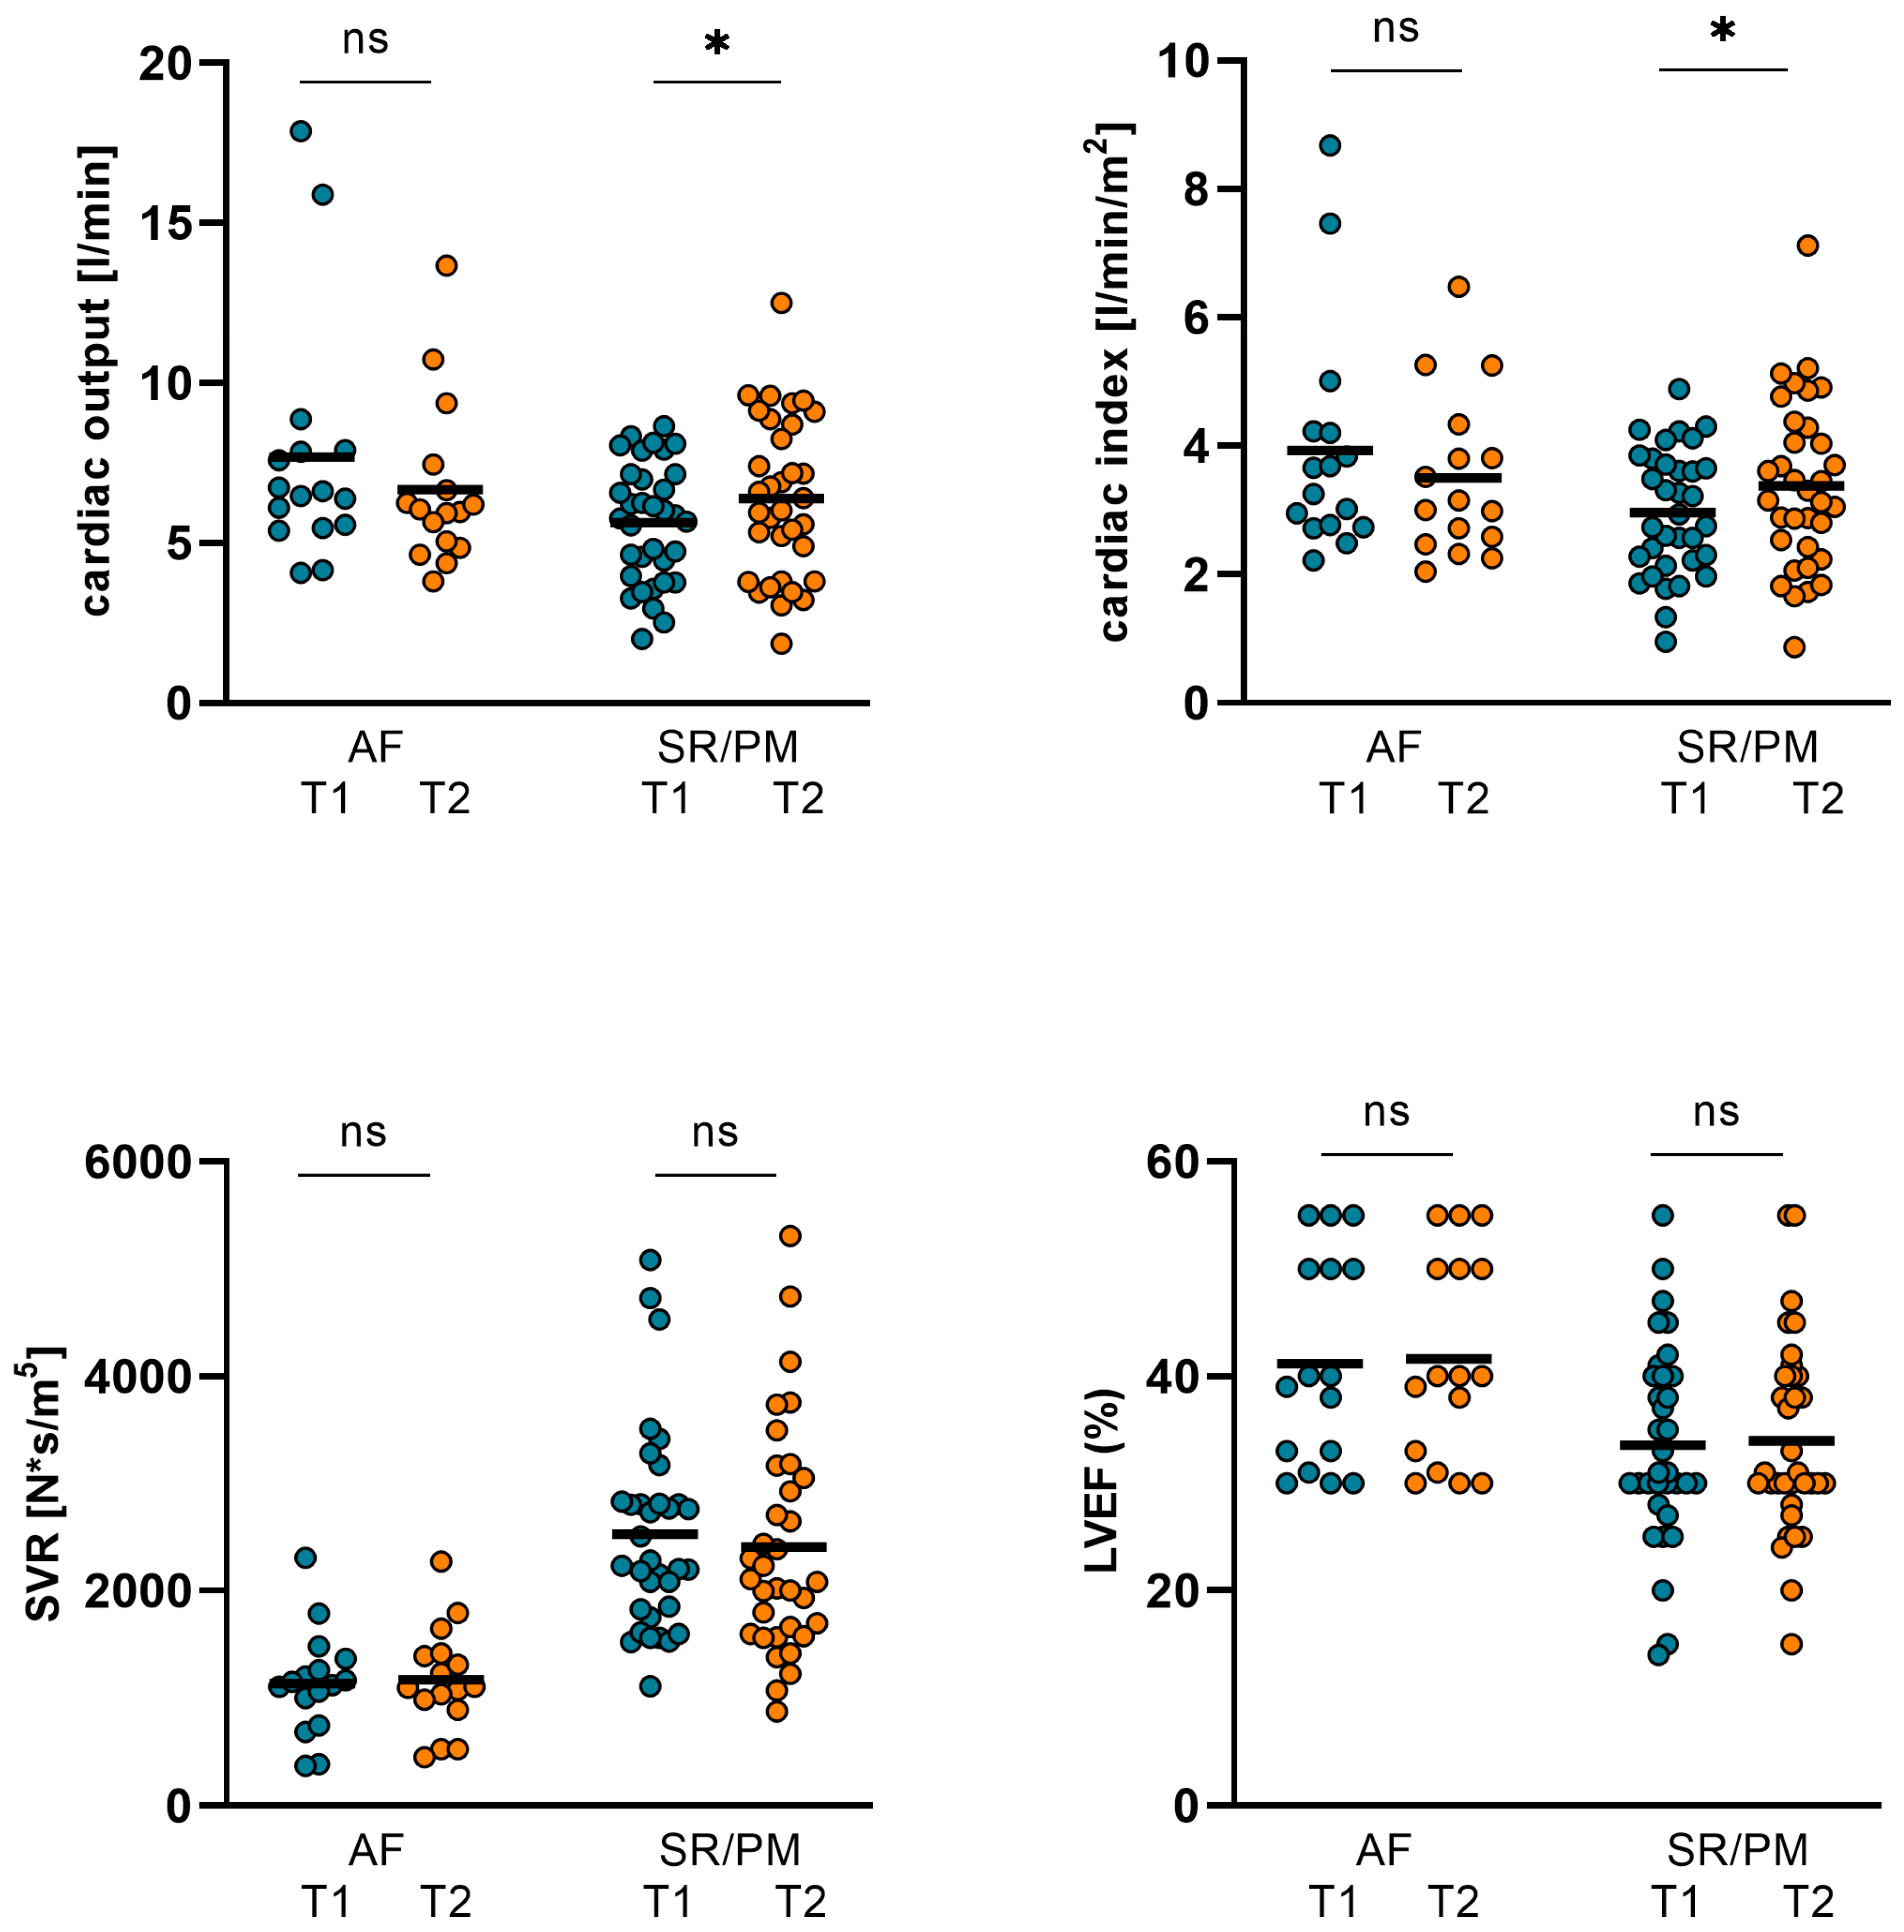
Figure 9.
Changes in NT-proBNP, ST2, GFR, and body weight in AF and SR/PM subgroups. In AF subgroup, NT-proBNP and ST2 dropped significantly from 15184 ± 11474 pg/mL (T1) to 8463 ± 6582 pg/mL (T2; p = 0.017) and from 90.48 ± 68.34 ng/mL (T1) to 65.74 ± 59.17 ng/mL (T2; p = 0.022). Body weight declined considerably from 78.13 ± 14.44 kg (T1) to 75.97 ± 15.27 kg/m2 (T2; p = 0.014). GFR did not improve significantly. In SR/PM subgroup, NT-proBNP dropped considerably from 16038 ± 12752 pg/mL (T1) to 6288 ± 5316 pg/mL (T2; p < 0.001) and ST2 decreased from 105.6 ± 82.05 ng/mL (T1) to 69.93 ± 59.68 ng/mL (T2; p = 0.004). Body weight was reduced from 81.45 ± 15.15 kg to 79.7 ± 15.69 kg (p < 0.001), GFR increased significantly from 35.12 ± 13181 (T1) to 43.03 ± 16539 (T2; p = 0.008). (AF: atrial fibrillation, SR: sinus rhythm, PM: pacemaker stimulation, T1: admission, T2: follow-up, ns: not significant, p ≥ 0.05, *: p < 0.05, **: p ≤ 0.01, ***: p < 0.001).
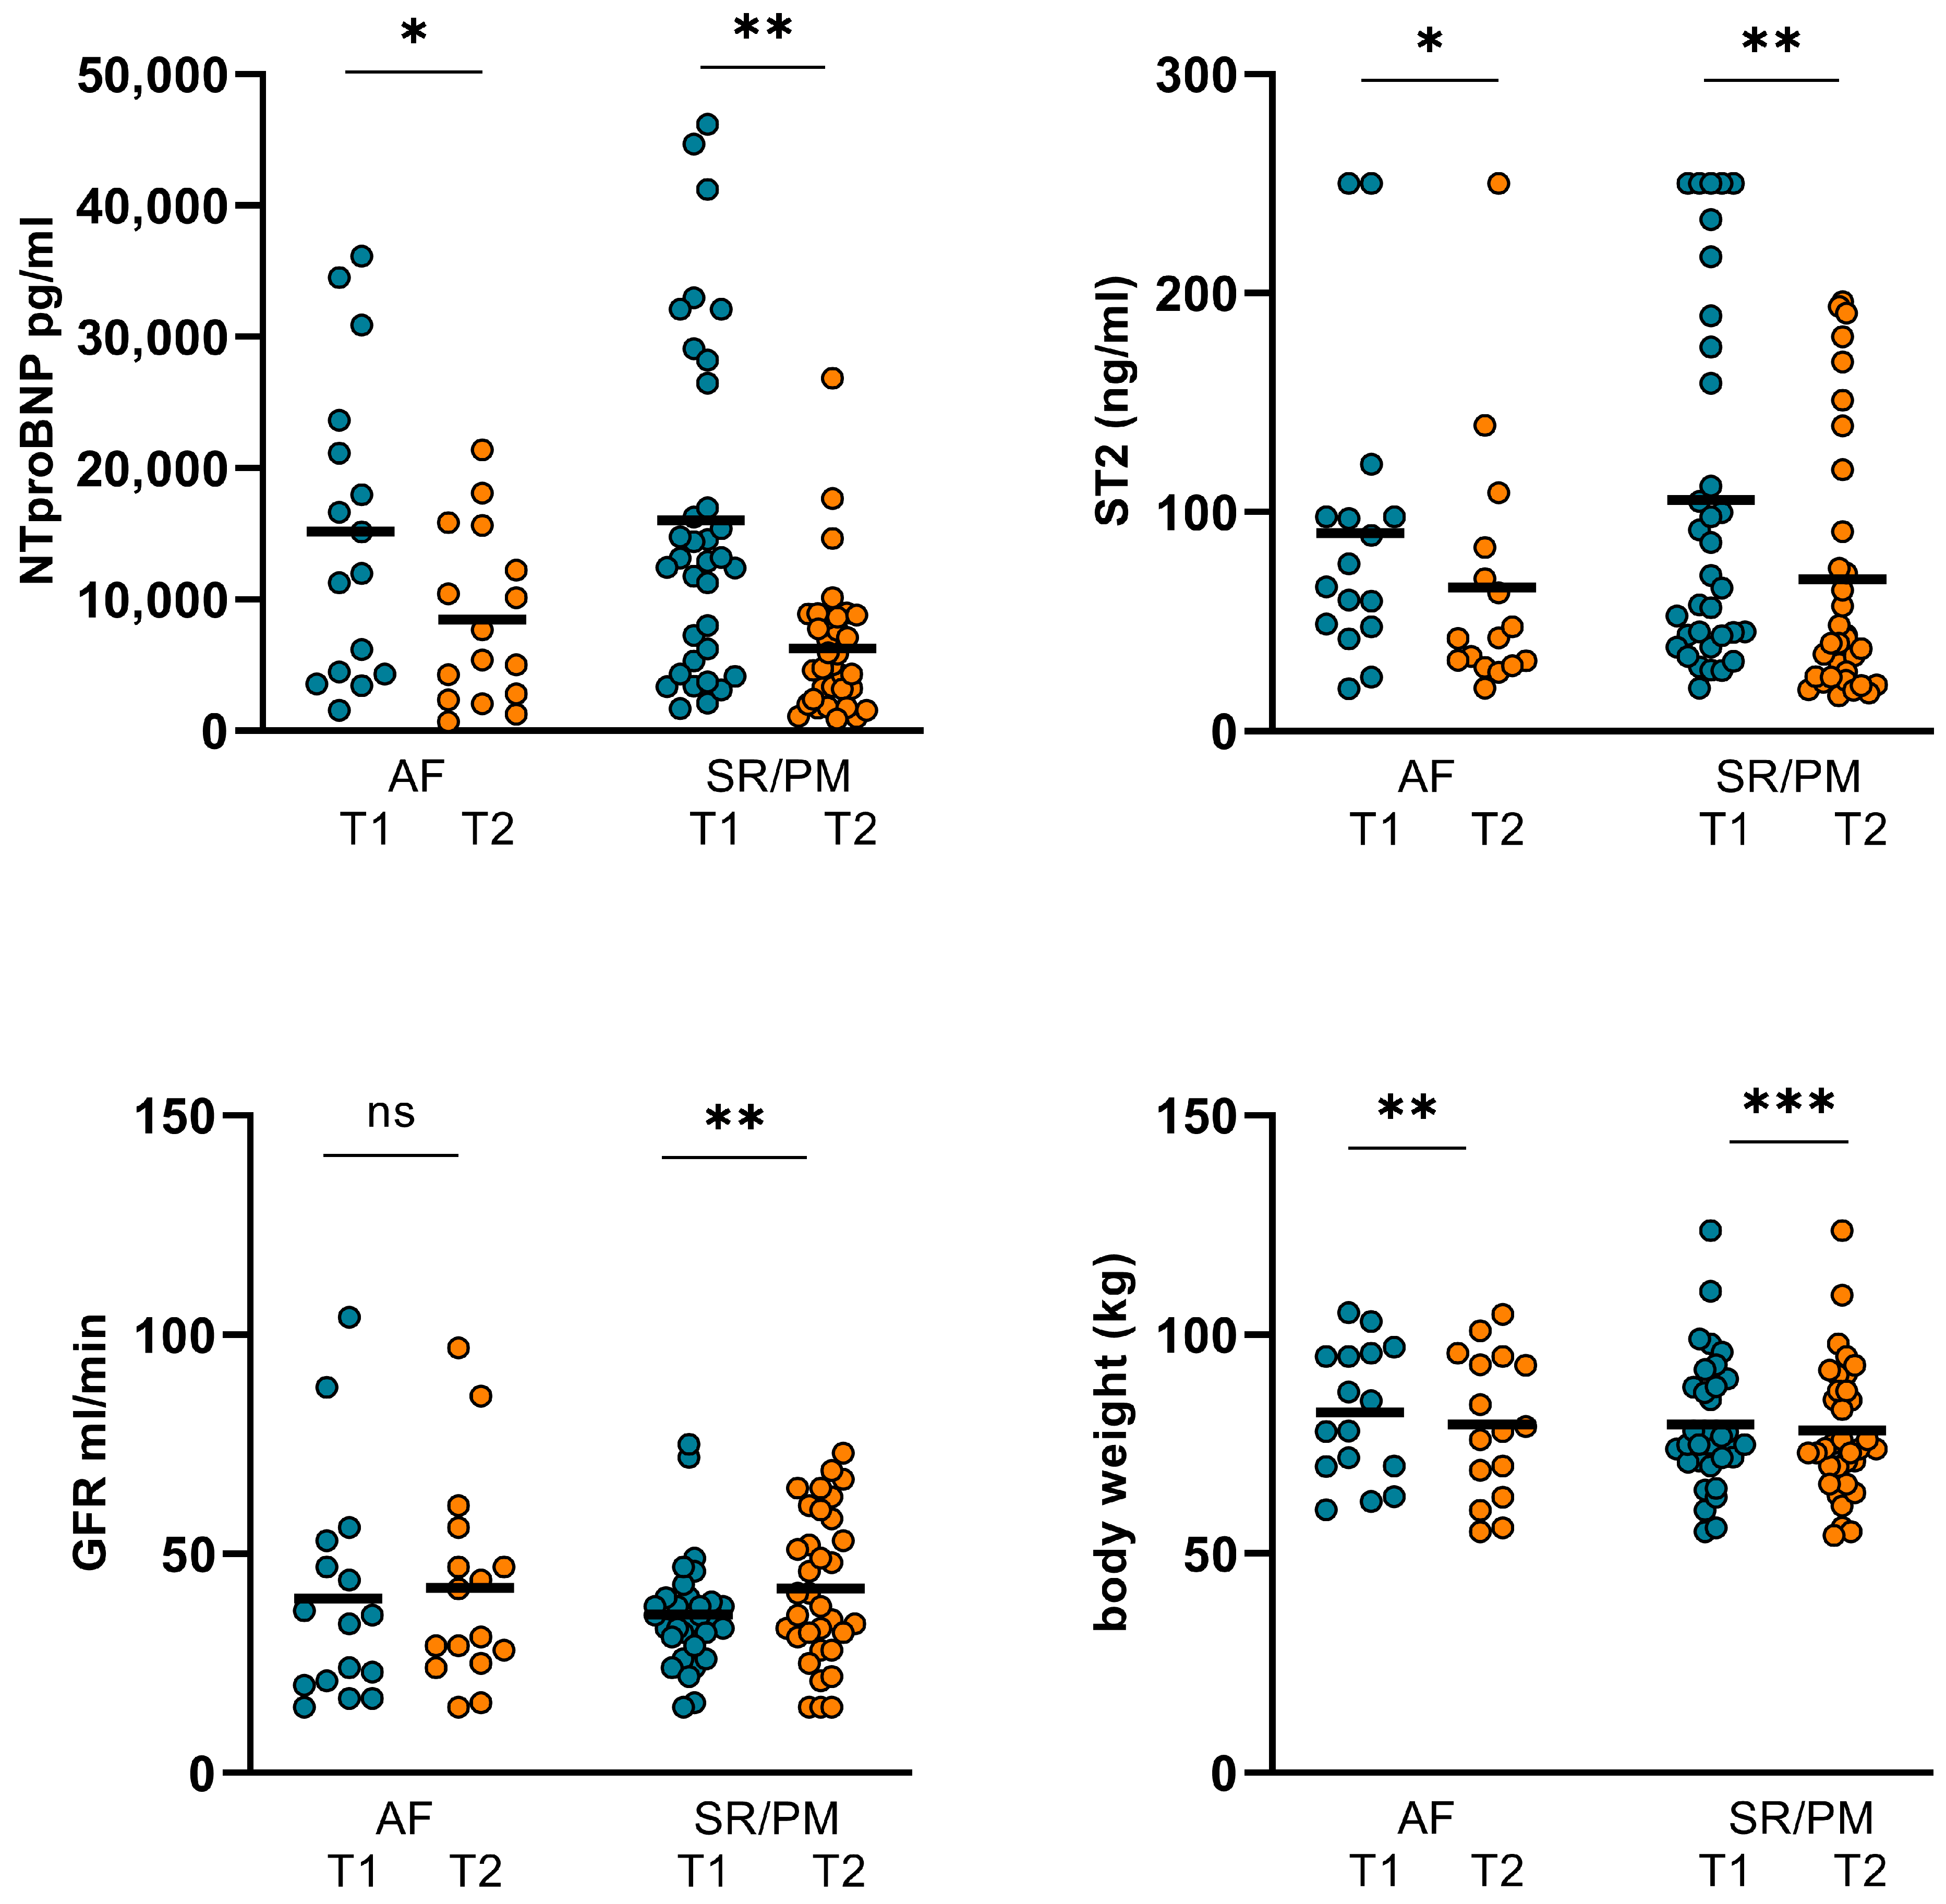
Table 1.
Demographics, baseline characteristics and comorbidities of the overall cohort and in DCM and ICM subgroups.
Table 1.
Demographics, baseline characteristics and comorbidities of the overall cohort and in DCM and ICM subgroups.
| Patient Characteristics | Overall Cohort | DCM Cohort (n = 23/46%) |
ICM Cohort (n = 27/54%) | Comparison of ICM/DCM Subgroups (p-Value) |
|---|---|---|---|---|
| Age (years) | 78 ± 11 | 82.2 ± 8.7 | 76.6 ± 12.5 | 0.132 |
| Female (%) | 28 | 35 | 22 | 0.002 |
| Male (%) | 72 | 65 | 78 | 0.002 |
| Body weight (kg) (at hospital admission) |
80.45 ± 14.87 | 72.36 ± 17.53 | 85.04 ± 15.41 | 0.01 |
| SAP (mmHg) (at hospital admission) |
128.22 ± 27.16 | 125.13 ± 26.03 | 130.85 ± 28.8 | 0.468 |
| DAP (mmHg) (at hospital admission) |
67.46 ± 17.06 | 64.74 ± 19.78 | 69.56 ± 14.62 | 0.328 |
| MAP (mmHg) (at hospital admission) |
94.08 ± 27.01 | 94.93 ± 19.97 | 100.2 ± 20.01 | 0.358 |
| GFR mL/min (at hospital admission) |
36.2 ± 17.99 | 35.6 ± 14.2 | 37.5 ± 21 | 0.709 |
| LVEF (%) (at hospital admission) |
36 ± 10 | 37.48 ± 11.82 | 34.78 ± 8.08 | 0.345 |
| Levosimendan dosage (mg/24 h) (n = 11) |
12 | 12 | 12 | – |
| Dobutamine dosage (µg/kg/min) (n = 39) |
10.5 | 19.12 ± 3.64 | 18.95 ± 4.28 | 0.899 |
| NT-proBNP (pg/mL) (at hospital admission) |
15765 ± 12246 | 15616 ± 12611 | 15891 ± 12167 | 0.938 |
| ST2 (ng/mL) (at hospital admission) |
100.8 ± 77.6 | 103.7 ± 82.7 | 92.3 ± 74.4 | 0.805 |
| Comorbidities | ||||
| Chronic kidney disease (%) | 76.9 | 73.9 | 85.2 | 0.321 |
| Anemia (%) | 34.6 | 30.4 | 40.7 | 0.042 |
| COPD (%) | 32.7 | 26.9 | 40.7 | 0.019 |
| CABG (%) | 11.5 | 4.3 | 18.5 | 0.124 |
| Diabetes (%) | 73.1 | 65.2 | 85.2 | 0.099 |
| Dyslipidemia (%) | 46.2 | 30.4 | 63 | 0.022 |
| Peripheral artery disease (%) | 30.8 | 13 | 48.1 | 0.008 |
| Arterial hypertension (%) | 78.8 | 60.9 | 100 | <0.001 |
| AF paroxysmal (%) | 32.7 | 26.1 | 40.7 | 0.513 |
| AF persistent (%) | 28.8 | 30.4 | 29.6 | 0.951 |
| Duration of in-hospital stay (days) | 13.6 ± 6 | 13 ± 5 | 14.1 ± 6.8 | 0.533 |
Table 2.
Demographics, baseline characteristics and comorbidities of the overall cohort and in AF and SR/PM subgroups.
Table 2.
Demographics, baseline characteristics and comorbidities of the overall cohort and in AF and SR/PM subgroups.
| Patient Characteristics | Overall Cohort | AF Cohort (n = 16/52%) | SR/PM Cohort (n = 34/68%) |
Comparison of AF/ SR-PM Subgroups (p-Value) |
|---|---|---|---|---|
| Age (years) | 78 ± 11 | 83.8 ± 3.3 | 77.7 ± 11.7 | 0.06 |
| Female (%) | 28 | 31.25 | 26.47 | 0.726 |
| Male (%) | 72 | 68.75 | 73.53 | 0.726 |
| Body weight (kg) (at hospital admission) |
80.45 ± 14.87 | 82.27 ± 15.13 | 79.6 ± 14.9 | 0.56 |
| SAP (mmHg) (at hospital admission) |
128.22 ± 27.16 | 130.6 ± 23.8 | 127.1 ± 29.25 | 0.675 |
| DAP (mmHg) (at hospital admission) |
67.46 ± 17.06 | 72.88 ± 15.84 | 64.74 ± 17.38 | 0.119 |
| MAP (mmHg) (at hospital admission) |
94.08 ± 27.01 | 101.75 ± 16.85 | 95.91 ± 21.25 | 0.34 |
| GFR mL/min (at hospital admission) |
36.2 ± 17.99 | 39.75 ± 25.74 | 35.12 ± 13.18 | 0.407 |
| LVEF (%) (at hospital admission) |
36 ± 10 | 41.18 ± 9.8 | 33.6 ± 9.2 | 0.01 |
| Levosimendan dosage (mg/24 h) (n = 11) |
12 | 12 | 12 | – |
| Dobutamine dosage (µg/kg/min) (n = 39) |
10.5 | 18.9 | 20.2 | 0.085 |
| NT-proBNP (pg/mL) (at hospital admission) |
15765 ± 12246 | 15183 ± 11474 | 16038 ± 12752 | 0.821 |
| ST2 (ng/mL) (at hospital admission) |
100.8 ± 77.6 | 90.48 ± 68.34 | 105.6 ± 82.05 | 0.526 |
| Comorbidities | ||||
| Chronic kidney disease (%) | 76.9 | 87.5 | 73.98 | 0.309 |
| Anemia (%) | 34.6 | 25 | 42.11 | 0.288 |
| COPD (%) | 32.7 | 43.75 | 26.32 | 0.279 |
| CABG (%) | 11.5 | 6.25 | 10.53 | 0.653 |
| Diabetes (%) | 73.1 | 75 | 73.68 | 0.929 |
| Dyslipidemia (%) | 46.2 | 62.5 | 42.11 | 0.229 |
| Peripheral artery disease (%) | 30.8 | 25 | 21.05 | 0.782 |
| Arterial hypertension (%) | 78.8 | 93.75 | 73.68 | 0.117 |
| AF paroxysmal (%) | 32.7 | – | – | – |
| AF persistent (%) | 28.8 | – | – | – |
| Duration of in-hospital stay (days) | 13.6 ± 6 | 14.63 ± 7.06 | 13.09 ± 5.46 | 0.403 |
Table 3.
Heart failure medication of the patients at submission and at discharge.
Table 3.
Heart failure medication of the patients at submission and at discharge.
| HF Pharmacological Treatment | At Admission (n = 50) (n/%) |
At Discharge (n = 43) (n/%) |
|---|---|---|
| Beta blockers | 28/56 | 30/69.7 |
| Spironolactone | 16/32 | 27/62.8 |
| ACEI/ARB | 29/58 | 24/55.8 |
| Diuretics | 44/88 | 41/95.3 |
| Other vasodilators | 16/32 | 10/23.3 |
| ARNI | 11/22 | 15/35 |
| SGLTi | 17/34 | 33/77 |
Table 4.
Changes in hemodynamics, LVEF, GFR, NT-proBNP, ST2, body weight, and LVEF in the overall cohort.
Table 4.
Changes in hemodynamics, LVEF, GFR, NT-proBNP, ST2, body weight, and LVEF in the overall cohort.
| Baseline (T1) | Follow-Up (T2) | p Value | |
|---|---|---|---|
| CO (L/min) | 6.3 ± 2.78 | 6.48 ± 2.49 | 0.245 |
| CI (L/min/m2) | 3.27 ± 1.35 | 3.42 ± 1.29 | 0.173 |
| SVR (N*s/m5) | 1263 ± 480 | 1247 ± 542 | 0.84 |
| GFR (mL/min) | 36.63 ± 18.1 | 42.8 ± 18.82 | 0.01 |
| NT-proBNP (pg/mL) | 15765 ± 12246 | 6984 ± 5775 | <0.001 |
| ST2 (ng/mL) | 102.76 ± 77.55 | 68.59 ± 58.94 | <0.001 |
| body weight (kg) | 80.45 ± 14.87 | 78.58 ± 15.5 | <0.001 |
| LVEF (%) | 36.02 ± 9.96 | 36.42 ± 9.82 | 0.498 |
Table 5.
Changes in hemodynamics, LVEF, GFR, NT-proBNP, ST2, body weight, and LVEF in DCM and ICM subgroups.
Table 5.
Changes in hemodynamics, LVEF, GFR, NT-proBNP, ST2, body weight, and LVEF in DCM and ICM subgroups.
| DCM (T1) n = 23 |
DCM (T2) n = 23 |
p Value | ICM (T1) n = 27 |
ICM (T2) n = 27 |
p Value | |
|---|---|---|---|---|---|---|
| CO (L/min) | 6.09 ± 2.58 | 6.82 ± 2.57 | 0.036 | 6.47 ± 2.98 | 6.19 ± 2.43 | 0.829 |
| CI (L/min/m2) | 3.26 ± 1.18 | 3.74 ± 1.27 | 0.013 | 3.28 ± 1.5 | 3.15 ± 1.26 | 0.77 |
| SVR (N*s/m5) | 1241 ± 469 | 1221 ± 595 | 0.859 | 1282 ± 496 | 1269 ± 503 | 0.581 |
| GFR (mL/min) | 35.55 ± 14.16 | 41.55 ± 15.86 | 0.062 | 37.52 ± 21.01 | 43.81 ± 21.18 | 0.082 |
| NTproBNP (pg/mL) | 15616 ± 12611 | 6170 ± 4467 | 0.001 | 15891 ± 12167 | 7677 ± 6700 | 0.001 |
| ST2 (ng/mL) | 103.74 ± 82.67 | 64.19 ± 53.9 | 0.001 | 98.22 ± 74.42 | 72.34 ± 63.67 | 0.042 |
| body weight (kg) | 74.81 ± 12.34 | 72.31 ± 12.04 | <0.001 | 85.26 ± 15.37 | 83.93 ± 15.63 | 0.008 |
| LVEF (%) | 37.48 ± 11.82 | 37.74 ± 10.93 | 0.758 | 24.78 ± 8.08 | 25.3 ± 8.82 | 0.251 |
Table 6.
Changes in hemodynamics, LVEF, Creatinine, GFR, NT-proBNP, ST2, body weight, and LVEF in levosimendan and dobutamine subgroups.
Table 6.
Changes in hemodynamics, LVEF, Creatinine, GFR, NT-proBNP, ST2, body weight, and LVEF in levosimendan and dobutamine subgroups.
| Levosimendan (T1) n = 11 |
Levosimendan (T2) n = 11 |
p Value | Dobutamine (T1) n = 39 |
Dobutamine (T2) n = 39 |
p Value | |
|---|---|---|---|---|---|---|
| CO (L/min) | 4.55 ± 1.62 | 5.47 ± 2.44 | 0.044 | 6.79 ± 2.86 | 6.77 ± 2.46 | 0.748 |
| CI (L/min/m2) | 2.39 ± 0.76 | 2.87 ± 1.18 | 0.05 | 3.52 ± 1.38 | 3.58 ± 1.29 | 0.562 |
| SVR (N*s/m5) | 1478 ± 410 | 1392 ± 564 | 0.636 | 1203 ± 485 | 1206 ± 536 | 0.596 |
| GFR (mL/min) | 38.8 ± 13.59 | 45.55 ± 14.54 | 0.202 | 36 ± 19.32 | 42 ± 19.99 | 0.029 |
| NT-proBNP (pg/mL) | 16931 ± 11701 | 6337 ± 4653 | 0.004 | 15436 ± 12524 | 7166 ± 6095 | <0.001 |
| ST2 (ng/mL) | 102.23 ± 84.58 | 64.41 ± 56.01 | 0.16 | 100.34 ± 76.63 | 69.77 ± 60.4 | 0.003 |
| body weight (kg) | 78.19 ± 10.62 | 78.51 ± 11.32 | 0.595 | 81.09 ± 15.93 | 78.61 ± 16.6 | <0.001 |
| LVEF (%) | 28.82 ± 9.93 | 30.28 ± 8.63 | 0.317 | 38.05 ± 9.1 | 38.15 ± 9.52 | 0.916 |
Table 7.
Changes in hemodynamics, LVEF, GFR, NT-proBNP, ST2, body weight and LVEF in AF and SR/PM subgroups. (AF: atrial fibrillation, SR: sinus rhythm, PM: pacemaker stimulation).
Table 7.
Changes in hemodynamics, LVEF, GFR, NT-proBNP, ST2, body weight and LVEF in AF and SR/PM subgroups. (AF: atrial fibrillation, SR: sinus rhythm, PM: pacemaker stimulation).
| AF (T1) n = 16 |
AF (T2) n = 16 |
p Value | SR/PM (T1) n = 34 |
SR/PM (T2) n = 34 |
p Value | |
|---|---|---|---|---|---|---|
| CO (L/min) | 7.69 ± 3.83 | 6.67 ± 2.58 | 0.352 | 5.64 ± 1.86 | 6.39 ± 2.48 | 0.023 |
| CI (L/min/m2) | 3.93 ± 1.79 | 3.5 ± 1.26 | 0.438 | 2.96 ± 0.97 | 3.38 ± 1.31 | 0.018 |
| SVR (N*s/m5) | 1138 ± 484 | 1173 ± 479 | 0.818 | 1322 ± 473 | 1282 ± 579 | 0.369 |
| GFR (mL/min) | 39.75 ± 25.74 | 42.31 ± 23.44 | 0.665 | 35.12 ± 13.181 | 43.03 ± 16.539 | 0.008 |
| NT-proBNP (pg/mL) | 15184 ± 11474 | 8463 ± 6582 | 0.017 | 16038 ± 12752 | 6288 ± 5316 | <0.001 |
| ST2 (ng/mL) | 90.48 ± 68.34 | 65.74 ± 59.17 | 0.022 | 105.6 ± 82.05 | 69.93 ± 59.68 | 0.004 |
| body weight (kg) | 78.13 ± 14.44 | 75.97 ± 15.27 | 0.014 | 81.45 ± 15.15 | 79.7 ± 15.69 | <0.001 |
| LVEF (%) | 41.19 ± 9.79 | 41.63 ± 9.55 | 0.33 | 33.59 ± 9.21 | 33.97 ± 9.08 | 0.752 |